
On June 4, the TRON price (TRX) reached a low of $0.031. An upward move ensued and the price made a high of $0.036 during the same day. It has been decreasing since.
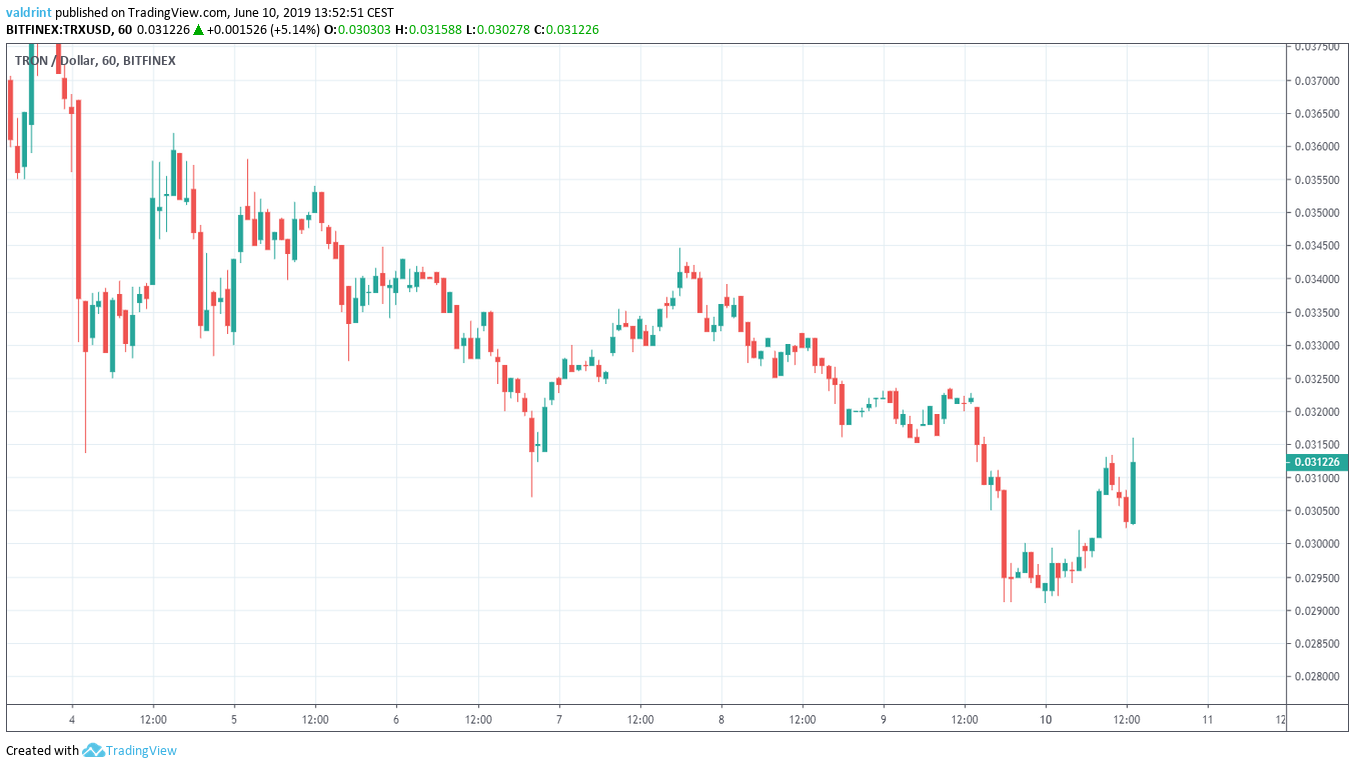
After reaching lows near $0.029 on June 10, the TRON (TRX) price began to increase.
In order to try and predict its future movements, we are going to analyze the price on different time-frames alongside technical indicators.
For video analysis, please click below:
TRON Price (TRX): Trends and Highlights for June 10
- The TRON price reached a high on June 4.
- It is trading inside a descending channel.
- It previously broke down from a descending triangle.
- The moving averages have made a bearish cross.
- There is support near $0.026.
Descending Channel
The price of TRX/USD is analyzed at one-hour intervals in order to trace its current pattern.
On June 4, the TRON price (TRX) reached a low of $0.031. An upward move ensued and the price made a high of $0.036 during the same day.
Since then, it has been decreasing, trading inside the descending channel outlined below:
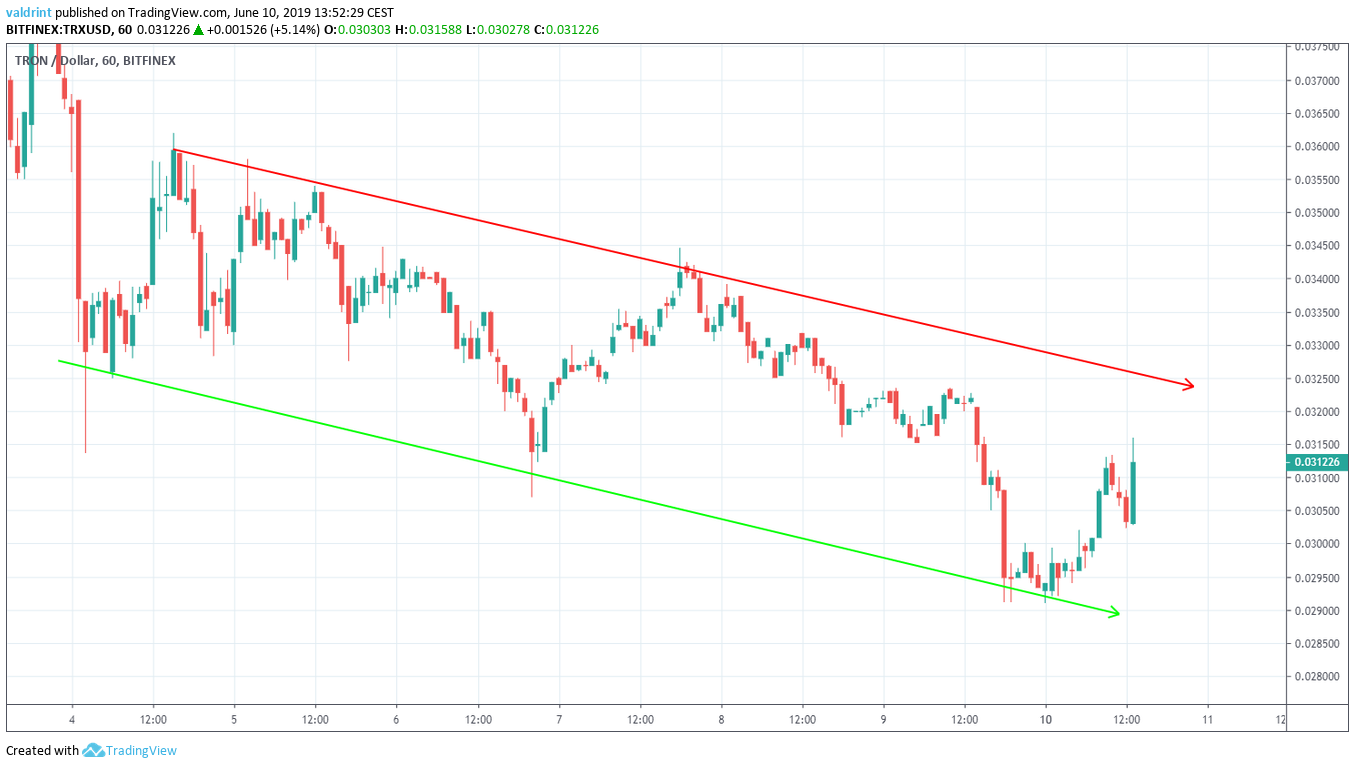
At the time of writing, it was trading in the middle of the channel, after bouncing from the support line on June 10.
Will it break out from the resistance? Let’s look at some technical indicators and find out.
Previous Movement & Moving Averages
The TRON price (TRX) is analyzed at six-hour intervals volume (first graph) and the 10-, 20-, and 100-period moving averages (MA) below:
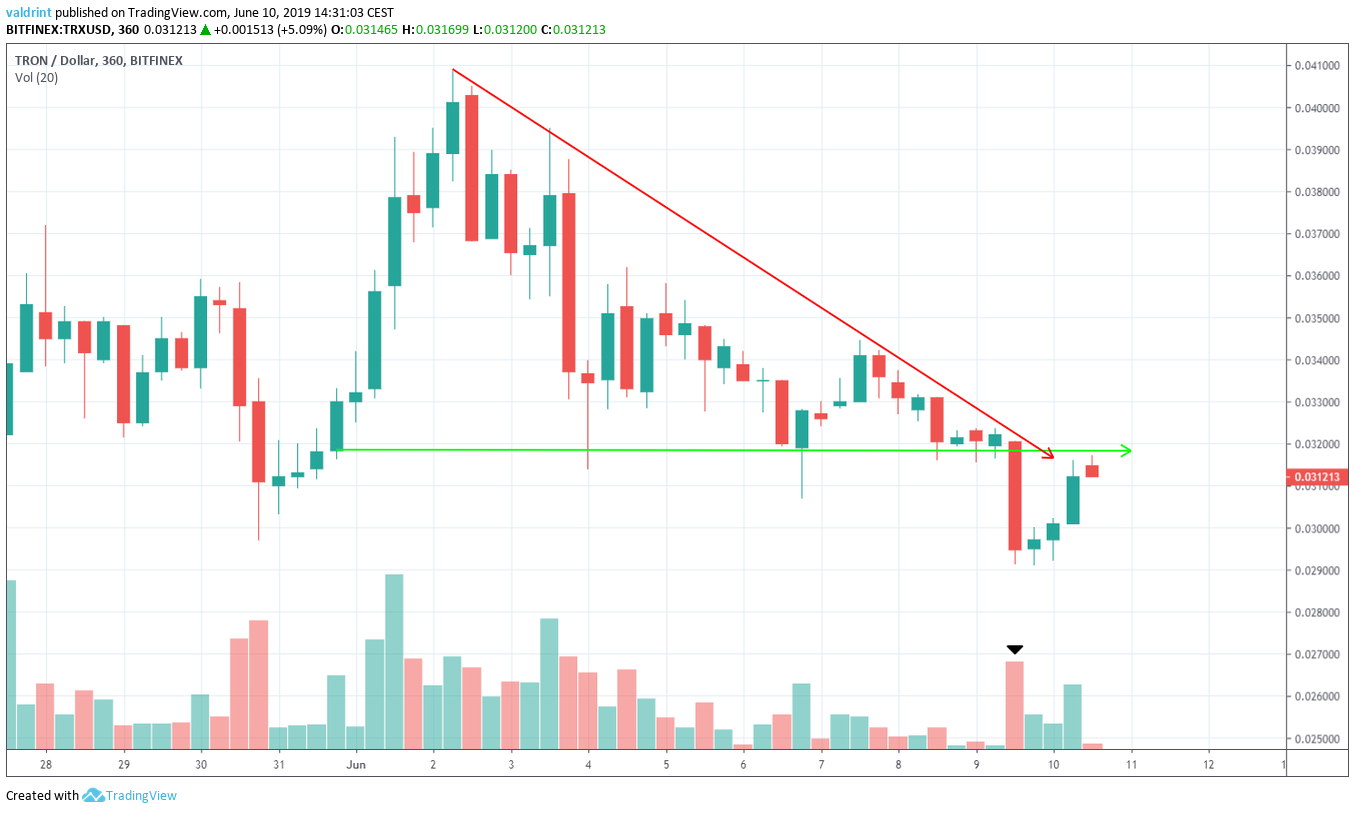
Since reaching highs on June 4, the price has been trading inside a descending triangle. It broke down from it on June 9.
The breakout occurred with significant volume, indicating that the sellers have strength. Afterward, the price created the descending channel outlined below:
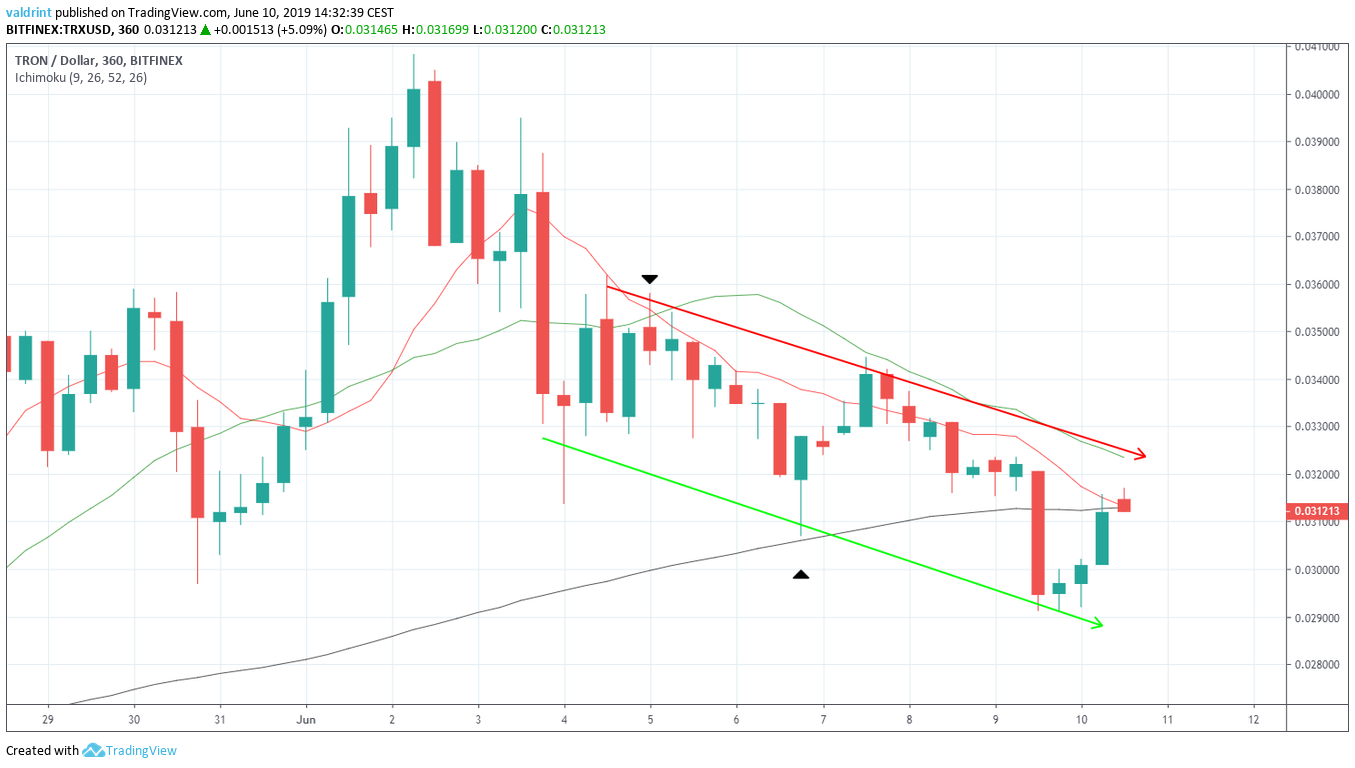
Furthermore, a bearish cross between the 10- and 20-period moving averages occurred on June 5. This often indicates that a downtrend has begun. Afterward, the 10-period MA offered very close resistance to the price.
Additionally, the TRON price (TRX) fell below the 100-period MA on June 9. Previously, the MA had offered support for the price on June 6.
The use of these indicators makes a breakout from the channel unlikely. Rather, it is likely that it will continue to decrease at the rate predicted by the channel until it finds a support area in which it can possibly initiate a reversal.
TRON Price (TRX): Reversal Areas
One support area is outlined below for TRX/USD.
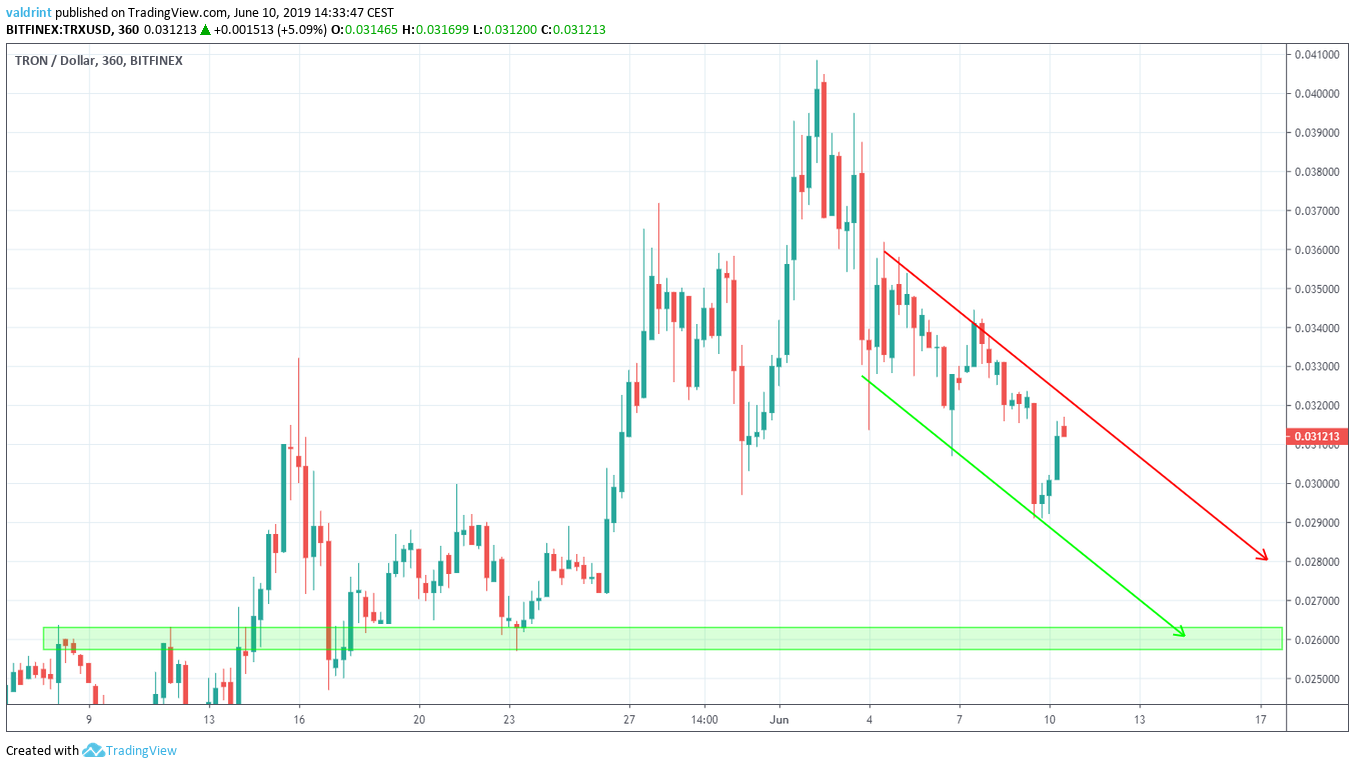
The closest support area is found near $0.026. If the TRON price (TRX) keeps decreasing at the rate predicted by the channel, it should reach this area on June 16. The analysis of technical indicators supports this hypothesis.
Summary
The TRON price (TRX) reached a high on June 4. Since then, it has been decreasing, trading inside a descending channel. Previously, the price broke down from a descending triangle with significant volume. An analysis of technical indicators support continued price decreases.
What do you think of this altcoin analysis? Let us know in the comments below!
Disclaimer: This article is not trading advice and should not be construed as such. Always consult a trained financial professional before investing in cryptocurrencies, as the market is particularly volatile.
