


On July 17, 2019, the Tron (TRX) price reached a low of 222 satoshis. An upward move ensued. Tron reached highs above 280 satoshis on July 20 and 22. It has been decreasing since, reaching levels close to the low on July 17.
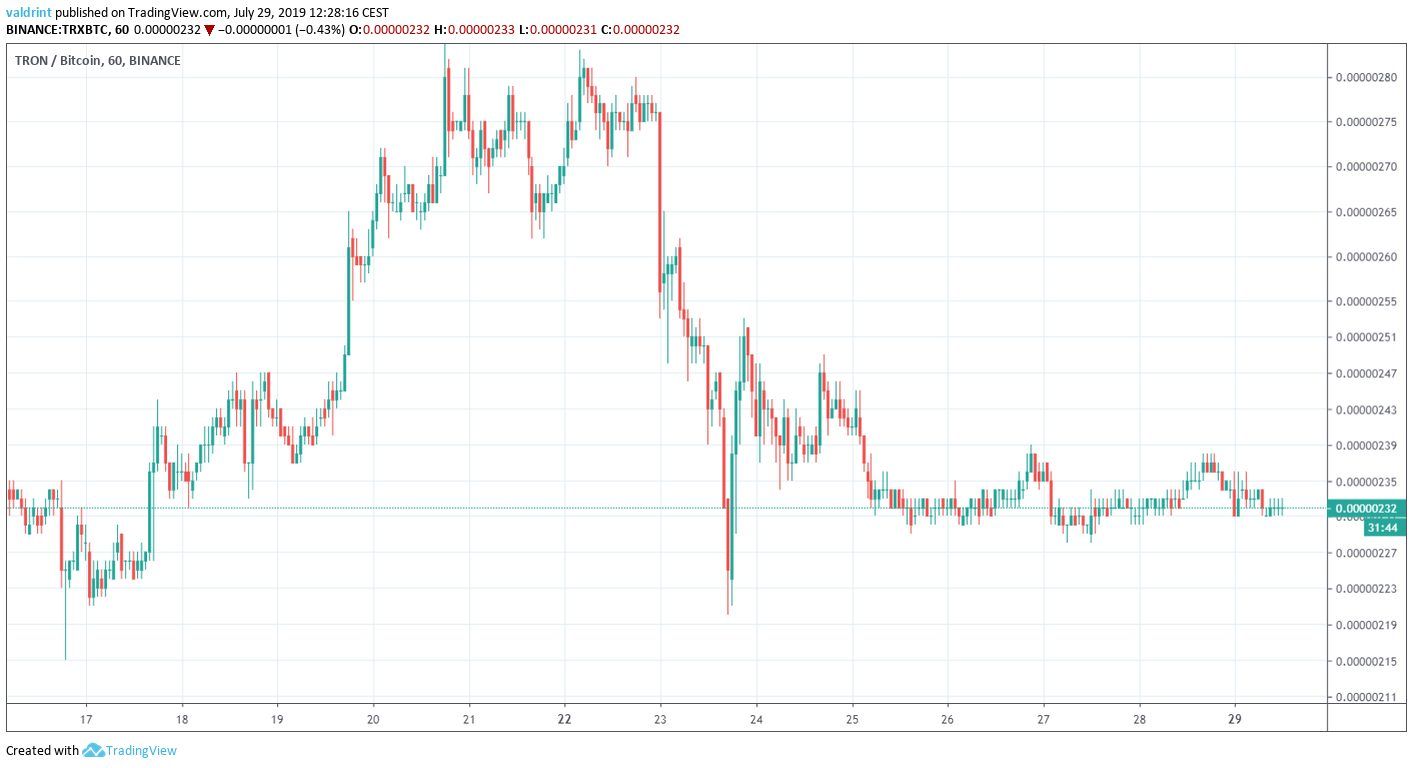
At the time of writing, it was trading at 235 satoshis.
In what direction will TRX go next? Keep reading below in order to find out.
For our previous analysis, click here.
If you would like to trade TRON (TRX) on Binance, click here to sign up for the popular altcoin exchange!
TRON Price: Trends and Highlights for July 29
- TRX/BTC is trading inside a descending broadening wedge.
- There is significant resistance at 290 satoshis.
- TRX is following a long-term descending resistance line.
- Daily moving averages have almost made a bullish cross.
- There is a very significant bullish divergence developing in the RSI & MACD.
Tron Price Current Pattern
Since reaching a low of 272 satoshis on June 27, the TRX price has been decreasing, trading inside the descending broadening wedge outlined below.
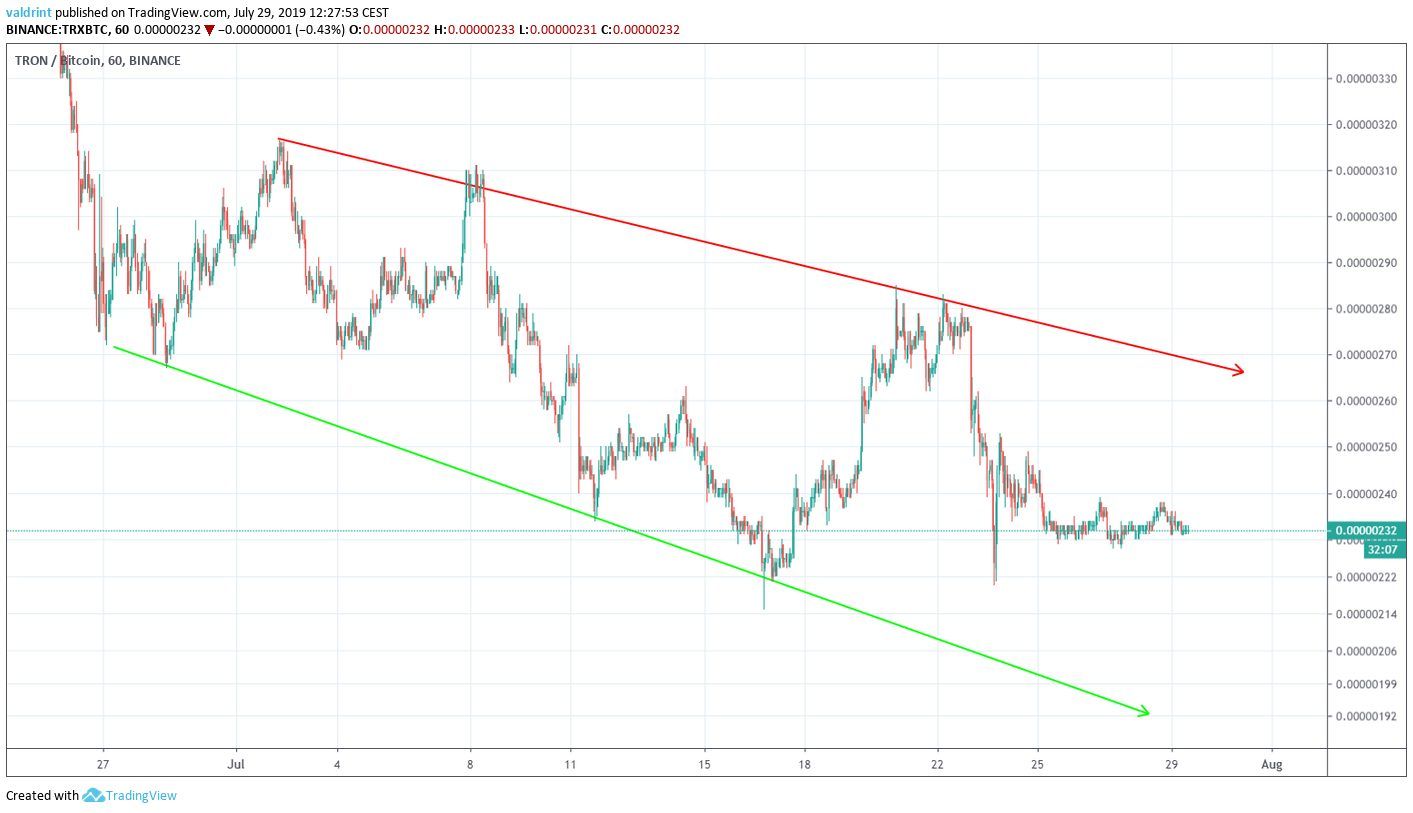
The wedge is considered a bullish pattern, making price breakouts more likely.
At the time of writing, the price was trading in the middle of the wedge.
In order to try and predict future movement, we need to take a look at a longer-term time-frame.
Long-Term Resistance
A look at the daily time-frame shows that the TRX price has been following a descending resistance line since the beginning of January 2019.
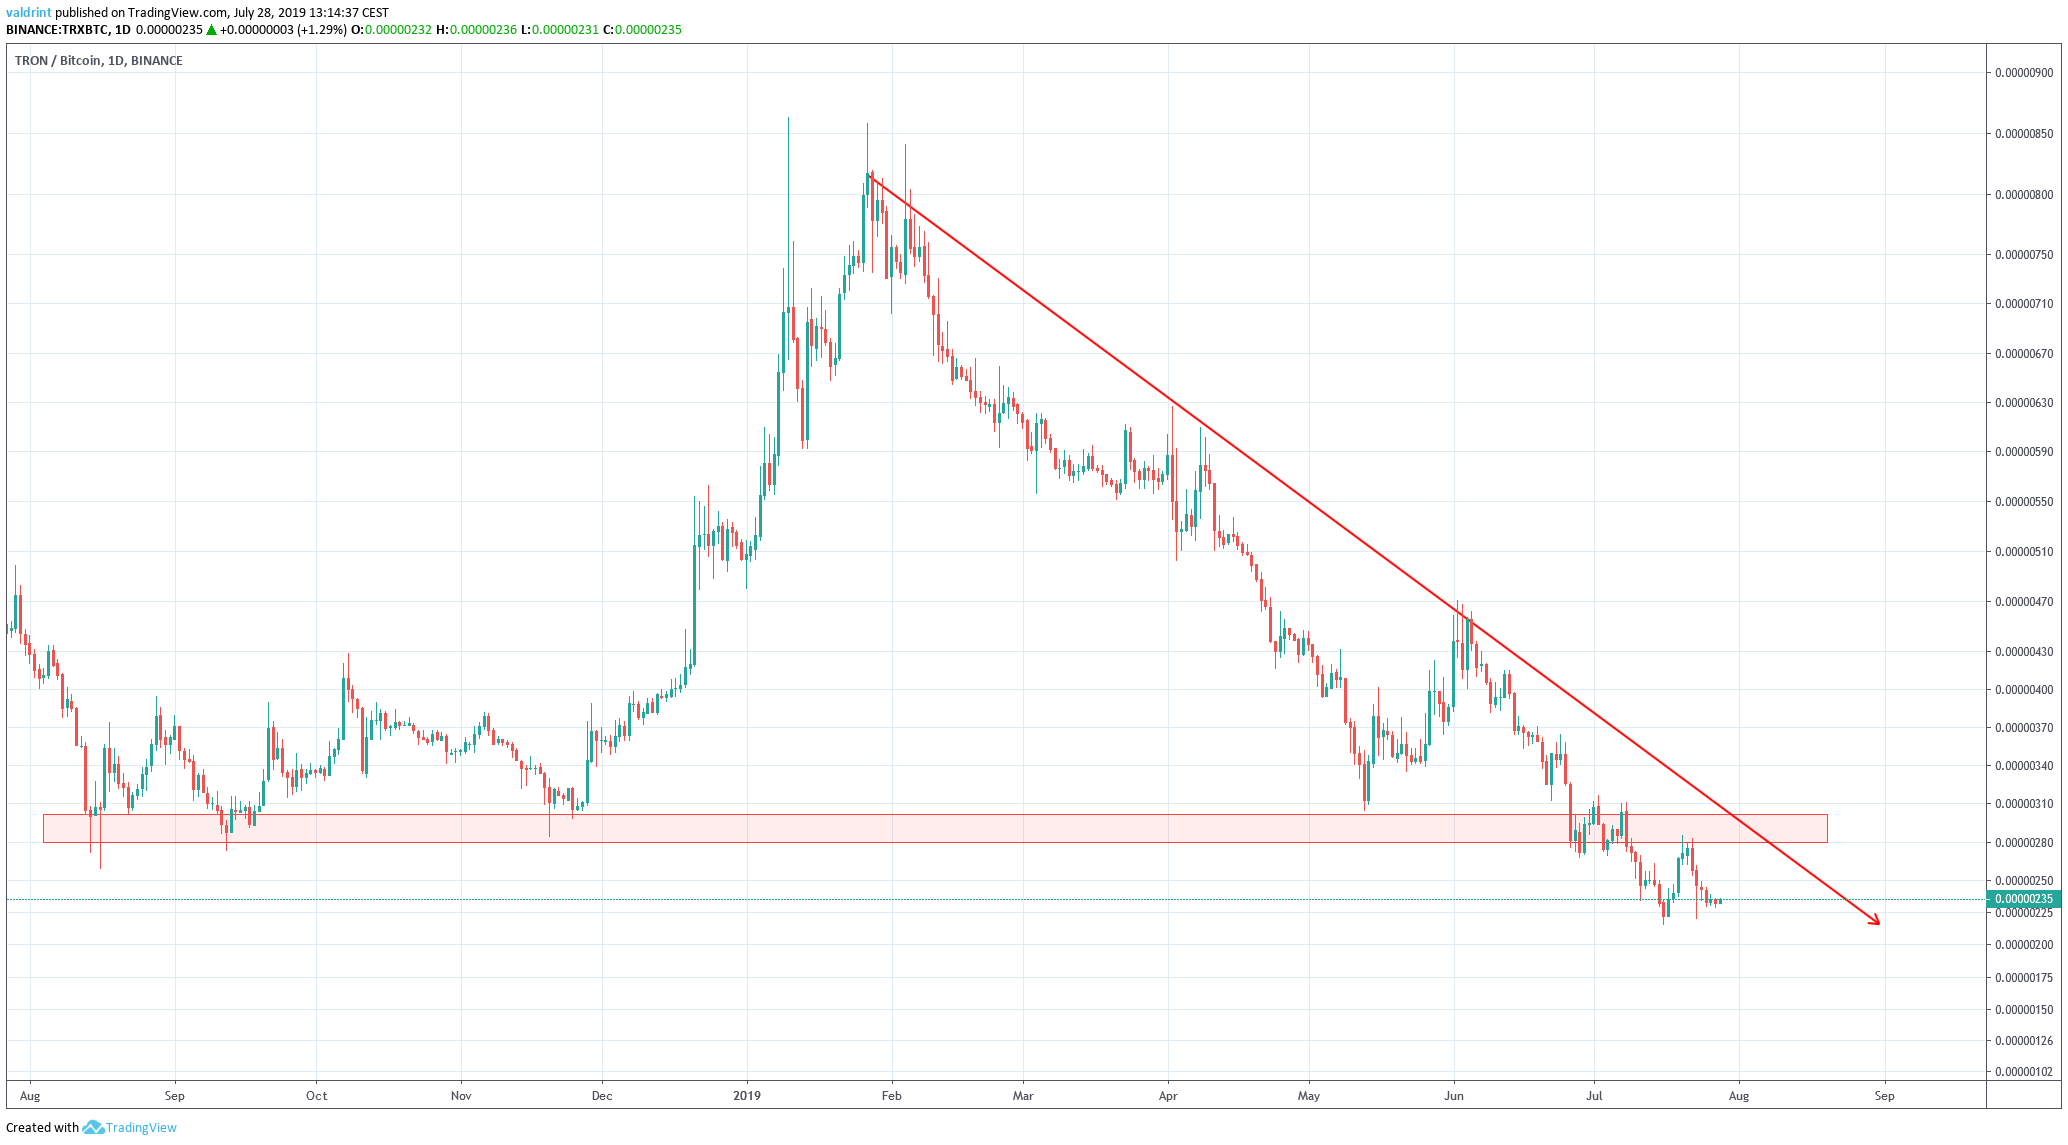
Furthermore, we can see that the 290 satoshi area acted as support in the period from Aug 2018 to July 2019.
However, the TRX price broke down at the beginning of July.
Afterward, it touched it on July 21 and validated it as resistance.
Therefore, the 290 satoshi area is considered a very significant resistance area.
Technical Indicators
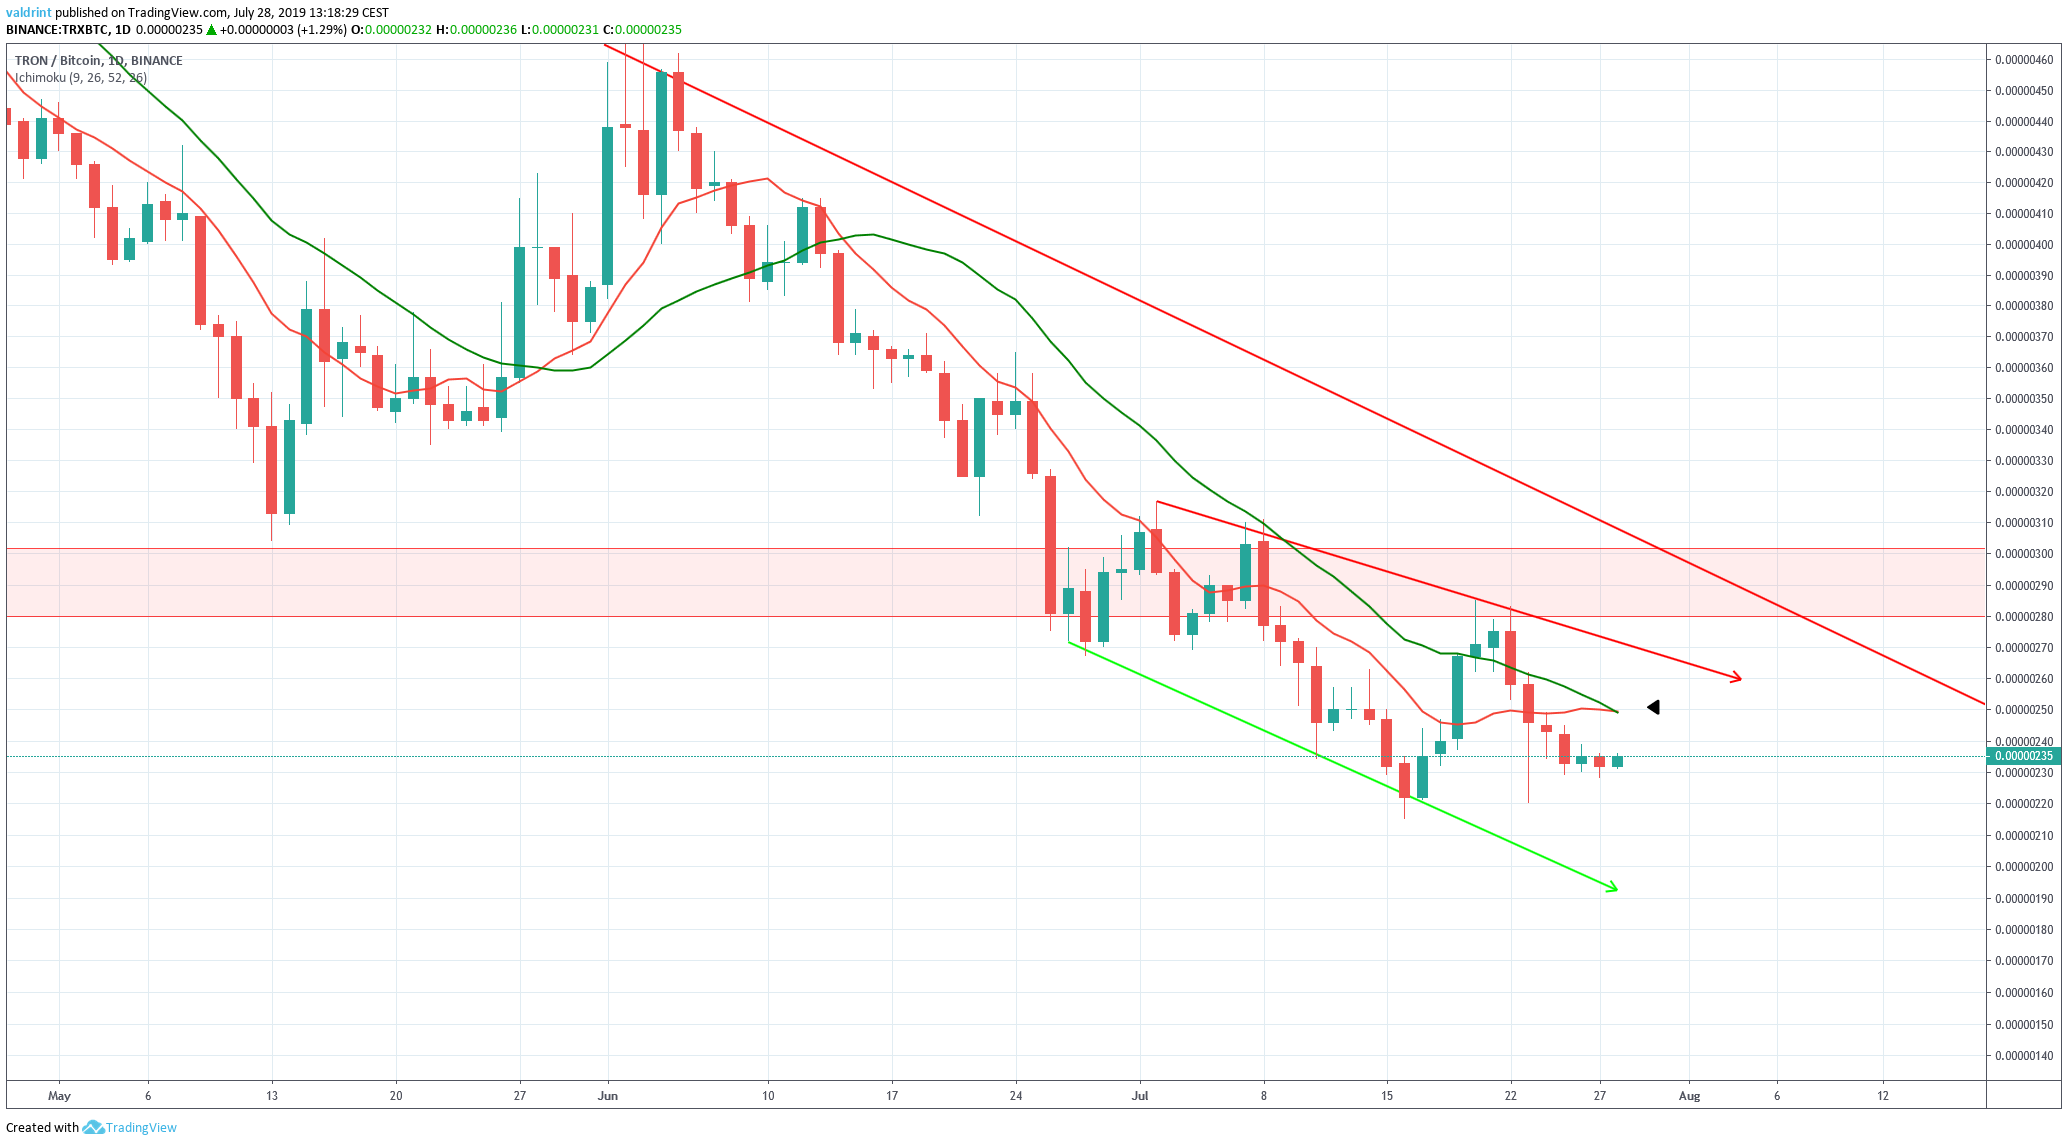 Currently, the 10- and 20-day MAs are in the process of generating a bullish cross.
However, the Tron price is still trading below both of them.
This reduces the significance of the cross and increases the likelihood that the cross will be rejected and the price will continue its downward movement.
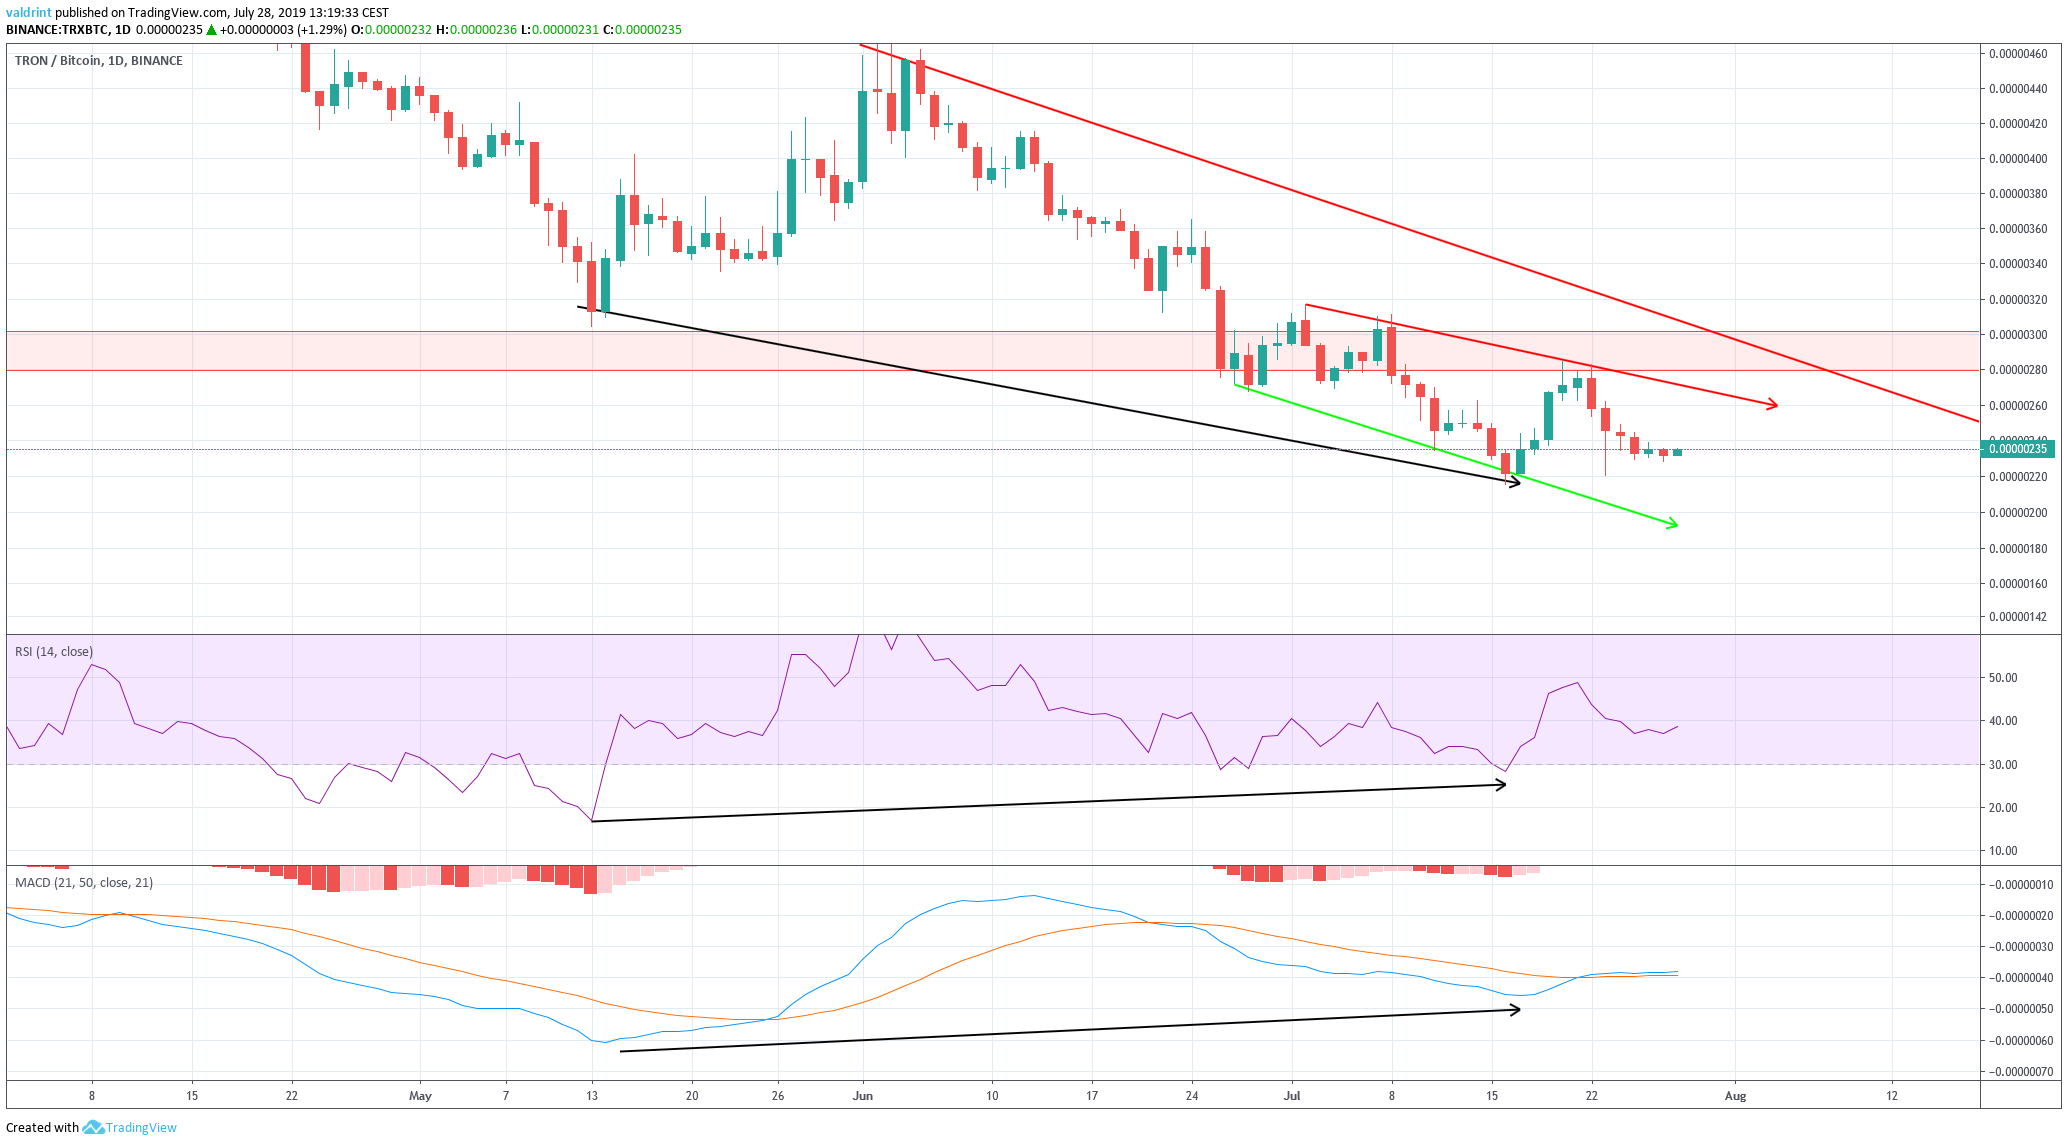
Both have been generating bullish divergence since the beginning of May.
The amount of divergence is considerable.
The fact that it is occurring inside a bullish pattern increases its significance.
The use of these indicators suggests that the TRX price will soon increase above both MAs and break out from the wedge.
A bullish cross would act as confirmation of this hypothesis.
Future Movement
In order to see where the TRX price will go in the short-term, we will look at it inside an hourly time-frame.
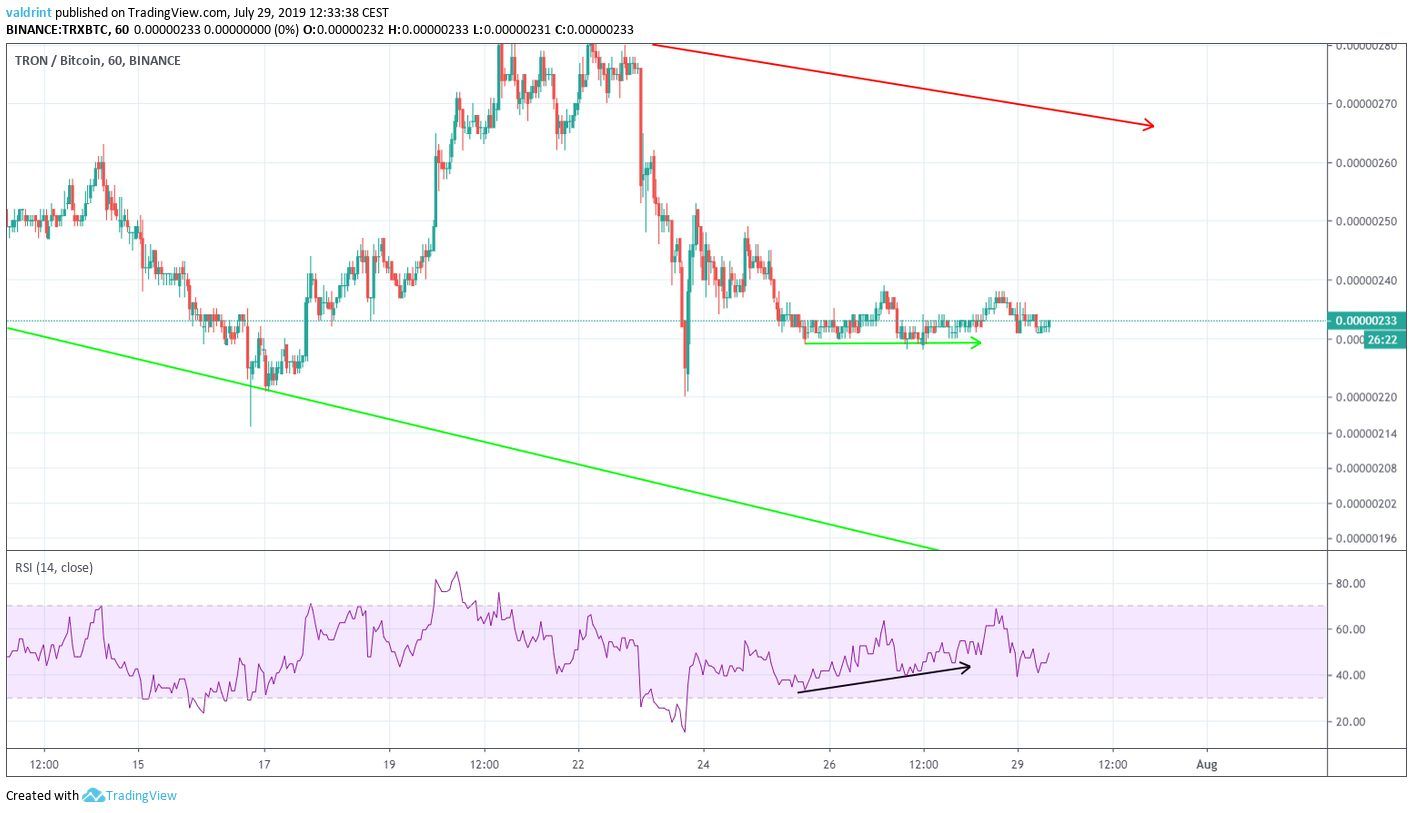
For the past three days, the Tron price has been trading around 230 satoshis.
The RSI however, has been generating higher values.
Combining this short-term divergence with our previous analysis makes it likely that the upward move will be initiated soon.
We do not believe the 230 satoshi level will be broken.
Summary
The TRX price is trading inside a short-term descending broadening wedge.
An analysis of technical indicators suggests that the price will soon begin an upward move.
However, due to the recent breakdown from a significant support area and the movement of the moving averages, we are skeptical of increases above the upper limit of the resistance area near 300 satoshis or the long-term resistance line.
Do you think TRX will begin an upward move? Let us know in the comments below.
Disclaimer: This article is not trading advice and should not be construed as such. Always consult a trained financial professional before investing in cryptocurrencies, as the market is particularly volatile.
Images are courtesy of Shutterstock, TradingView.


