
On August 4, the TRON price reached a high of 213 satoshis. A gradual decrease ensued. On August 9, it reached a low of 163 satoshis. It has been increasing since then.
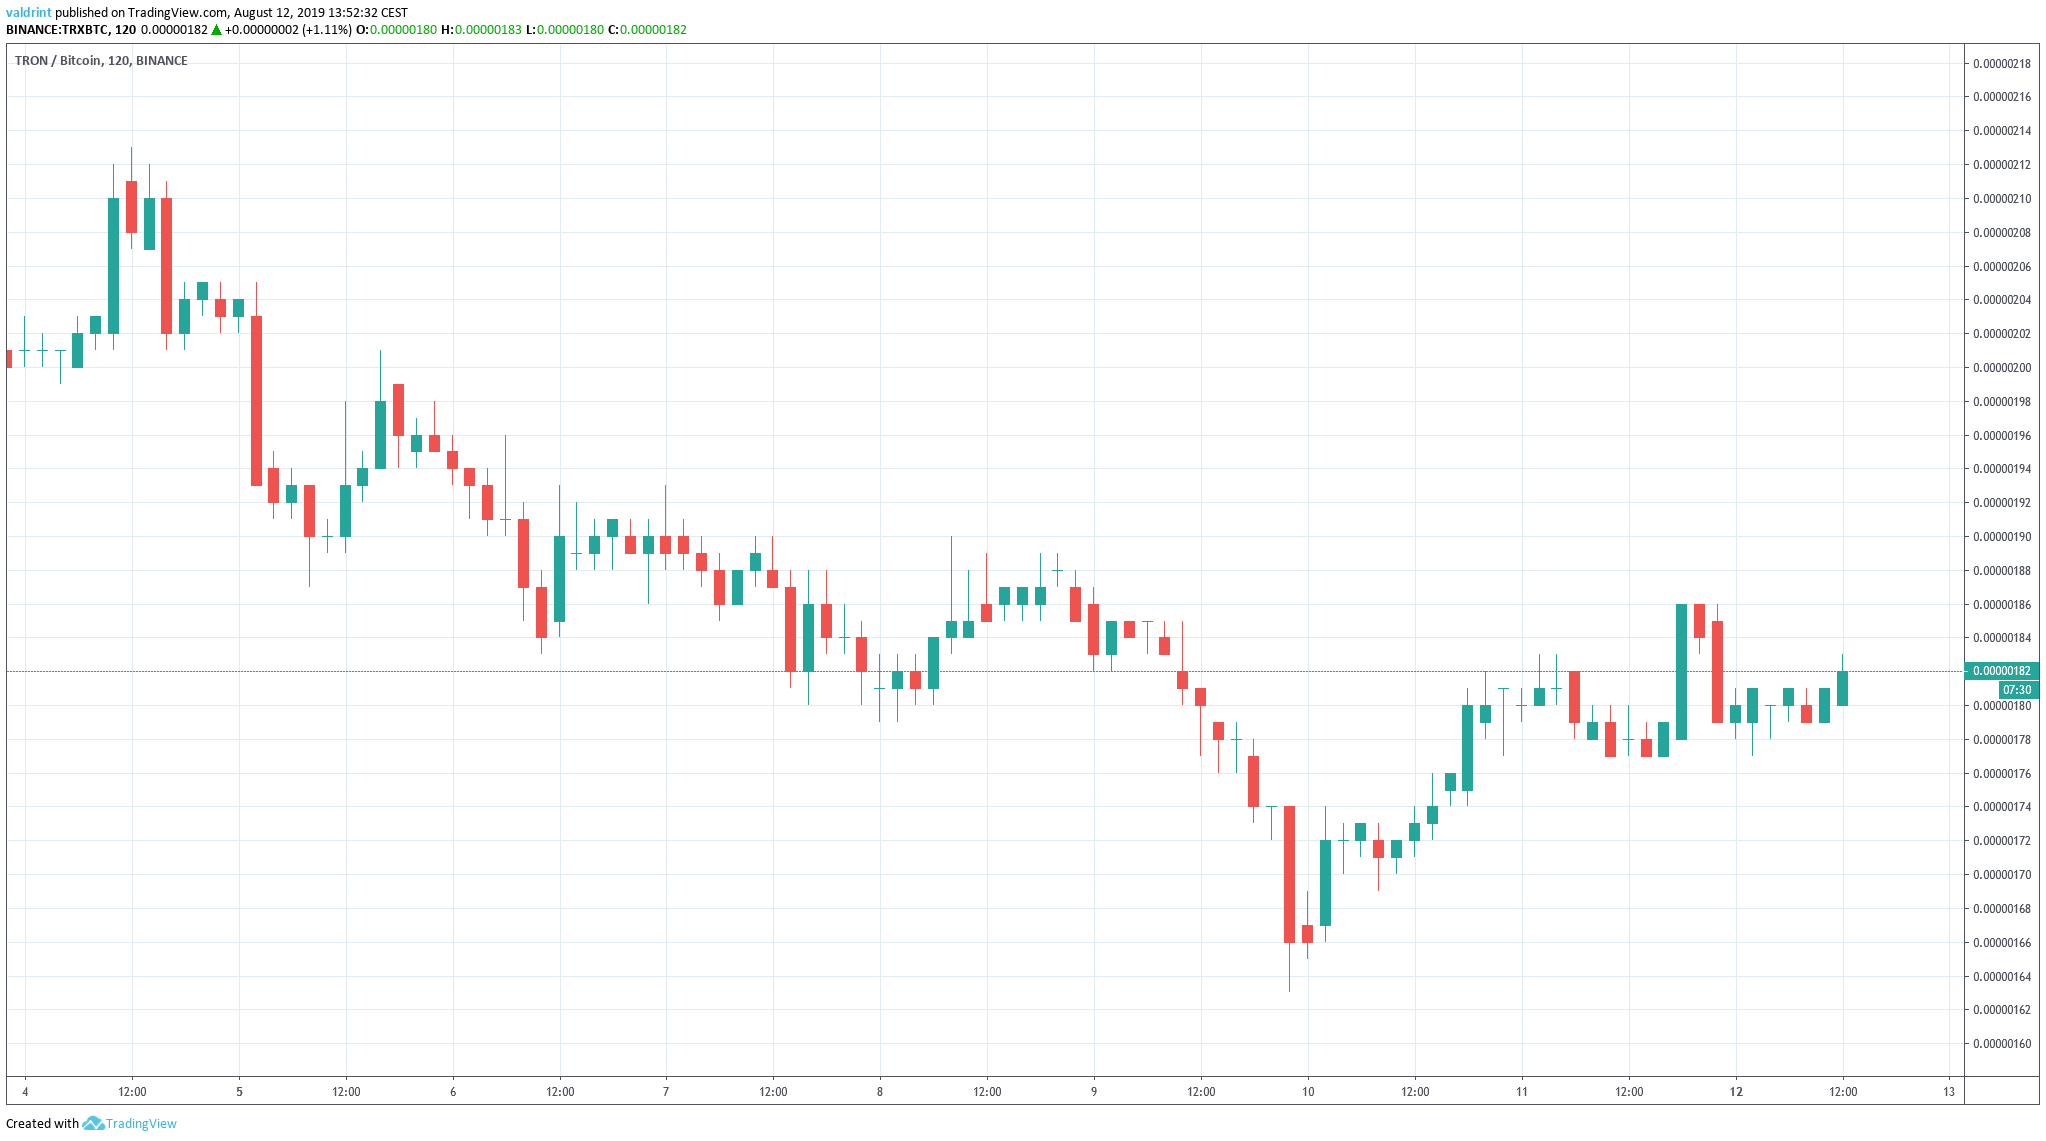
Has the TRX price made a bottom or will it decrease even further? Continue reading below if you are interested in finding out.
For our previous analysis, click here.
If you would like to trade TRON (TRX) on Binance, click here to sign up for the popular altcoin exchange!
TRON Price: Trends and Highlights for August 12
- TRX/BTC is trading inside a broadening descending wedge.
- There is support at 160 and 70 satoshis.
- There is selling pressure at 190 satoshis.
- It generated a bearish engulfing candlestick on August 9.
Current TRX Price Support
A look at the daily time-frame shows that the TRX price has just reached a minor support area and is above the other significant support area.
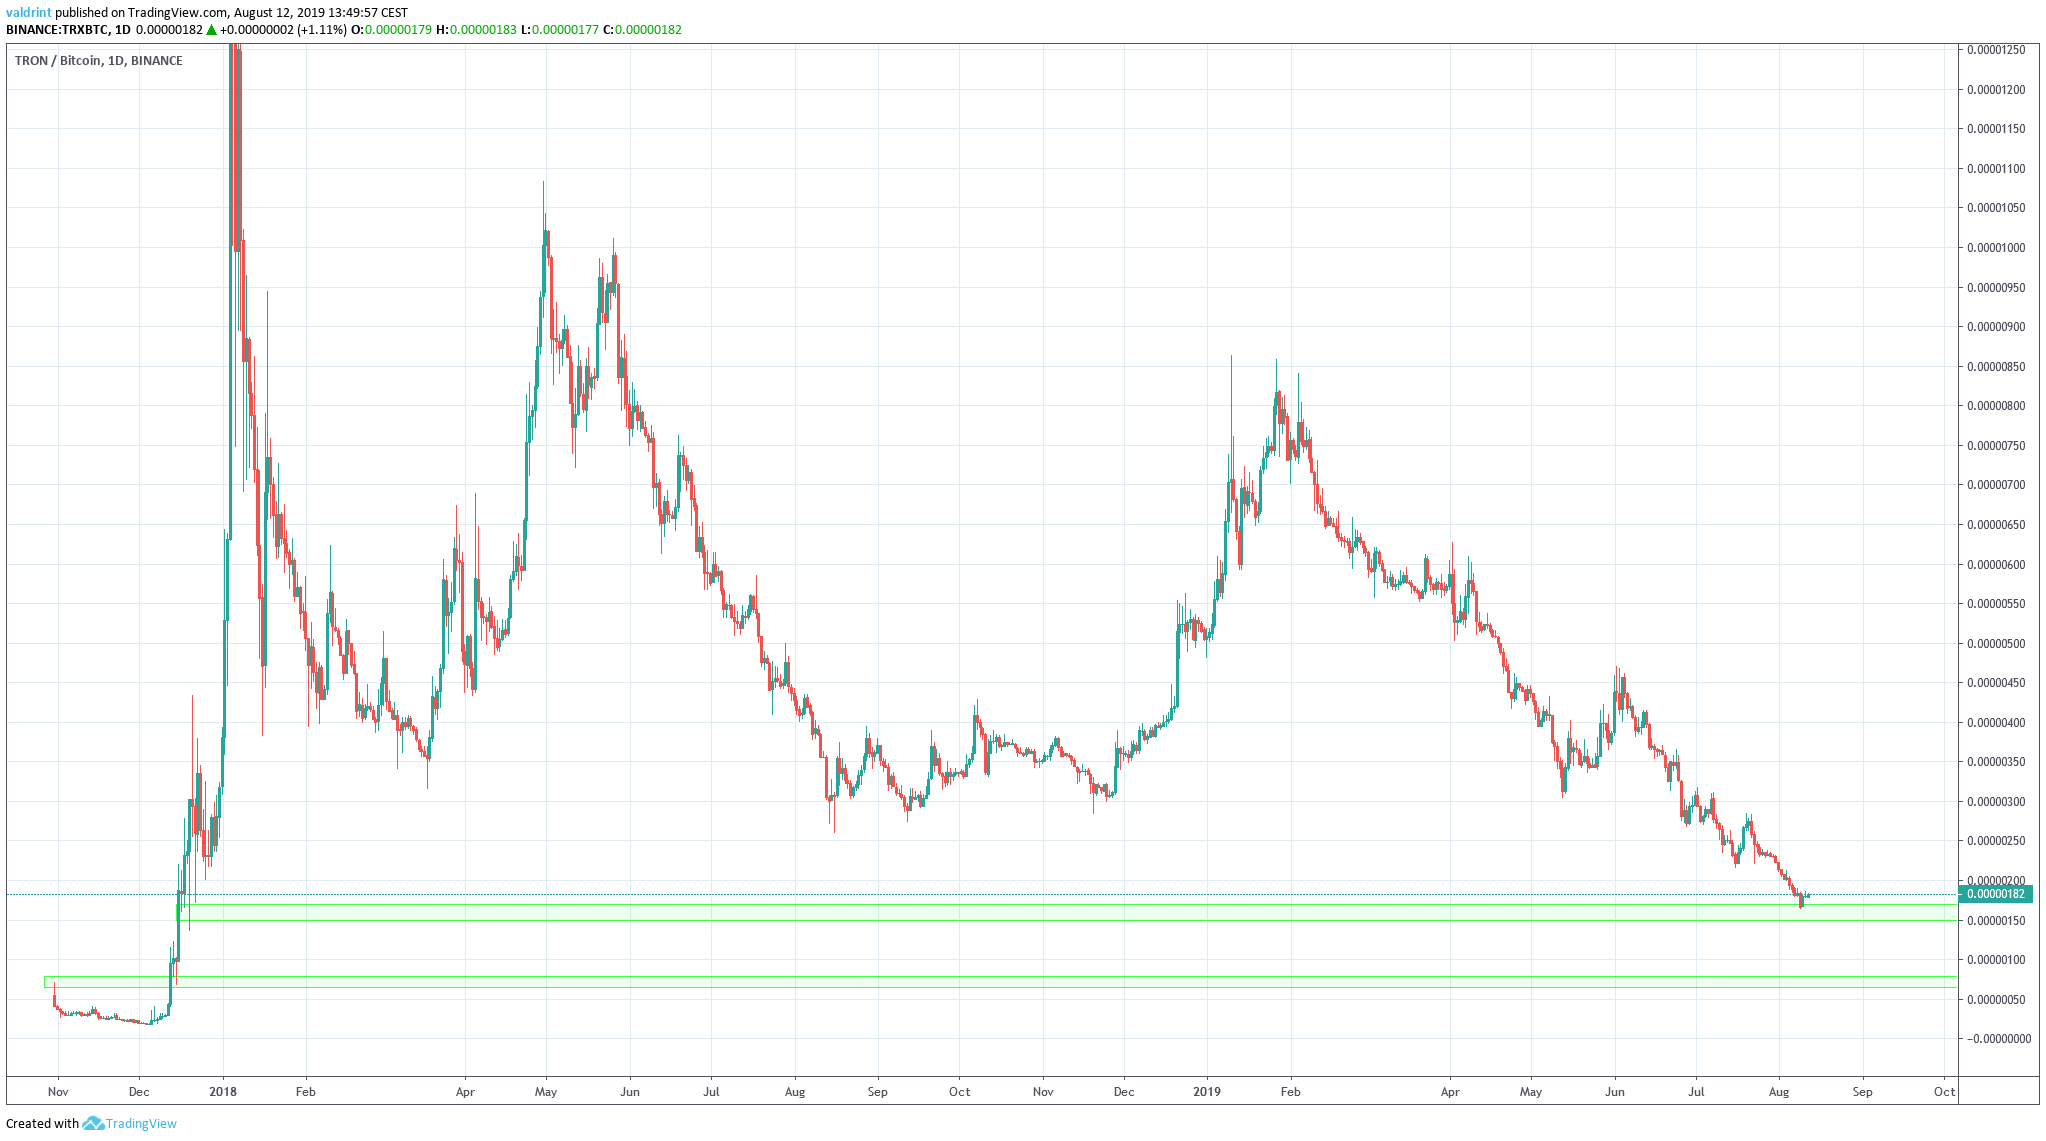
The support areas are found at 160 and 70 satoshis respectively.
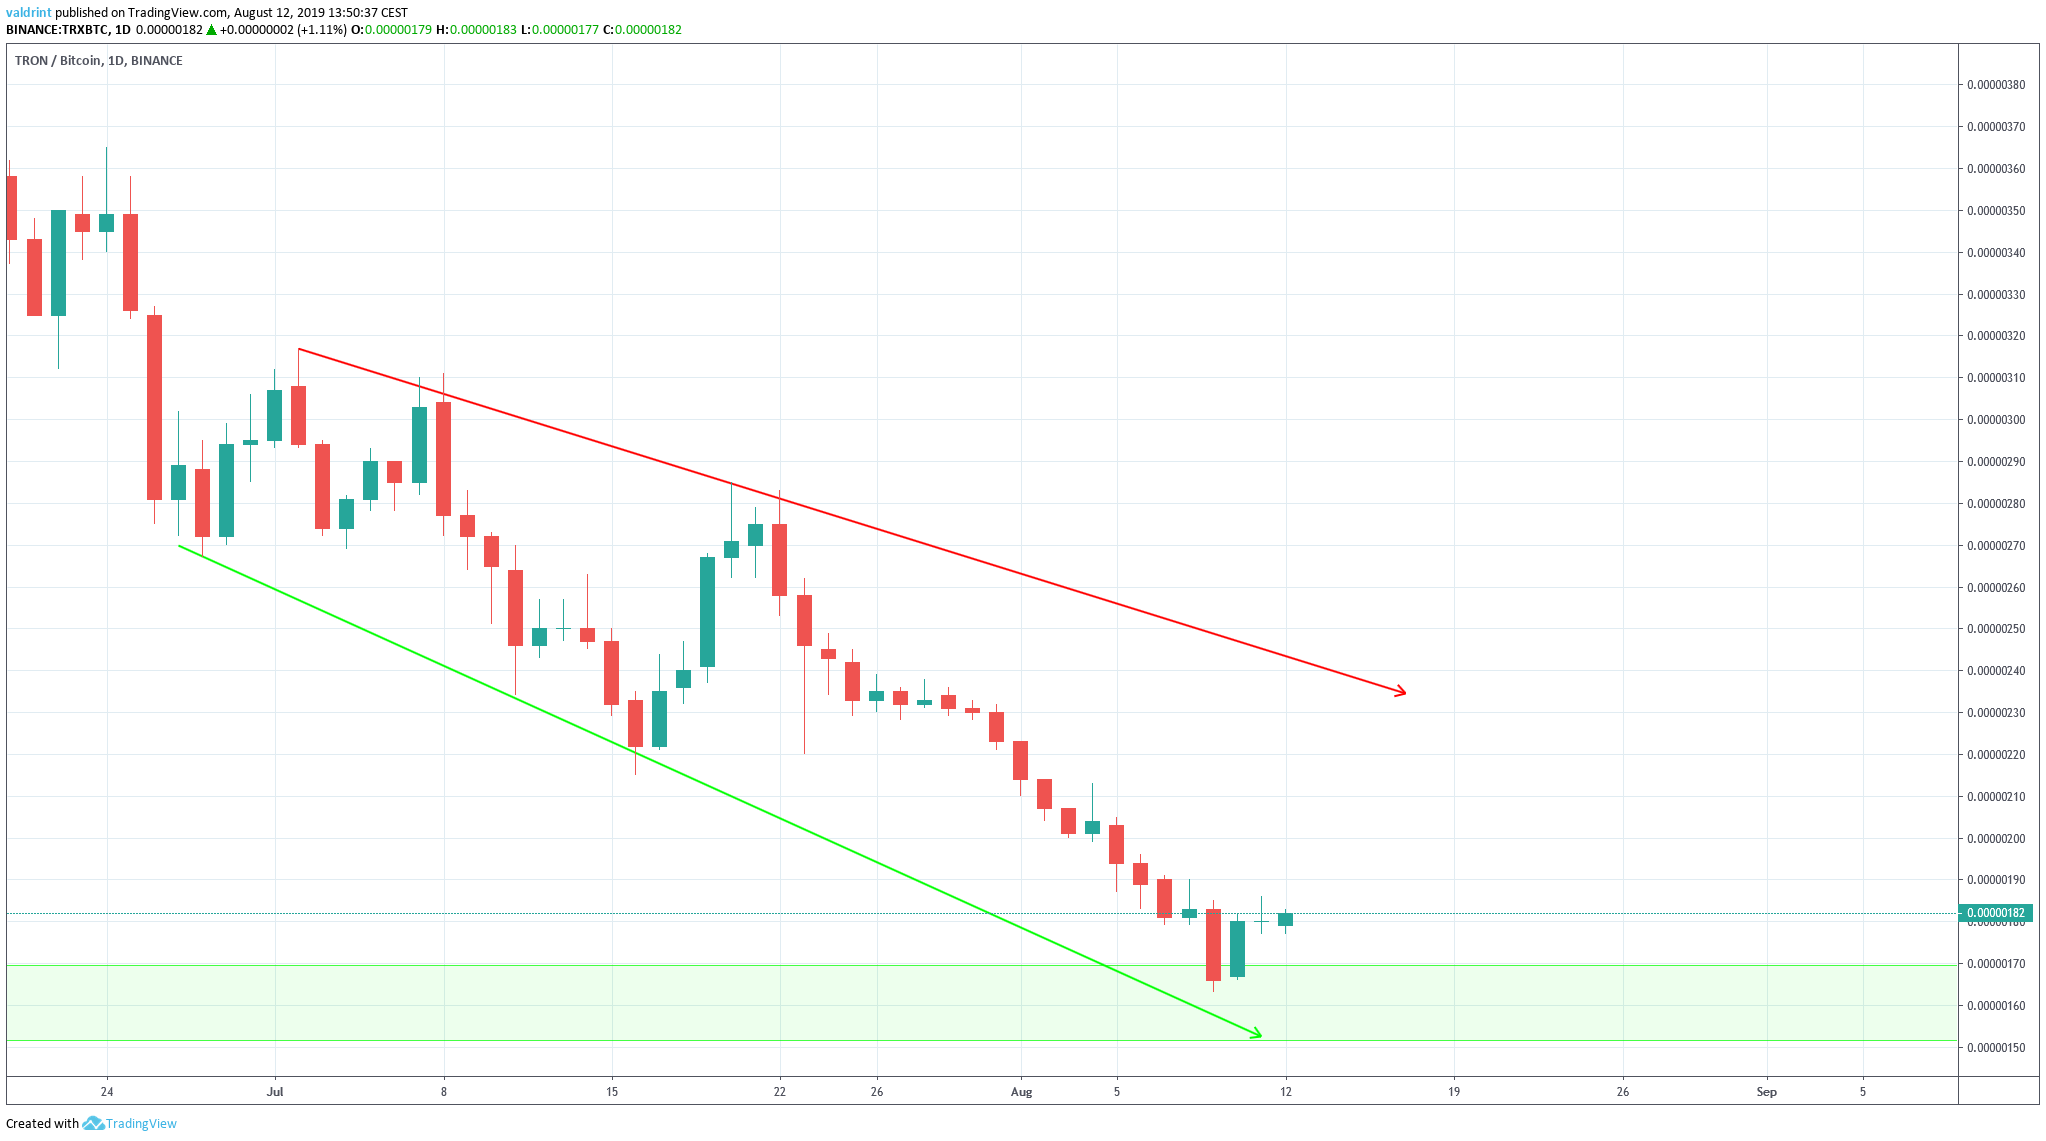
Additionally, a closer look reveals that TRX is trading inside a descending, broadening wedge. This is considered a bullish pattern, making a price breakout more likely.
Additionally, the support line of the wedge coincides with the first support area — making it a very suitable level for the initiation of a reversal.
Let’s take a look at the technical indicators and decide whether an upward movement will begin.
Downtrend
In order to analyze the strength of the underlying trend, we have incorporated moving averages (MA) into the analysis.
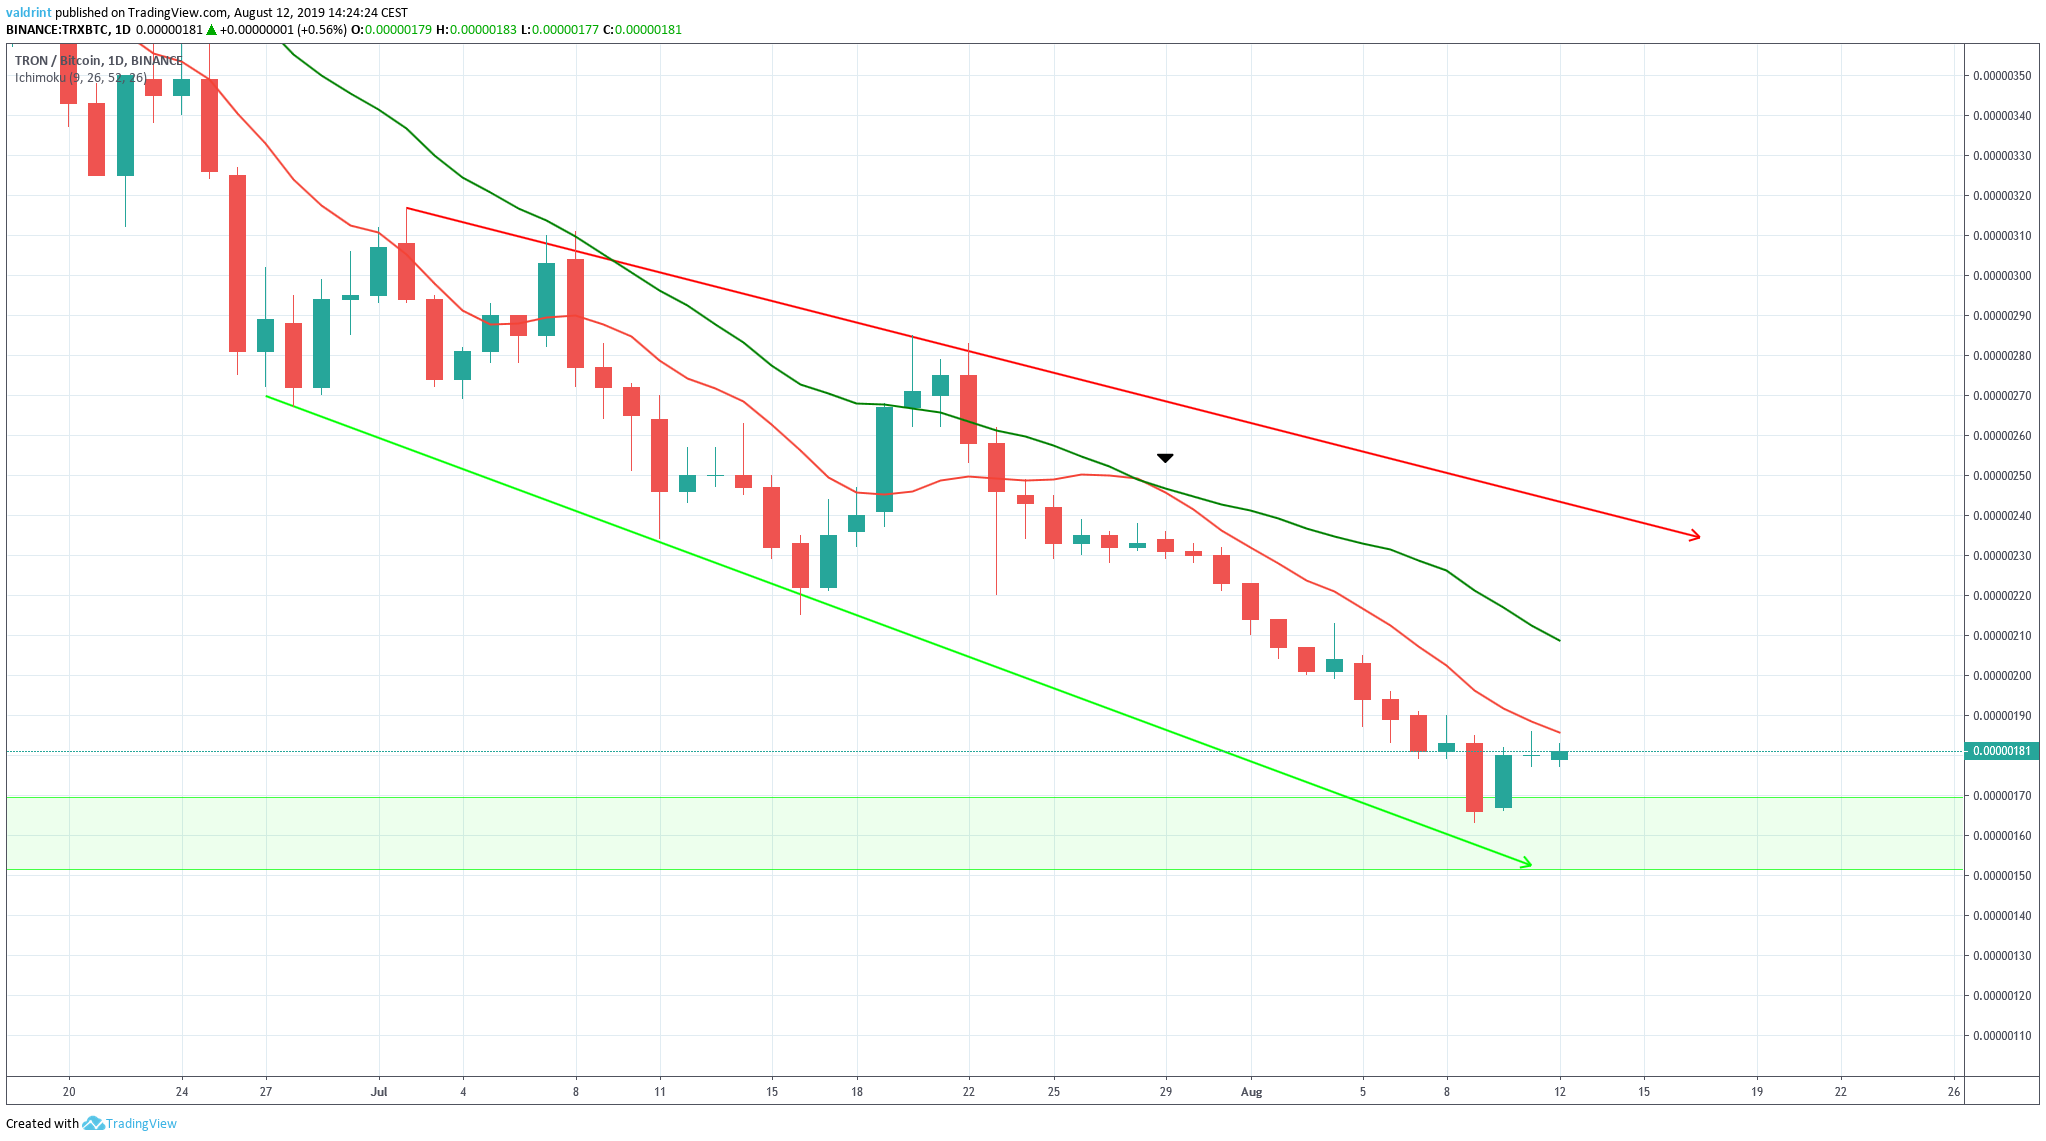
On July 28, the 10- and 20-day MAs were very close to making a bullish cross.
However, the cross was rejected, and both MAs proceeded to decrease.
The TRX price has been trading below them since, facing close resistance from the 10-day MA.
It has not yet made an attempt at breaking out.
A closer look at the daily candlesticks reveals that there is selling pressure above the current price levels.
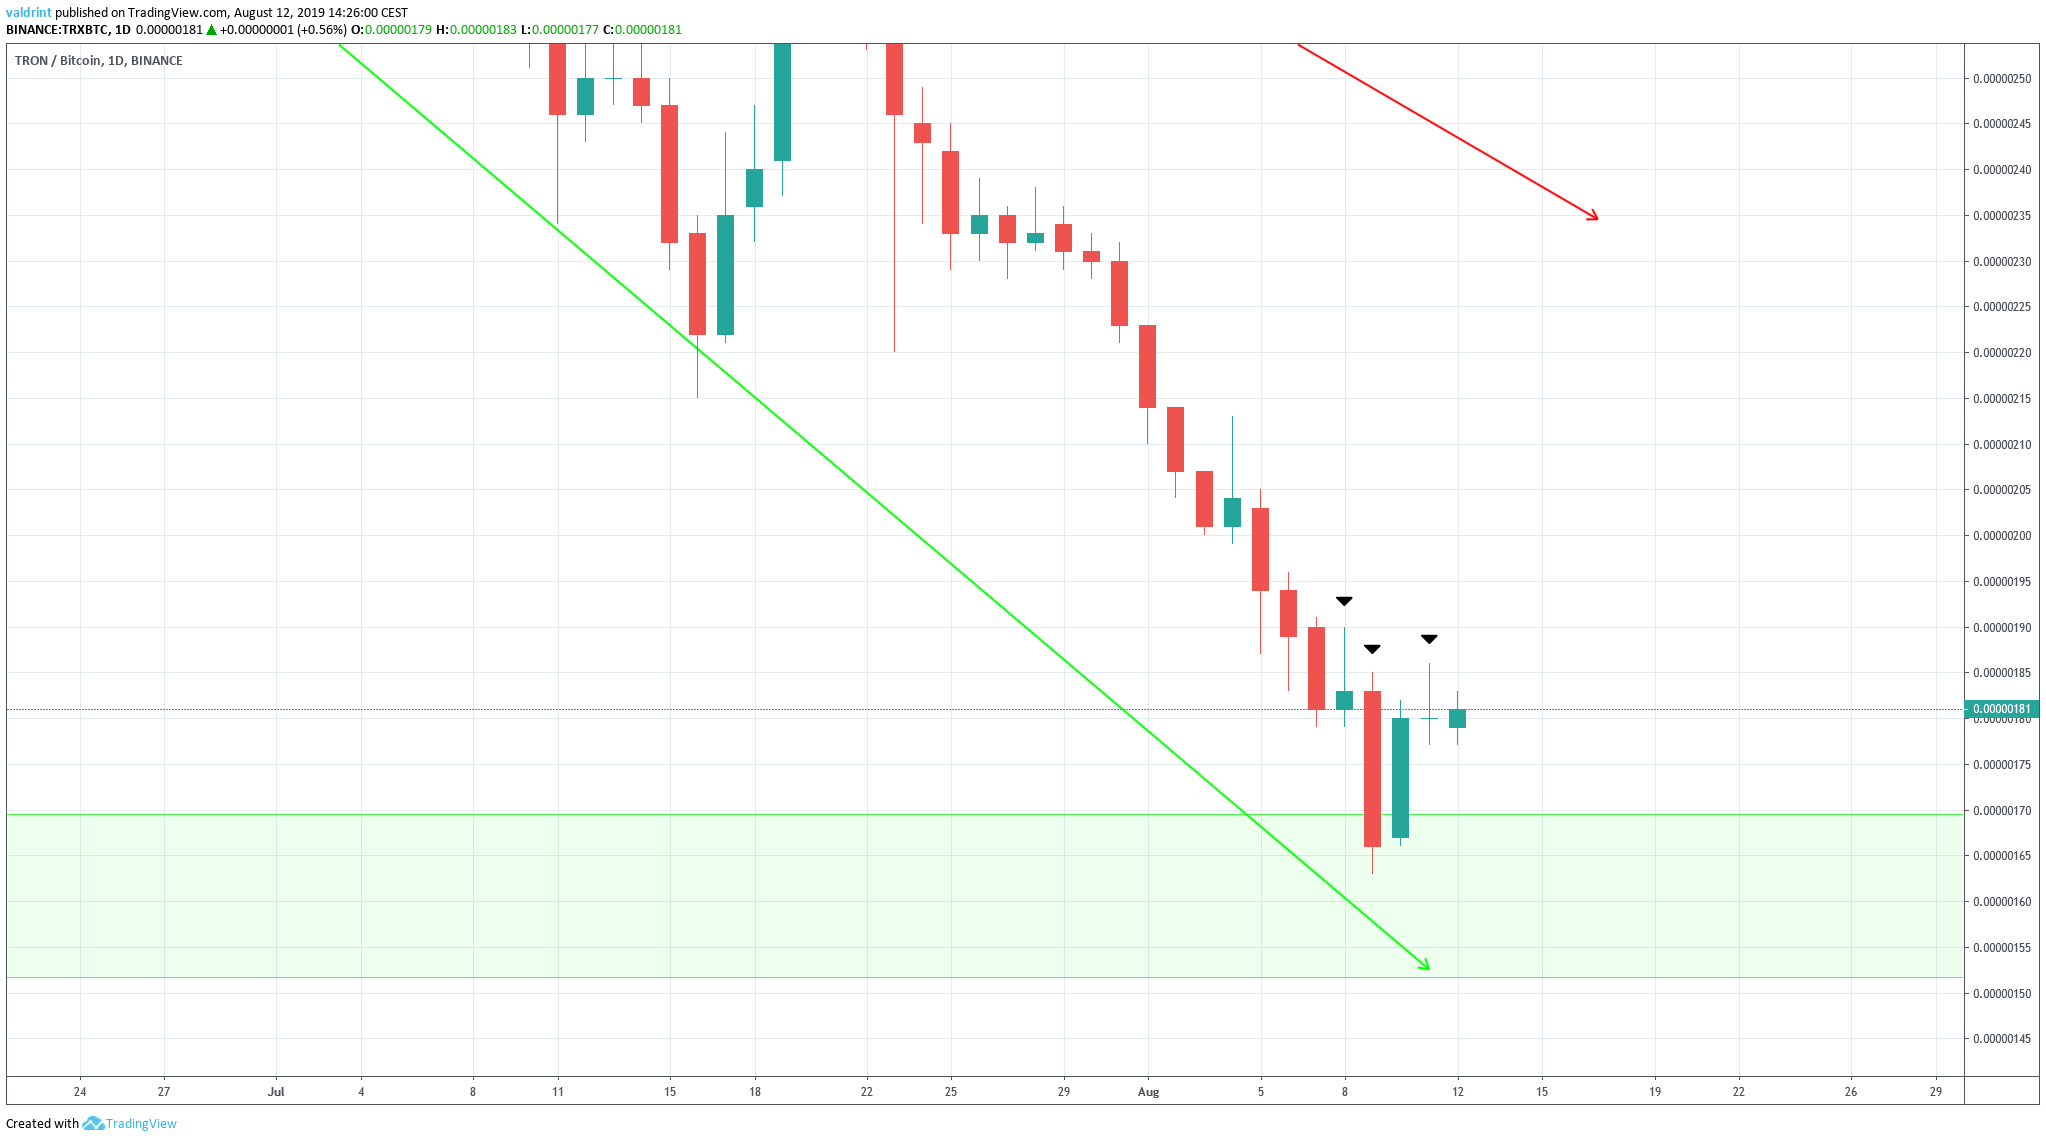
This is visible in the long upper wicks of August 8 and 11.
Additionally, on August 9, the TRX price created a bearish engulfing candle.
It has not yet reached a close above the opening level of the day.
This is a sign that the bearish pressure has yet to dissipate.
Therefore, we believe that the current attempt at initiating an upward movement will not be successful.
This view is also supported by the lack of significant bullish divergence in the RSI or MACD.
Instead, the TRX price is likely to continue trading close to the support area, possibly creating a double bottom pattern.
Afterward, it could initiate an upward move.
TRON Price Summary
The TRX price is trading inside a descending, broadening wedge.
According to our analysis, it is likely to consolidate inside the support area for a period of time.
Eventually, it should increase towards the resistance line.
Do you think the TRX price will begin an upward move? Let us know in the comments below.

Disclaimer: This article is not trading advice and should not be construed as such. Always consult a trained financial professional before investing in cryptocurrencies, as the market is particularly volatile.
Images are courtesy of Shutterstock, TradingView.
