
TRON price is defying gravity, fitting, given that Justin Sun just returned from space. While most top-20 cryptocurrencies are bleeding on the weekly, TRX is flying solo in the green, up 3.3% over the past seven days and currently trading just above $0.33.
But the bigger question now is: after making its previous all-time high organically in December 2024, can TRON price take off again, this time powered by a mix of whale activity, retail momentum, and orbital-level sentiment?
Whales Buy the Hype as BTC Pair Repeats Its Breakout Fractal
TRON’s largest wallets, those holding at least 0.1% of the supply, have gone into full accumulation mode. On July 29, inflows into these whale wallets hit 1.3 billion TRX, marking a 588% weekly jump.
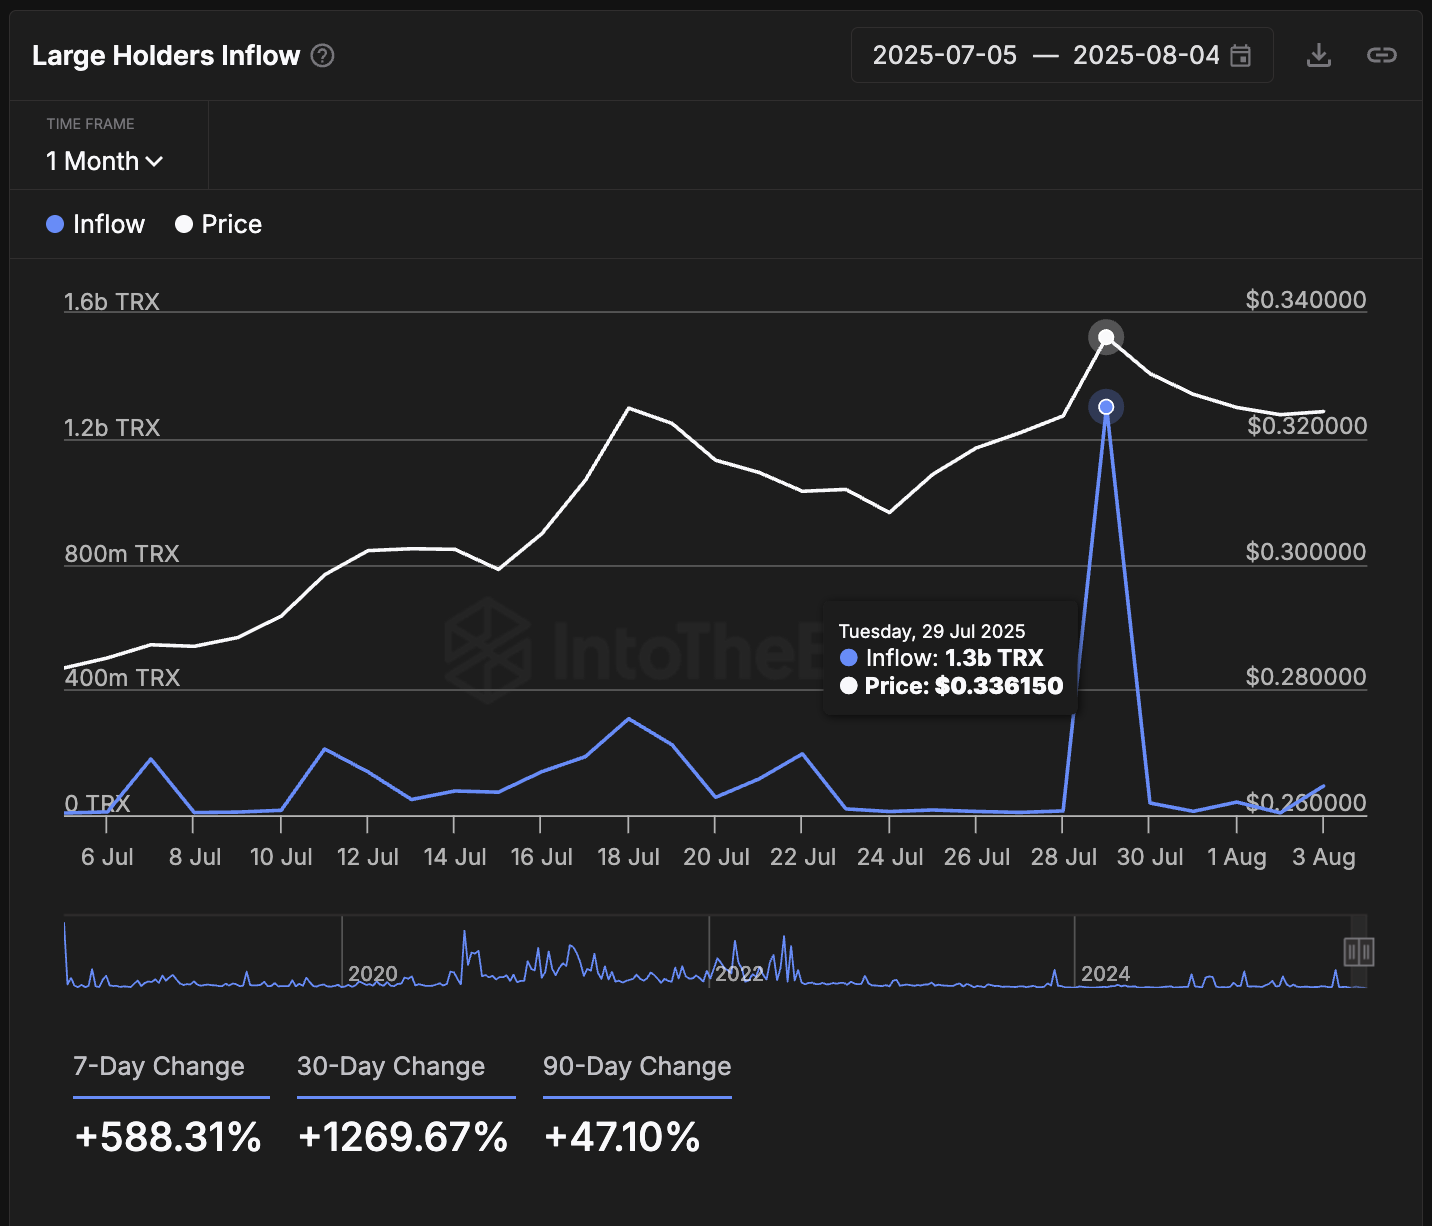
For perspective, that’s even higher than the 10.3 billion TRX inflow spike recorded just before TRX’s last ATH in December 2024. This time, however, the surge aligns not with macro conditions, but with the buzz surrounding Justin Sun’s Blue Origin spaceflight.
Note: This metric shows how much TRX is being moved into whale wallets; unlike exchange inflows, this usually signals accumulation, not selling.
The market appears to be buying the narrative: TRON’s BTC pair is now coiling within an ascending triangle, nearly identical to the pattern it printed before last year’s breakout.
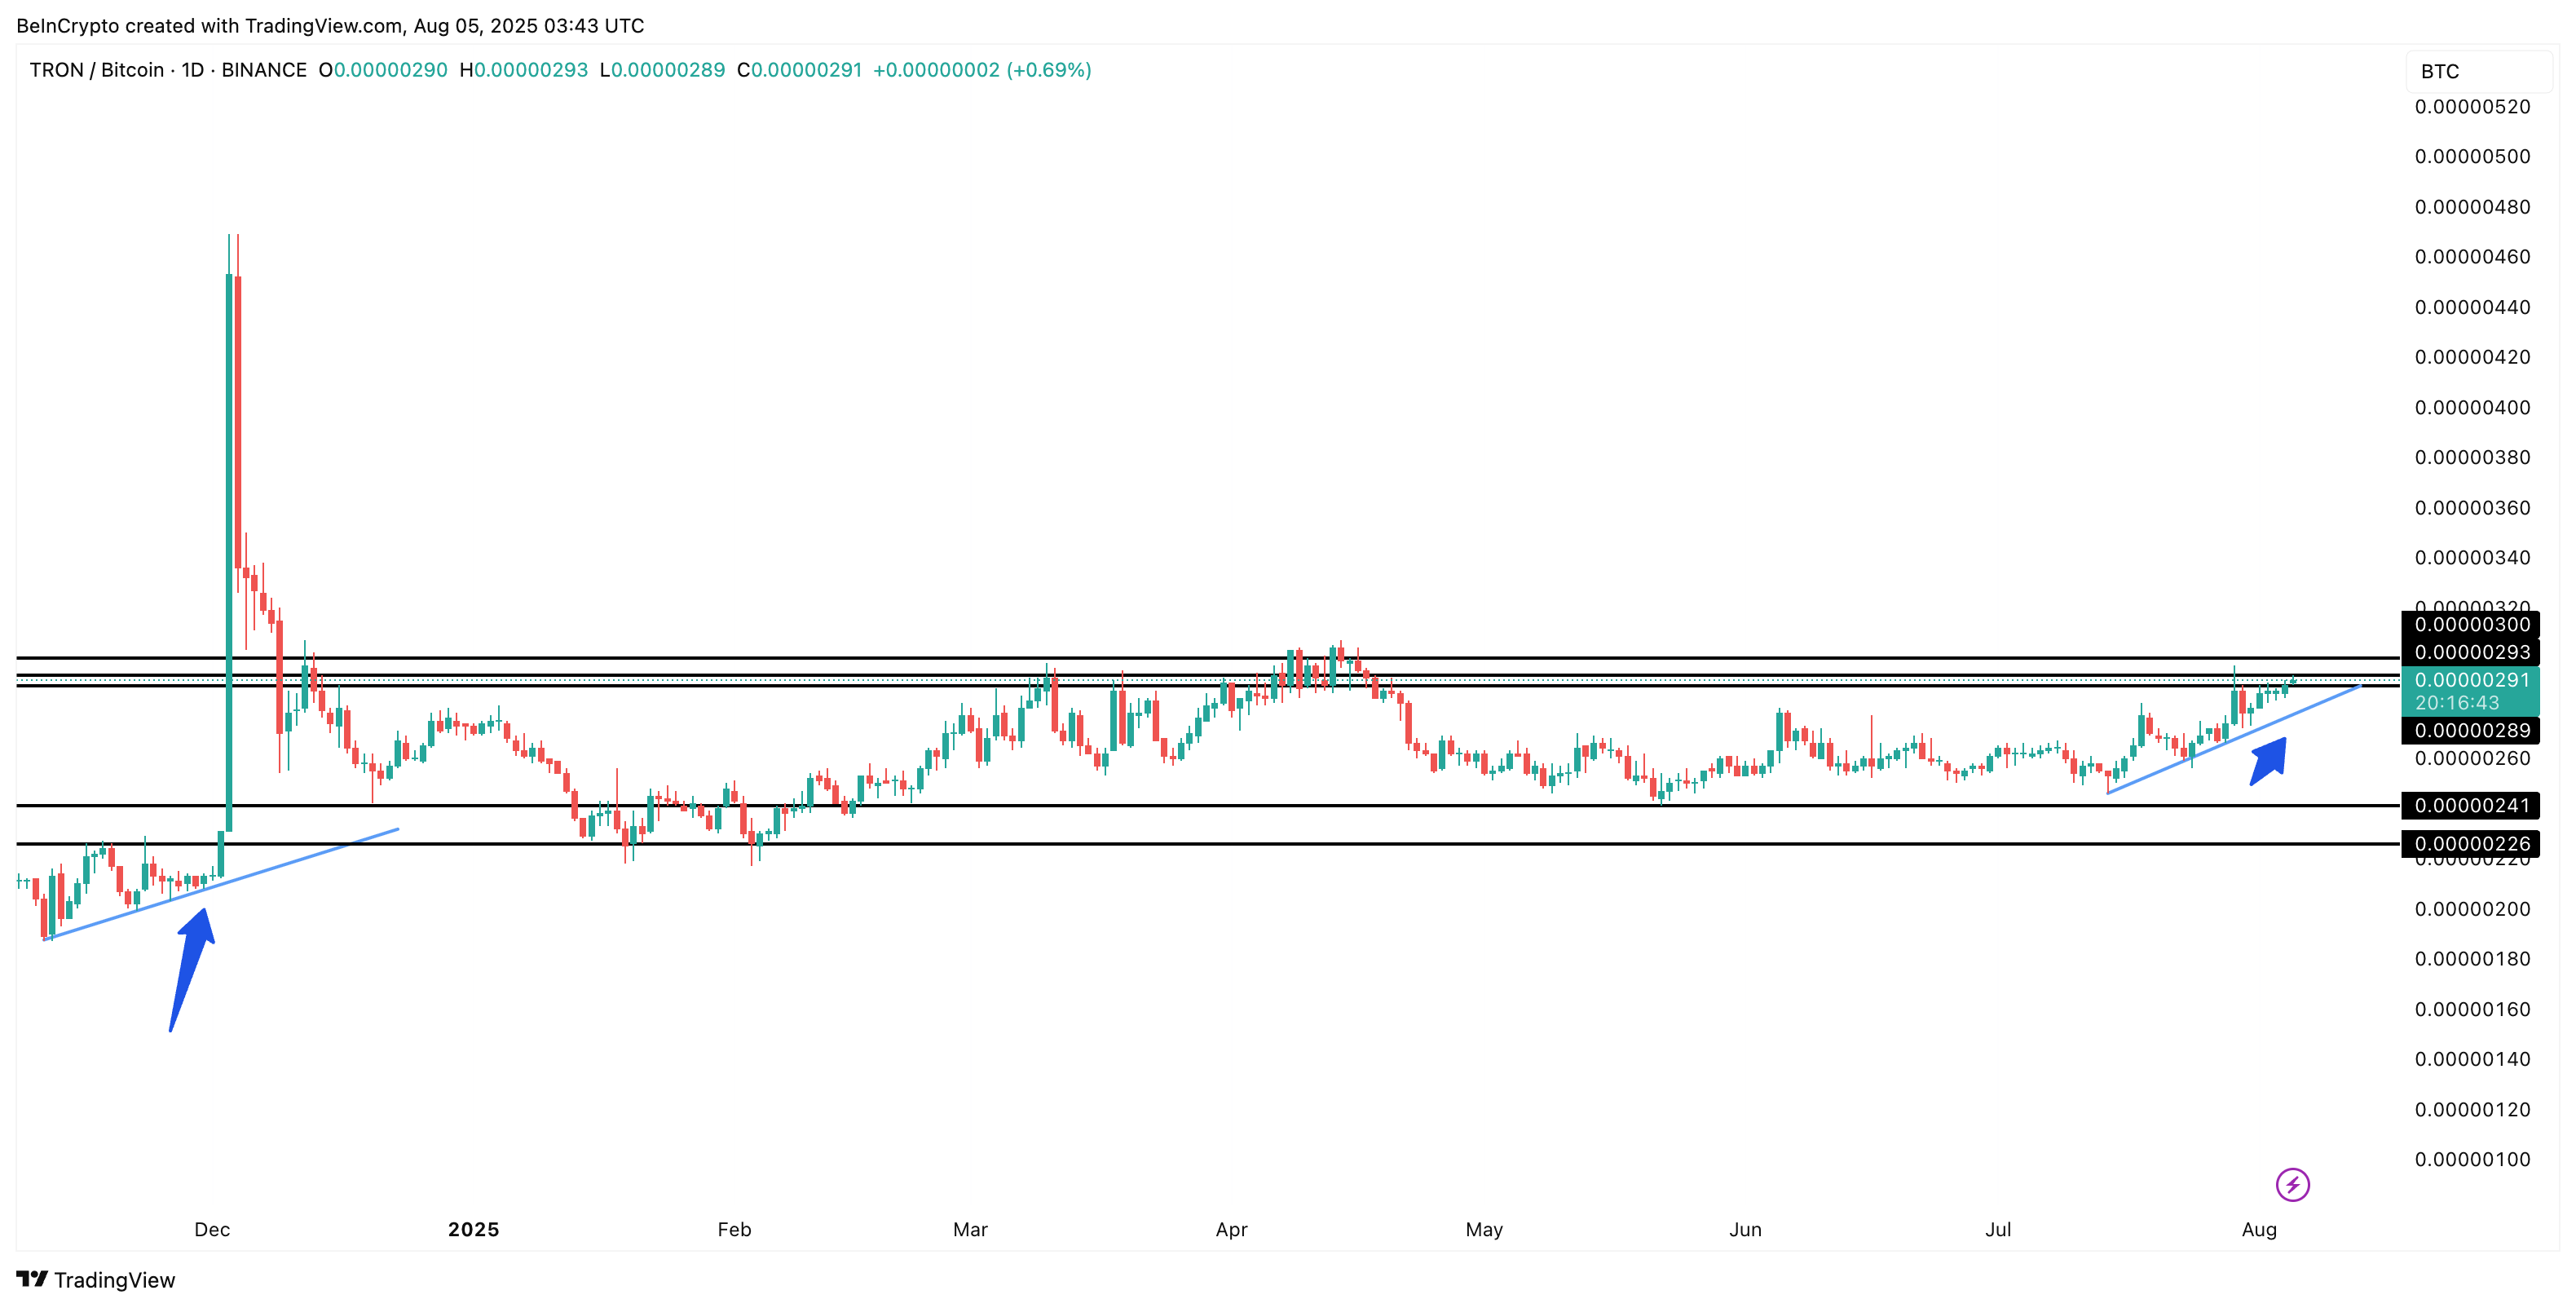
With the TRX/BTC now approaching 0.00000293 BTC, a breakout could trigger a spillover rally into TRX/USDT markets.
The TRX/BTC chart compares TRON’s performance to Bitcoin; when it trends up, it means TRX is gaining strength even against the market leader.
For token TA and market updates: Want more token insights like this? Sign up for Editor Harsh Notariya’s Daily Crypto Newsletter here.
Momentum Lags, But Traders Are Still Betting Long
Despite the whale optimism, momentum remains subdued. The Money Flow Index (MFI), currently at 52, is printing lower highs; a stark contrast to the back-to-back higher highs above 80 that fueled TRON price’s 2024 rally. This shows that while big wallets are preparing for lift-off, broader liquidity hasn’t yet caught up, yet.
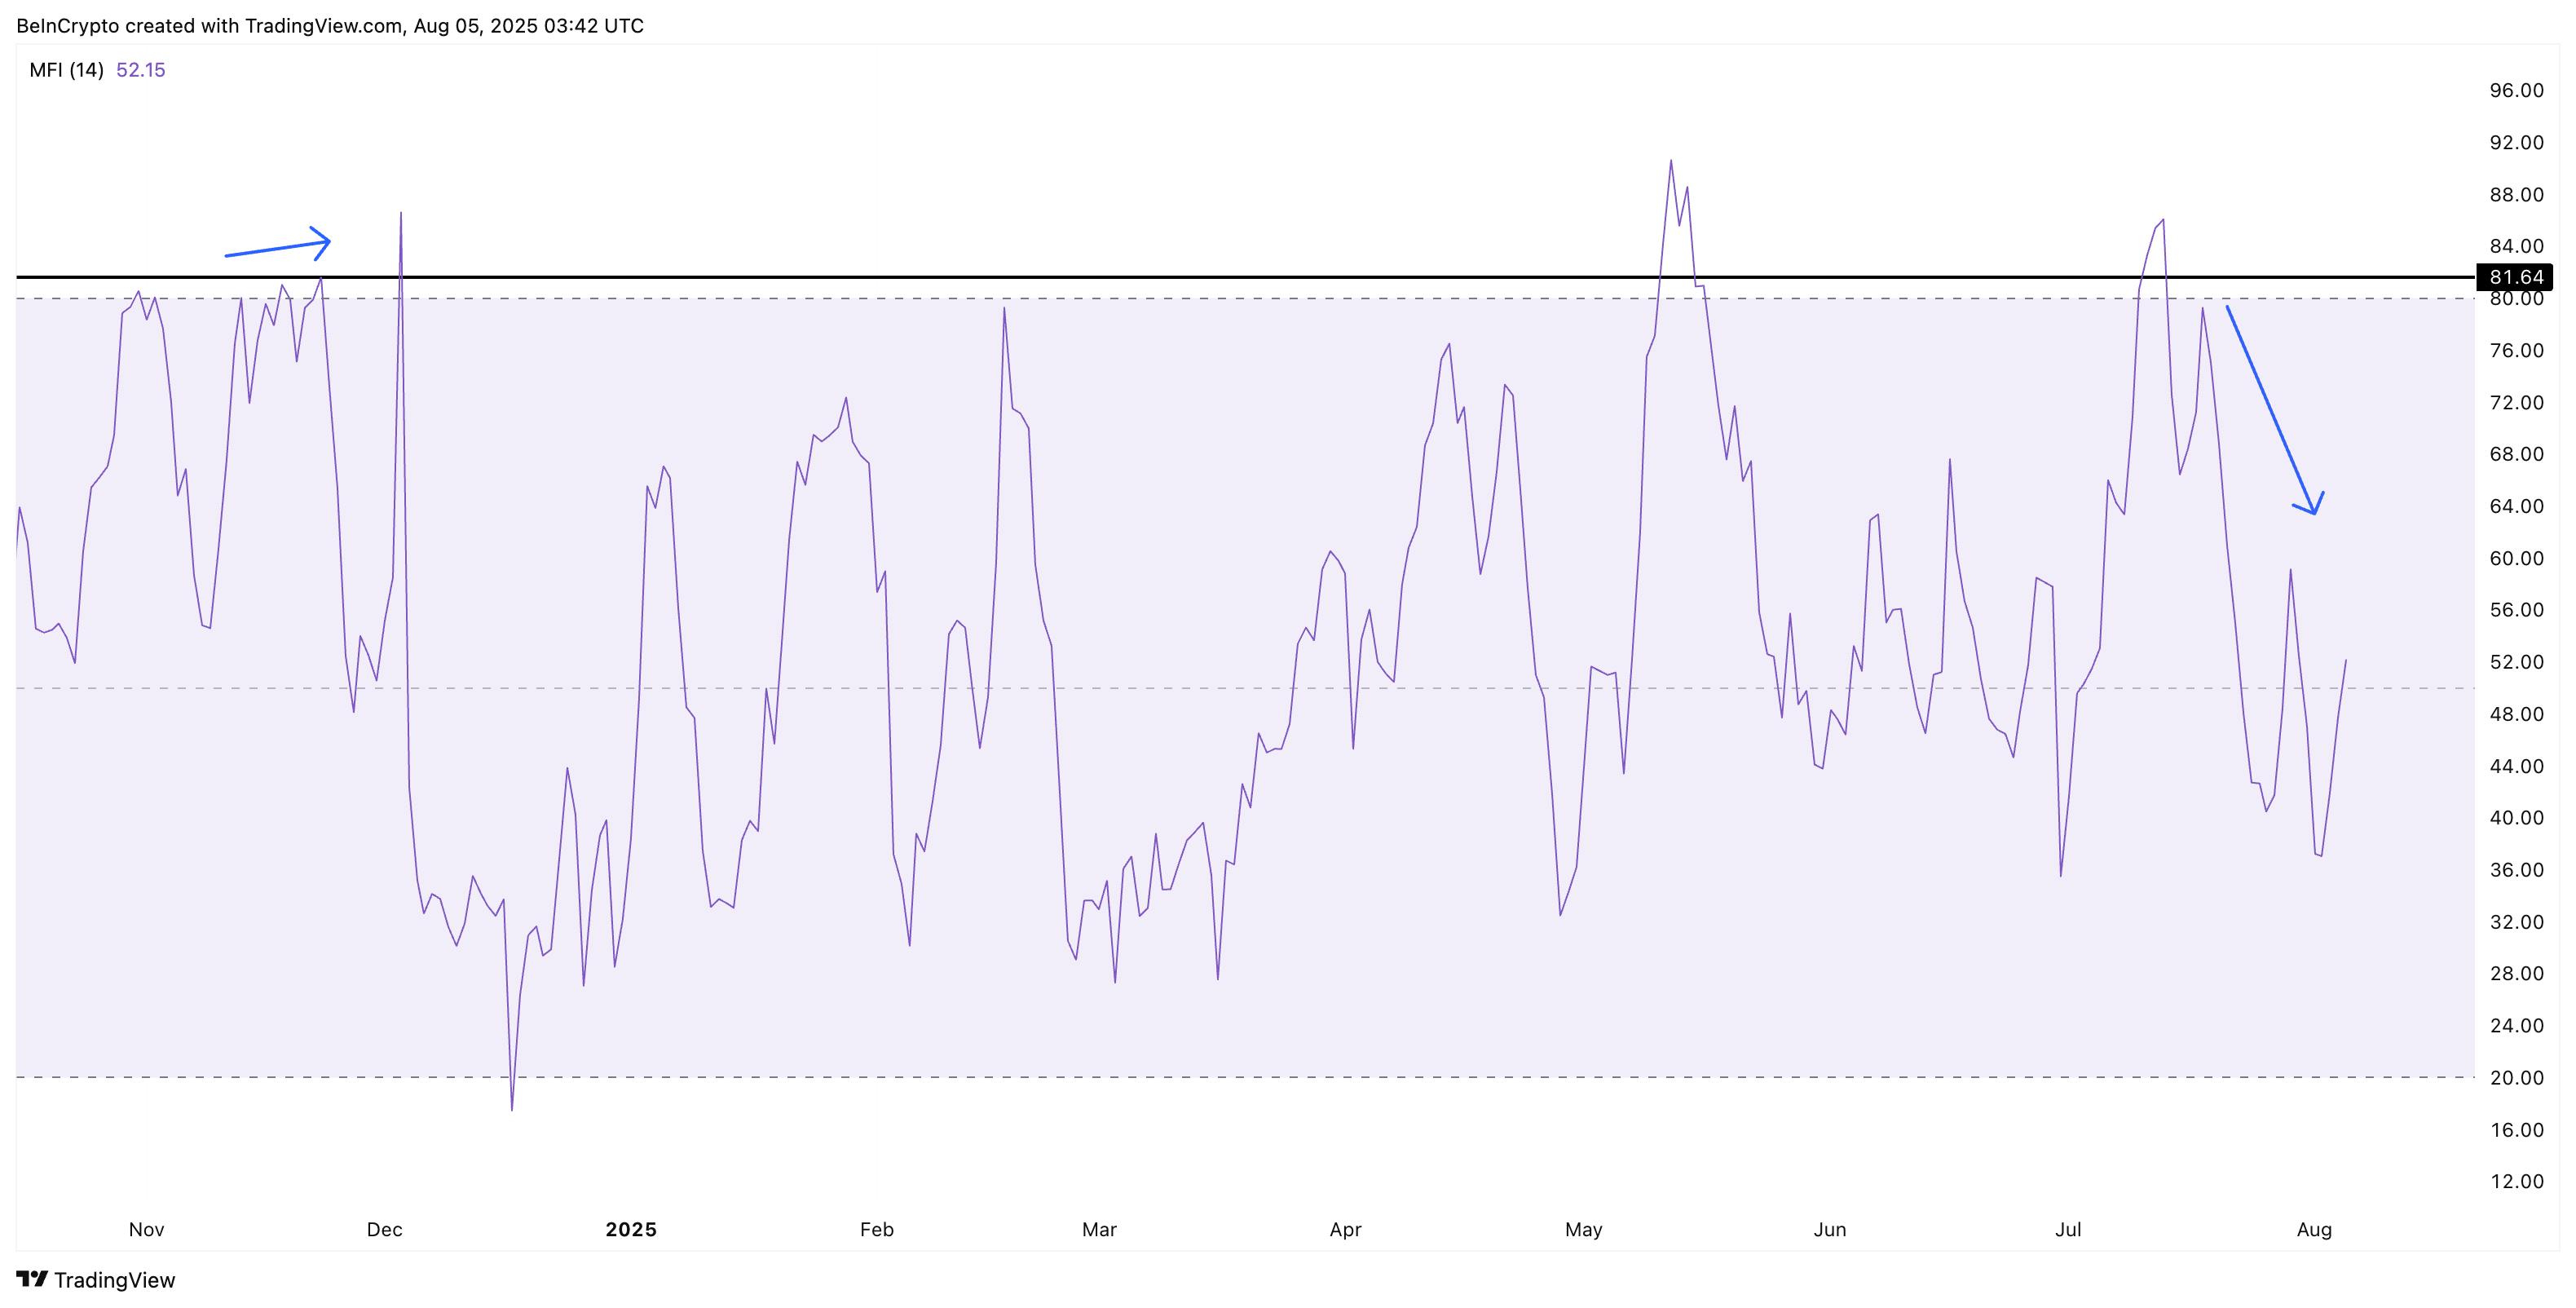
And that could be a key reason why the TRON (TRX) price might take some time to reach a new all-time high, despite the positive whale activity.
The Money Flow Index shows whether money is flowing into or out of TRX, combining price and volume to spot buying or selling pressure.
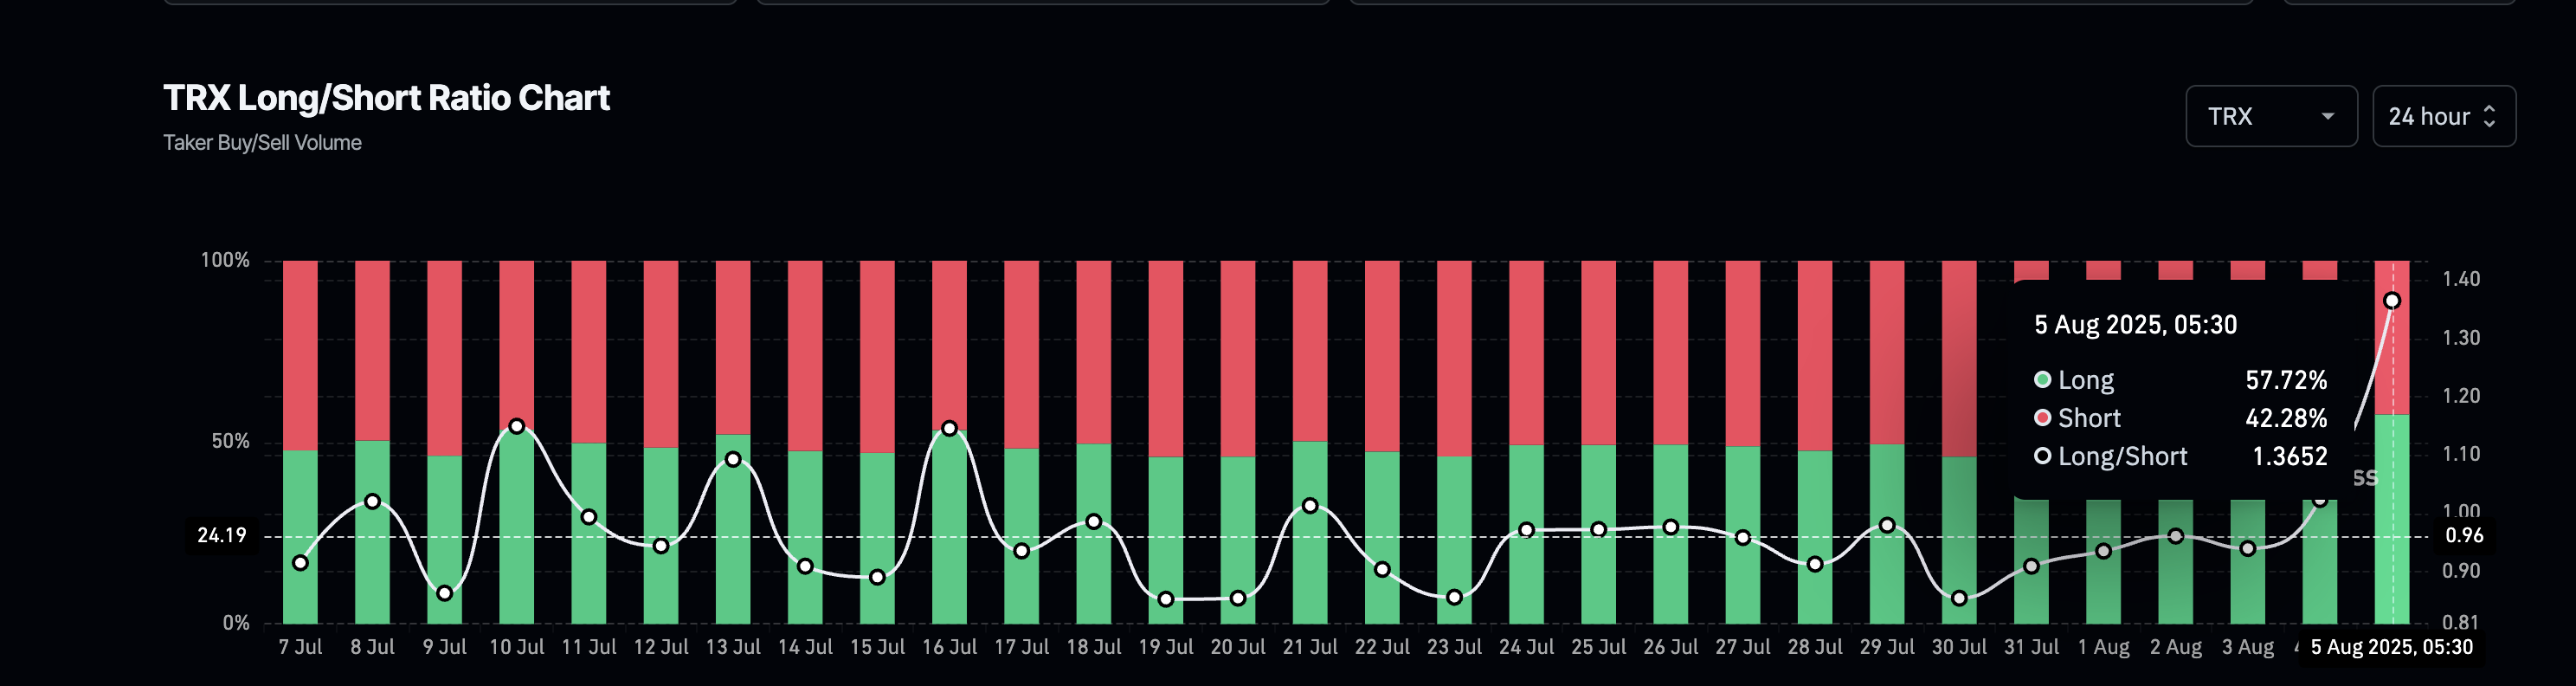
Still, TRON’s long/short ratio suggests retail traders are positioning for upside. As of August 5, the long/short ratio has risen to 1.36, with nearly 58% of all open trades favoring longs. This indicates growing speculative demand; if momentum catches up, it could amplify any bullish breakout. The long bias could be a trigger for the MFI to go higher.
This ratio compares how many traders are betting on a price rise (long) versus a fall (short), helping gauge overall market sentiment.
In short, traders are buckling up early. Now they just need the fuel.
TRON Price Needs One Final Push Past This Key Level
TRON price action on the weekly chart looks poised but not yet launched. After breaking past $0.31, TRX is now consolidating near $0.33, close to the key resistance-turned support level of $0.32.
The key breakout level remains $0.34. If bulls manage a weekly close above that, the path toward $0.40 becomes clearer, with a full extension target sitting at $0.48, which would mark a new all-time high.
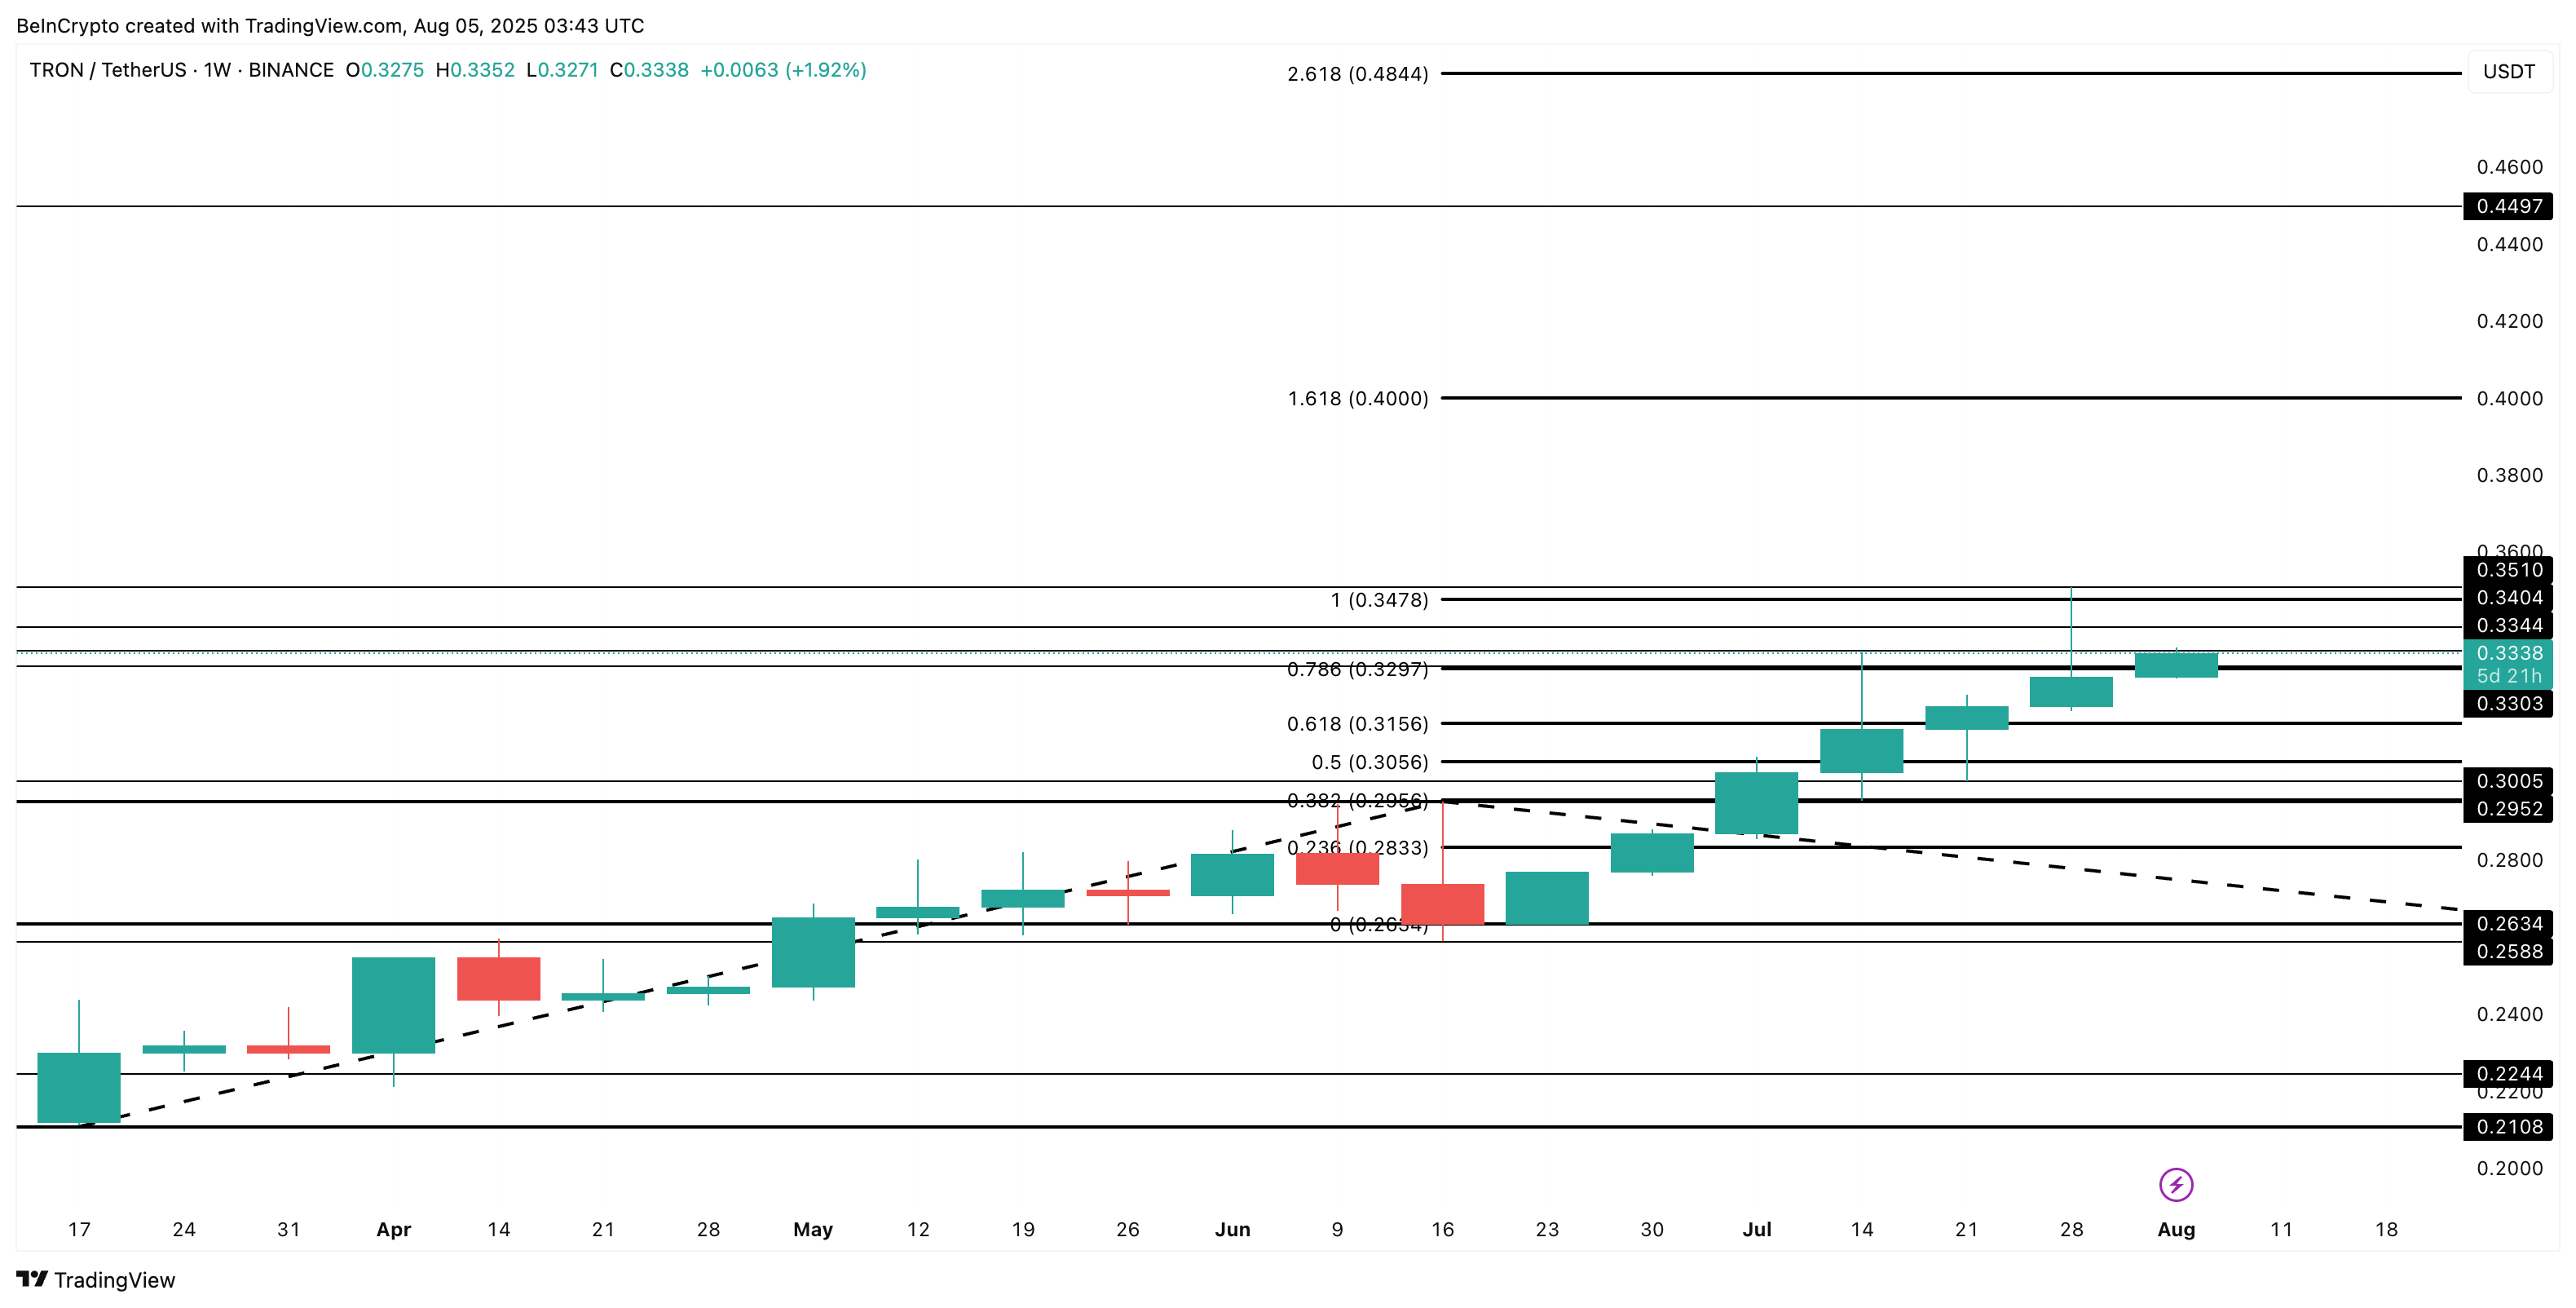
However, the bullish hypothesis gets invalidated if the TRON price breaks key support levels at $.30. A weekly calendar close below $0.29 can turn the broader structure slightly bearish in the short-to-mid-term.
