

Total Market Cap (TOTALCAP) has broken out from a short-term descending resistance line and is gradually increasing towards a longer-term one.
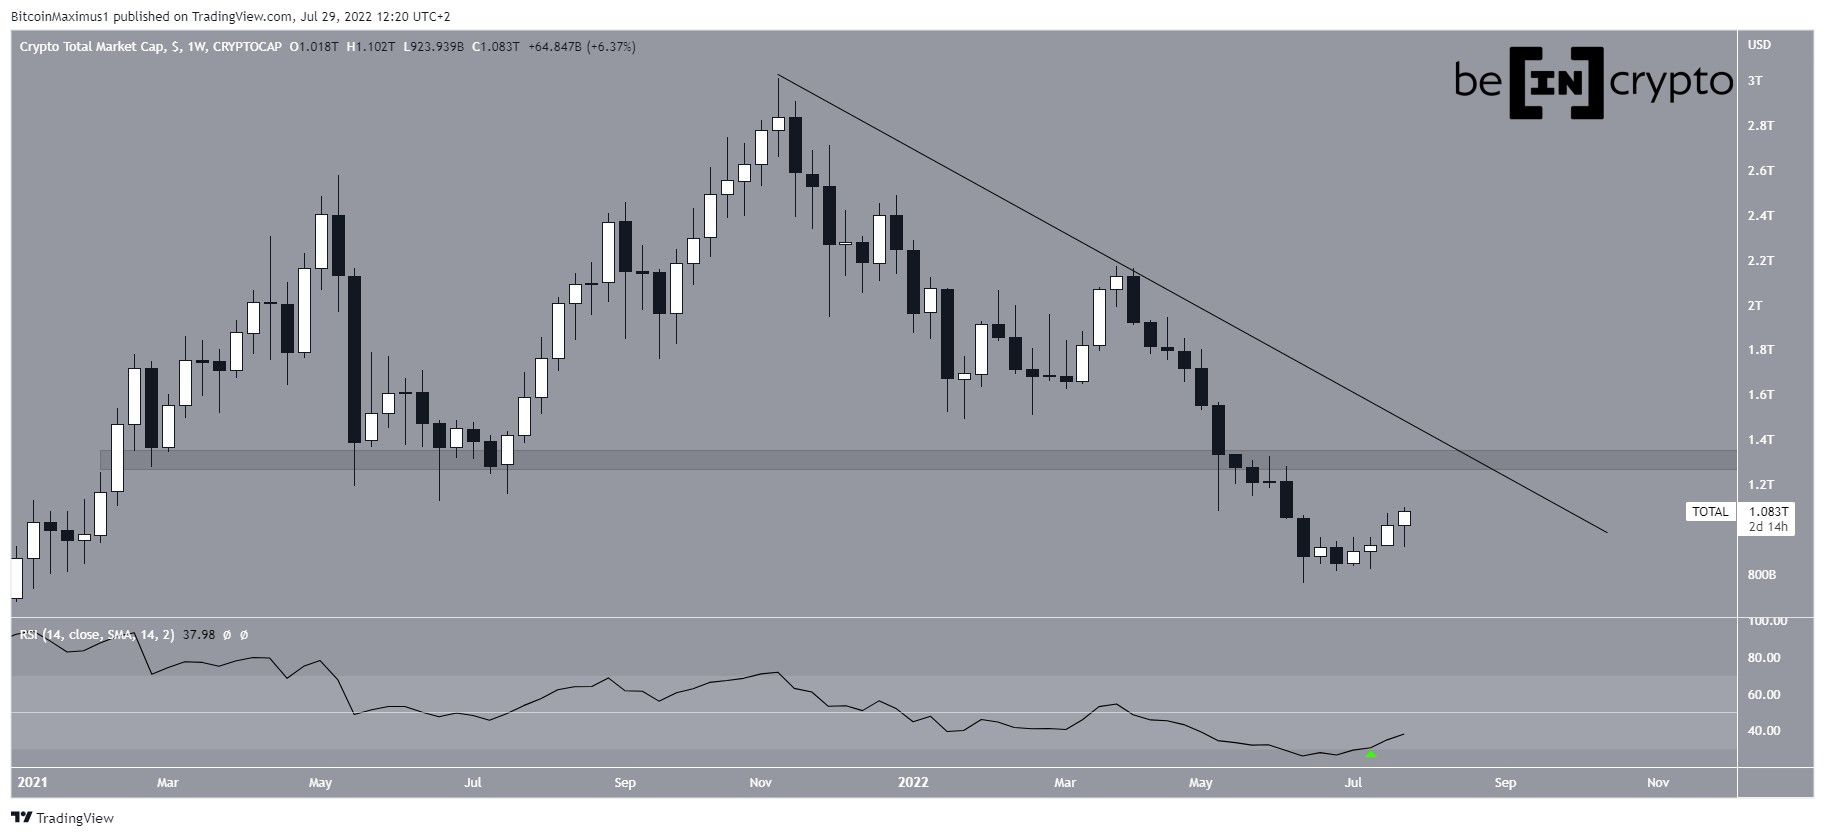
TOTALCAP has been decreasing underneath a descending resistance line since reaching an all-time high value of $3 trillion in Nov. The downward movement led to a low of $762 billion in June. This coincided with an all-time low value of 27 in the weekly RSI.
TOTALCAP has been moving upwards since, increasing above $1 trillion on July 29. This has also caused the weekly RSI to move outside its oversold territory (green icon).
If the upward movement continues, the closest resistance area would be at $1.30 trillion. This is a horizontal resistance area that also coincides with the aforementioned descending resistance line.
Ongoing breakout
The daily chart provides a bullish outlook that supports the continuation of the upward movement.
Firstly, TOTALCAP has broken out from a descending resistance line. Secondly, it has moved above the $960 billion horizontal area and validated it as support (green icon). Thirdly, the RSI has bounced at the 50 line and is currently at 63. These are all considered signs of a bullish trend.
Furthermore, the daily chart increases the importance of the $1.30 trillion resistance area, since it shows that besides being a horizontal resistance area, it is also the 0.382 Fib retracement resistance level.

Wave count analysis
Cryptocurrency trader @Thetradinghubb tweeted a chart of TOTALCAP, stating that it is mired in a long-term symmetrical triangle.
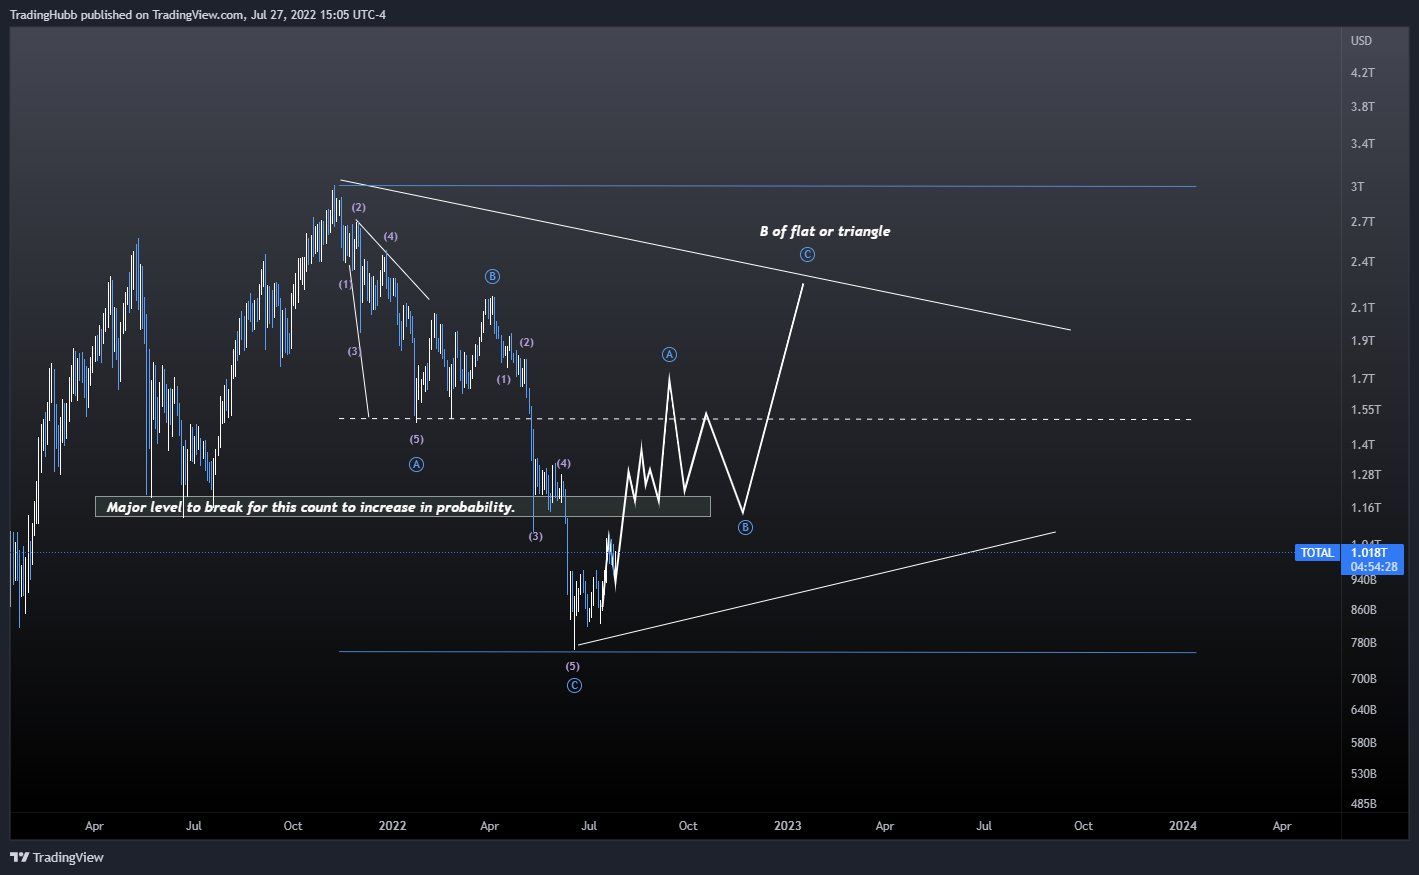
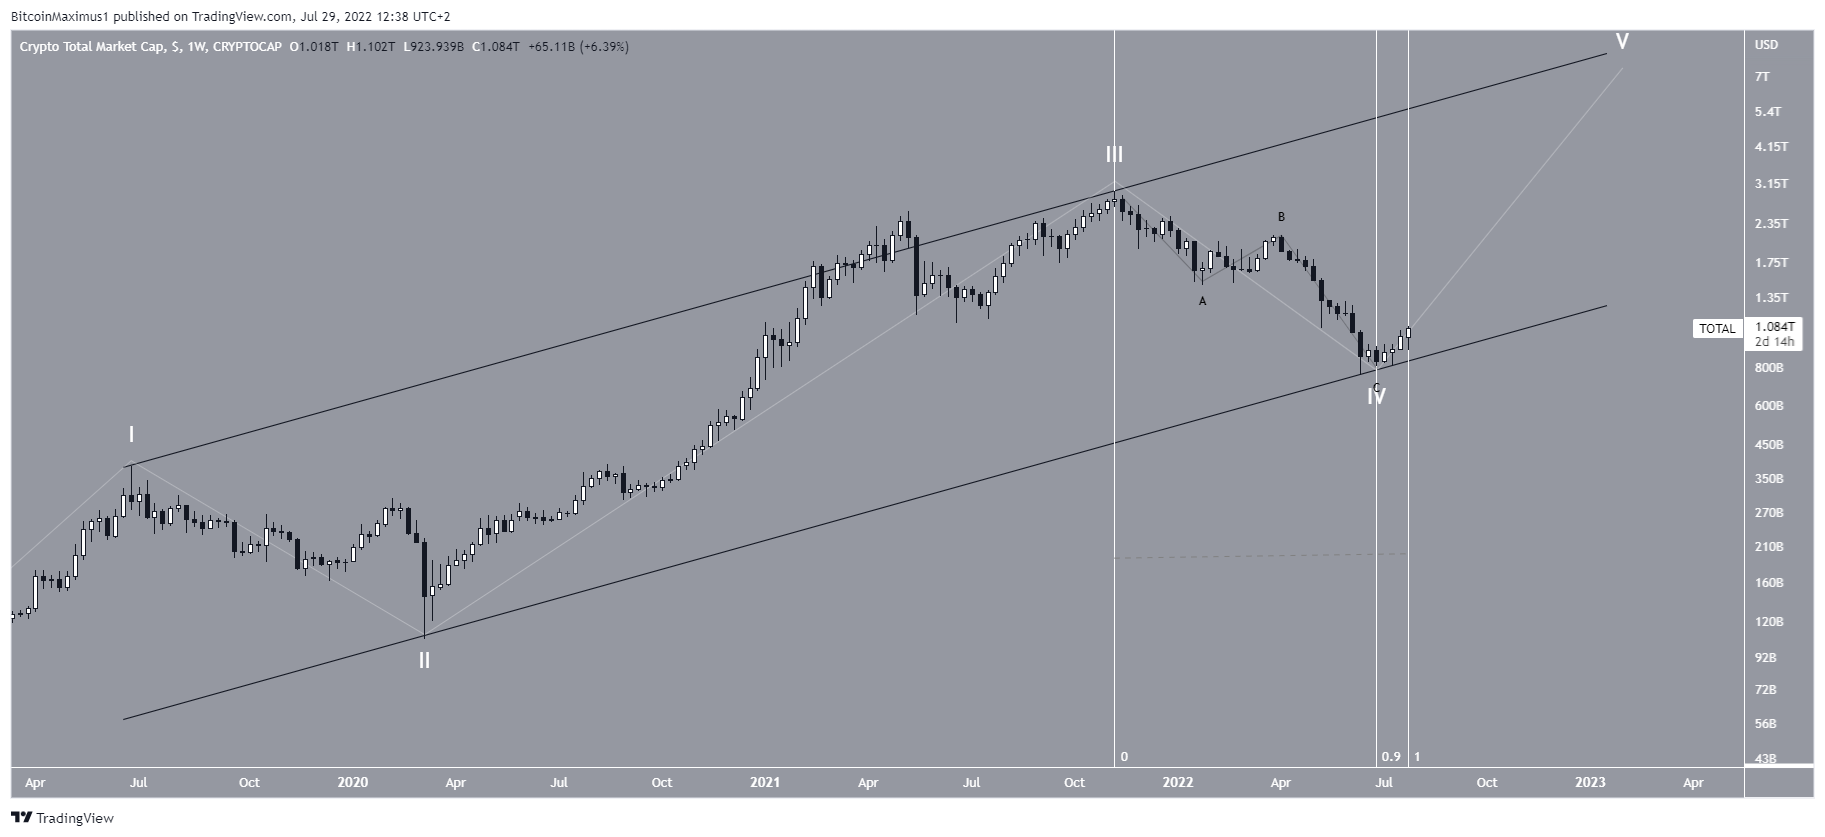
The most likely wave count suggests that TOTALCAP is in wave four of a five-wave upward movement (white) that began in March 2020. If a bottom was reached in June 2021, wave four would have a 0.9:1 length relative to wave two, while their lengths would currently be the same if a bottom has not yet been reached.
So, if wave four develops into a triangle, it would be considerably longer than wave two.
This allows for the possibility that wave four is already complete with an A-B-C corrective structure (black).
In any case, it seems that another upward movement towards a new all-time high will eventually occur.
For Be[in]Crypto’s latest Bitcoin (BTC) analysis, click here
Trusted
Disclaimer
In line with the Trust Project guidelines, this price analysis article is for informational purposes only and should not be considered financial or investment advice. BeInCrypto is committed to accurate, unbiased reporting, but market conditions are subject to change without notice. Always conduct your own research and consult with a professional before making any financial decisions. Please note that our Terms and Conditions, Privacy Policy, and Disclaimers have been updated.
