
Additionally, he posted a setup of a short trade along with a stop loss above the daily close at $54. (Note: The stop loss has been invalidated since then, but it was moved higher in the tweet update). Below, we will analyze both the possibility of Litecoin reaching $30 and the viability of initiating a short.$LTC short setup
— Fundamental Wolf (@FundamentalWolf) October 17, 2019
LTCUSD Weekly looks to me like it wants to come down & test weekly support.
Quite the distance to weekly support.
Daily last night closed new local lower low, I am shorting at the previous local daily close low (purple line).
Invalidation: Daily close above. pic.twitter.com/lAx7vmItOu
Will Litecoin Reach $30?
Looking at the weekly chart, we can see that Litecoin has decreased all the way to the 0.786 fib level of the preceding upward move. The volume profile shows significant buying power around this level. Also, the September 23-30 decrease occurred with significant but not extreme volume. Judged solely by the weekly chart, it does not look as if LTC is going to decrease.
Let’s take a look at the short-term and see if new indications arise.
Judged solely by the weekly chart, it does not look as if LTC is going to decrease.
Let’s take a look at the short-term and see if new indications arise.
Short-Term Bullishness
The price is trading inside a descending wedge. During September 24-October 7, the price created a support area at $52, defined by long lower wicks. On October 16, the price broke down below this area. However, the next day it created a bullish engulfing candle, reaching a close above the previous day’s opening price.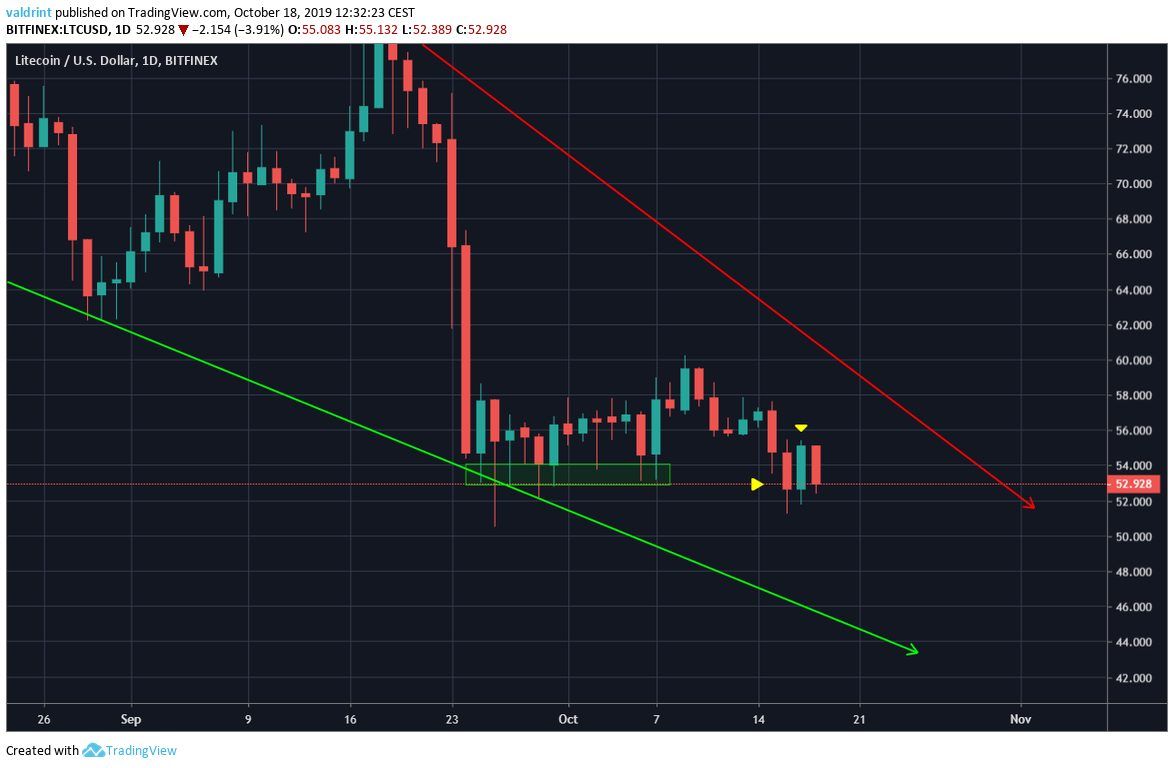 This has very serious bullish implications for two reasons.
First, the support area broke down but the decrease could not be sustained. Whenever a significant level is broken and the ensuing move is not sustained, it is often an indication that the price will reverse in the other direction.
The second one is the creation of a bullish engulfing candle, which further gives credence to the possibility of a reversal.
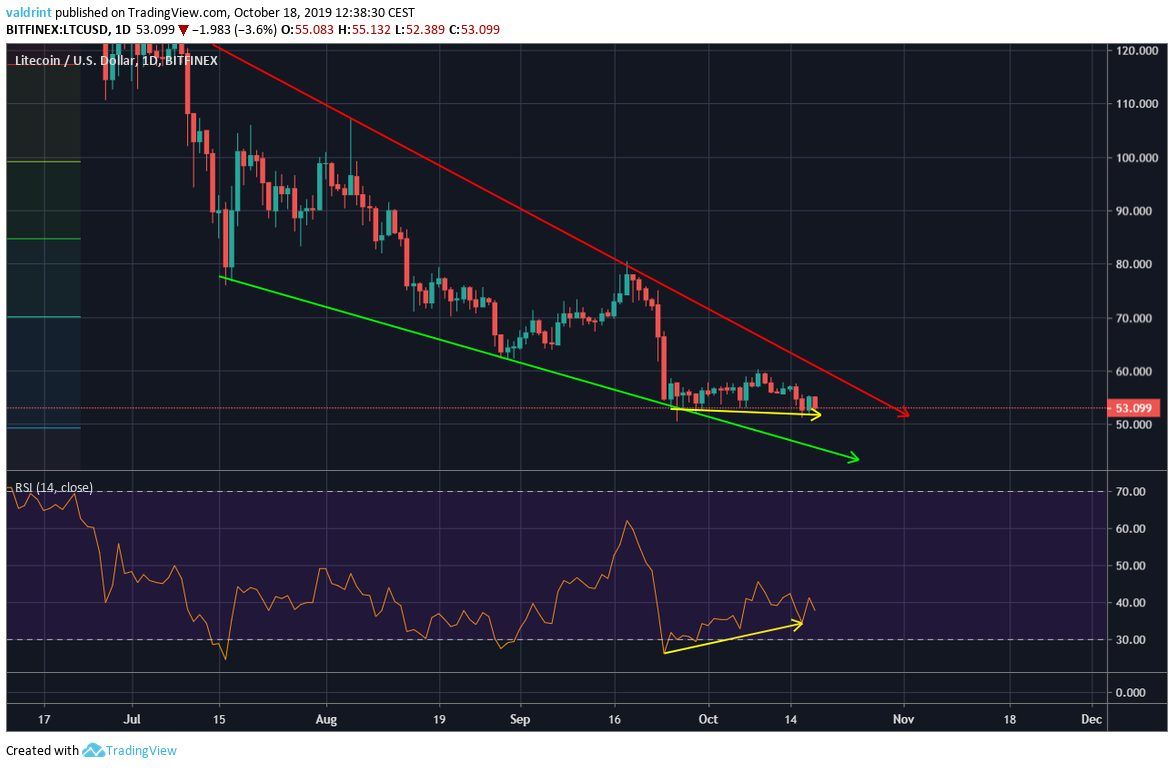
Looking at the wedge, we can also see a developing bullish divergence.
Therefore, bullish divergence combined with the creation of a bullish pattern and bullish candlestick characteristics makes me think that the price will eventually break out.
This has very serious bullish implications for two reasons.
First, the support area broke down but the decrease could not be sustained. Whenever a significant level is broken and the ensuing move is not sustained, it is often an indication that the price will reverse in the other direction.
The second one is the creation of a bullish engulfing candle, which further gives credence to the possibility of a reversal.
Looking at the wedge, we can also see a developing bullish divergence.
Therefore, bullish divergence combined with the creation of a bullish pattern and bullish candlestick characteristics makes me think that the price will eventually break out.
 While we do not rule out the possibility of LTC going down to $30, we do not think it is likely.
As for the initiation of a short trade, we completely agree with the reasoning behind it, since it was done after the support area was broken.
However, we do not agree with the subsequent change of the stop loss.
In our opinion, the daily bullish engulfing candle should have triggered the stop loss and invalidated the trade setup.
Recently, however, the Litecoin-Bitcoin correlation has recovered somewhat after the recent halving, as BeInCrypto has previously reported.
Do you think Litecoin will break out or break down? Let us know your thoughts in the comments below.
While we do not rule out the possibility of LTC going down to $30, we do not think it is likely.
As for the initiation of a short trade, we completely agree with the reasoning behind it, since it was done after the support area was broken.
However, we do not agree with the subsequent change of the stop loss.
In our opinion, the daily bullish engulfing candle should have triggered the stop loss and invalidated the trade setup.
Recently, however, the Litecoin-Bitcoin correlation has recovered somewhat after the recent halving, as BeInCrypto has previously reported.
Do you think Litecoin will break out or break down? Let us know your thoughts in the comments below.
[Disclaimer: This article is not trading advice and should not be construed as such. Always consult a trained financial professional before investing in cryptocurrencies, as the market is particularly volatile.]
Disclaimer
In line with the Trust Project guidelines, this price analysis article is for informational purposes only and should not be considered financial or investment advice. BeInCrypto is committed to accurate, unbiased reporting, but market conditions are subject to change without notice. Always conduct your own research and consult with a professional before making any financial decisions. Please note that our Terms and Conditions, Privacy Policy, and Disclaimers have been updated.
