


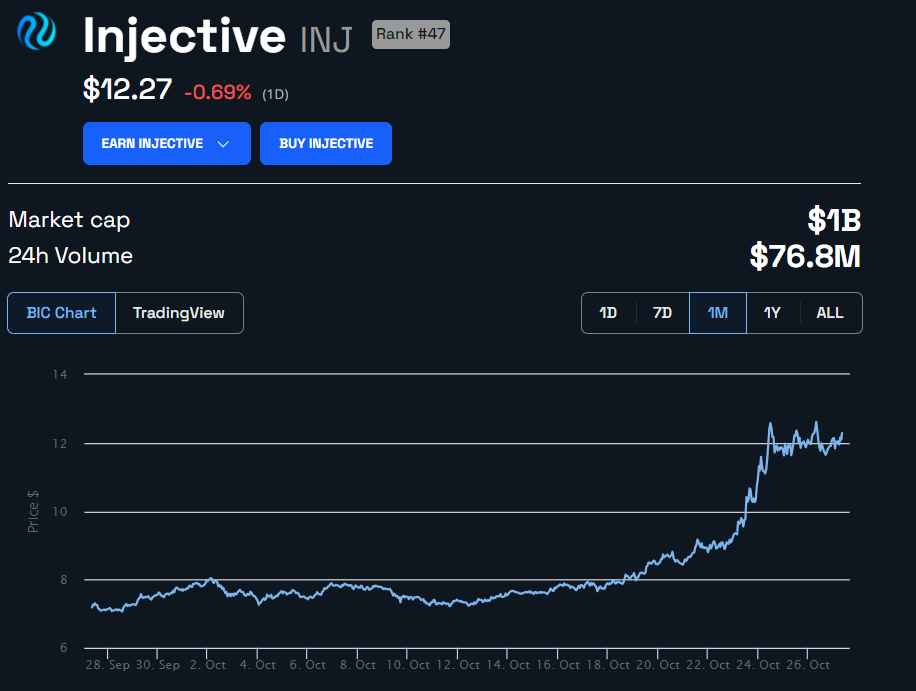
This token has witnessed an impressive price surge of over 930% since the beginning of the year despite the overall crypto market experiencing a bearish trend. This substantial increase reflects a remarkable performance, with the price surging by more than tenfold.
This token is called Injective (INJ), which presently boasts a market capitalization of approximately $1 billion. This positions the token at 44th place in terms of market capitalization rankings.
However, it’s worth noting that the daily trading volume for INJ is just under $80 million, which appears relatively low compared to its market capitalization.
930% Growth in 10 Months for Injective Price
Despite the overall bearish sentiment in the cryptocurrency market, this token has remarkably surged tenfold in value over the course of the year.
The INJ price successfully breached the 0.382 Fibonacci resistance level, situated around $10.4, earlier this month. Looking ahead, the next noteworthy Fibonacci resistance can be found at approximately $16.2, with additional horizontal resistance ranging from $16.65 to $25.3.
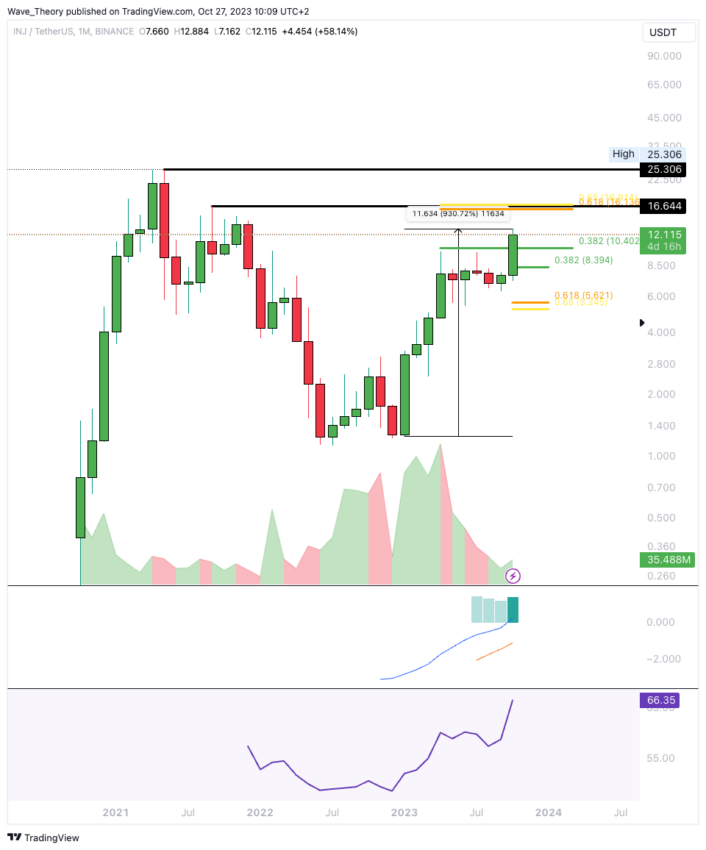
On another note, the RSI currently registers as neutral. However, there are positive signals as the MACD lines have recently formed a bullish crossover, and the MACD histogram displays bullish tendencies for the first time on the monthly chart.
Weekly RSI Signals Potential Bearish Divergence
Examining the weekly chart, there is a potential risk of a substantial bearish divergence developing in the RSI, which might precede a significant corrective movement in the price.
Despite this, it’s important to note that the MACD lines are currently in a bullish configuration, and the MACD histogram has been consistently demonstrating bullish momentum for several weeks.
These factors suggest that the token could experience further upward movement, possibly targeting the golden ratio resistance at approximately $16.2 before any significant correction occurs.
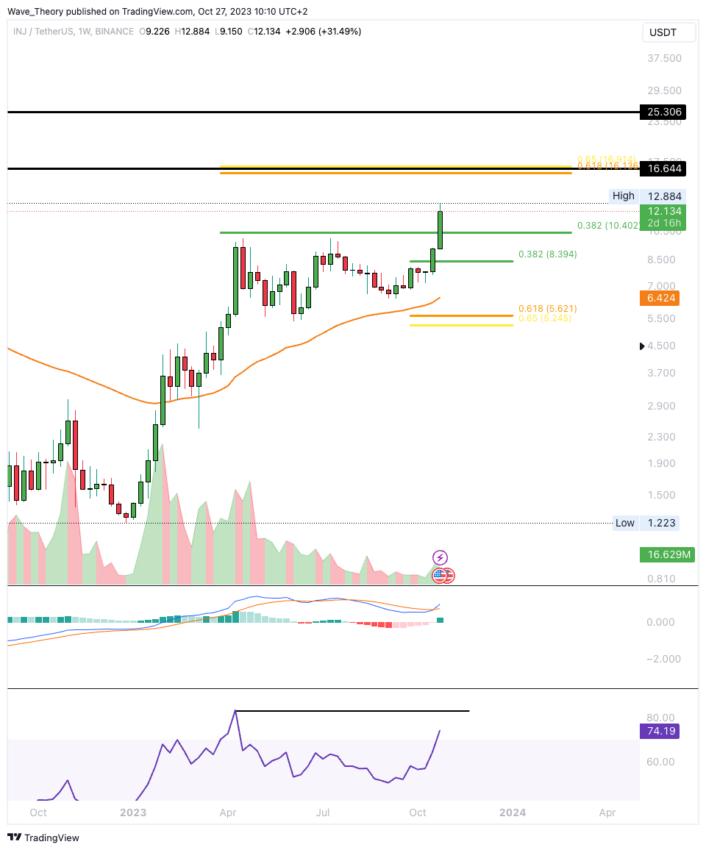
However, in the event of a correction, it’s worth considering that the token has notable Fibonacci support levels at around $8.4 and $5.6. The 50-week EMA at roughly $6.4 is an additional support layer.
INJ Coin Correction Underway?
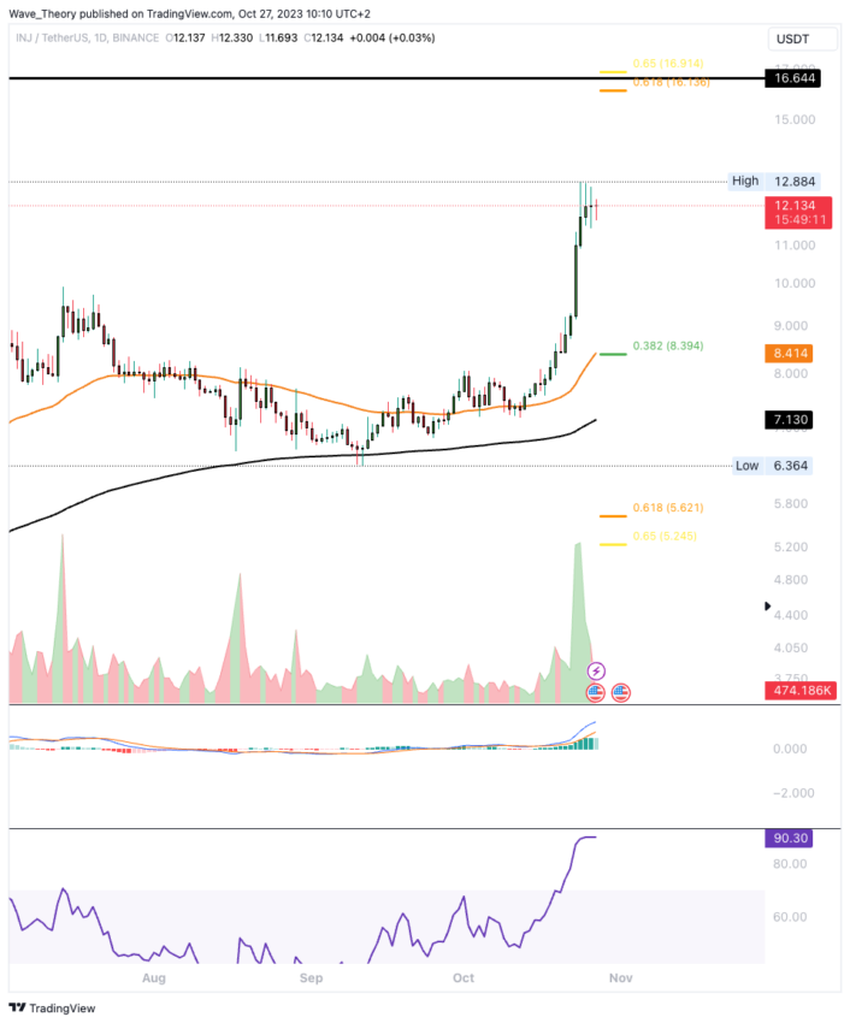
On the daily chart, there’s a notable occurrence of a golden crossover in the Exponential Moving Averages (EMAs), which serves as a confirmation of the bullish trend in the short to medium term.
Additionally, the MACD lines exhibit a bullish crossover, further reinforcing the bullish sentiment. However, it’s important to note that the MACD histogram shows initial bearish signals, with a recent tendency to tick lower in a bearish manner.
This could indicate some early signs of potential bearish pressure.
Furthermore, the Relative Strength Index (RSI) is currently in extremely overbought regions. This suggests that the token might be overextended in the short term.
Significant Fibonacci support can be found around $8.4 in the event of a correction, with the added support of the 50-day Exponential Moving Average (EMA) at this level. This confluence of support may act as a potential price floor in case of a downturn.
4-Hour Chart Signals Bullish Trend Confirmation
In the 4-hour (4H) chart, there is a notable occurrence of a golden crossover in the Exponential Moving Averages (EMAs). This confirms a bullish trend in the 4H chart, aligning with the bullish sentiment observed in the daily chart.
However, it’s important to note that the MACD lines have already crossed bearishly in this shorter time frame. Additionally, the histogram of the MACDs displays mixed signals, oscillating between bullish and bearish movements.
These conflicting MACD signals may indicate a degree of uncertainty in the shorter-term price direction.
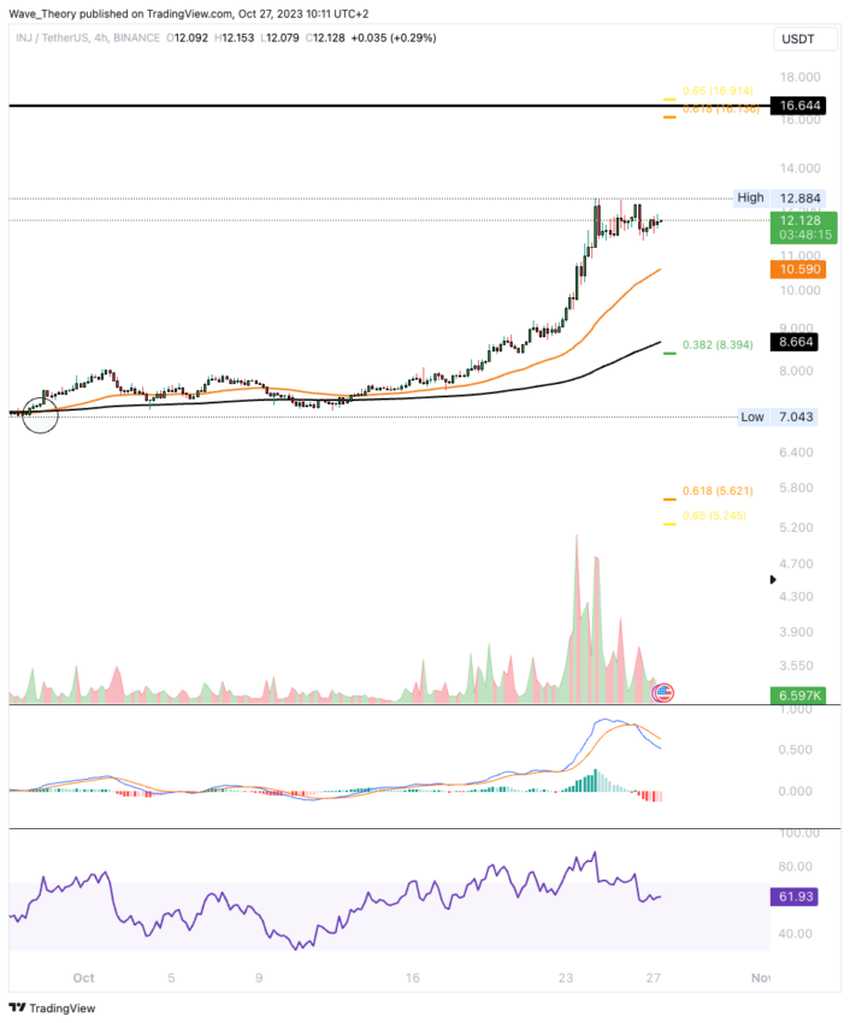
Furthermore, the Relative Strength Index (RSI) in the 4H chart is currently in neutral territory, neither strongly bullish nor bearish. This suggests a balance between buying and selling pressures within this time frame.
Traders and investors should consider these mixed signals and the potential for shorter-term volatility when making trading decisions based on the 4H chart.
Year-to-Date Performance Hits 432% Increase Against Bitcoin
The token in question has displayed remarkable strength against Bitcoin (BTC) throughout the year. Registering a substantial 432% increase in value since the start of the year.
Notably, in the current month, the token’s price successfully breached the critical golden ratio resistance level at approximately 0.00031 BTC. This breakthrough suggests that the price may potentially reach its previous high point, located at approximately 0.00047 BTC.
However, it’s worth highlighting that the token’s price now faces a notable resistance zone between approximately 0.000375 BTC and 0.00047 BTC. Beyond this resistance area, there are no immediate barriers to further price advancement.
In addition, the token’s monthly chart reveals several positive indicators. The MACD (Moving Average Convergence Divergence) histogram has started to exhibit bullish movement, marking the first time in the recent period.
Moreover, the MACD lines have crossed bullishly, further supporting the bullish sentiment. The Relative Strength Index (RSI) is also gradually approaching overbought regions, indicating strong buying momentum.
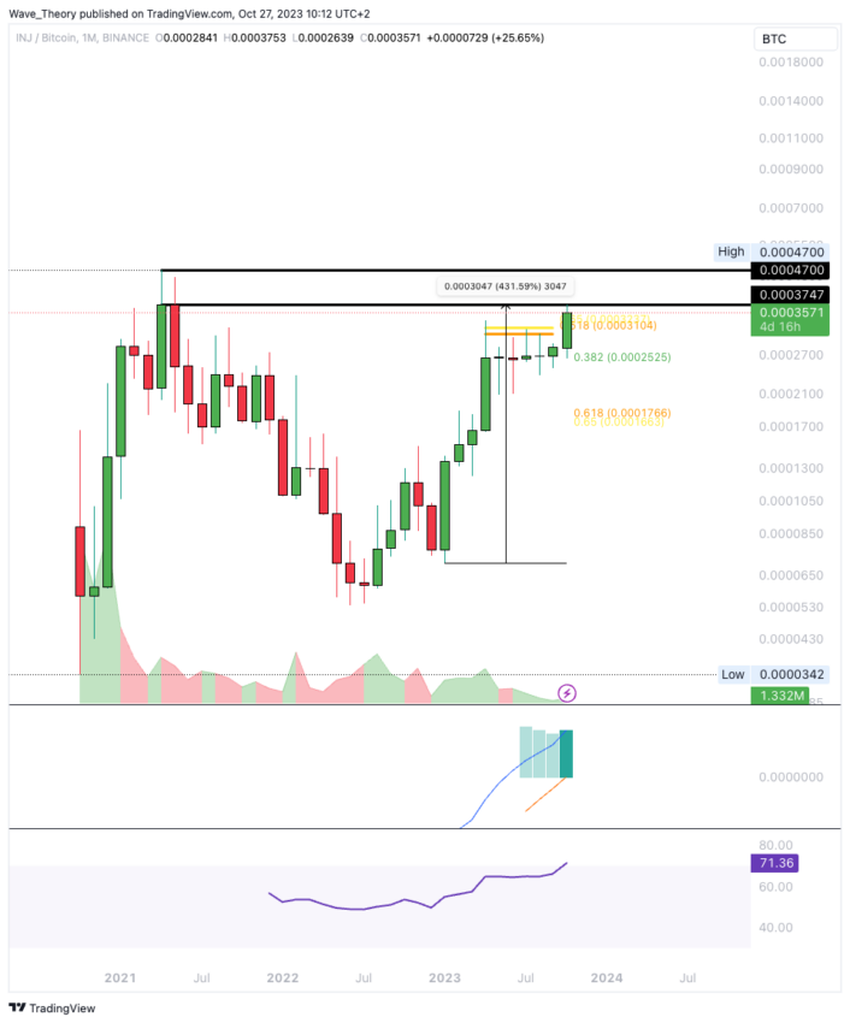
It’s essential to monitor how the token’s price behaves in the face of potential bearish pressure within the resistance zone mentioned (0.000375 BTC to 0.00047 BTC).
In the event of a bearish rejection, the token may find support at significant Fibonacci levels around 0.0002525 BTC and 0.000175 BTC.
Read More: Best Crypto Sign-Up Bonuses in 2023


