


The SushiSwap (SUSHI) price has reclaimed a crucial resistance level and validated it as support.
Even though the price has shown weakness, SUSHI is likely to continue rising as long as it’s trading above this level.
SUSHI Reclaims Resistance
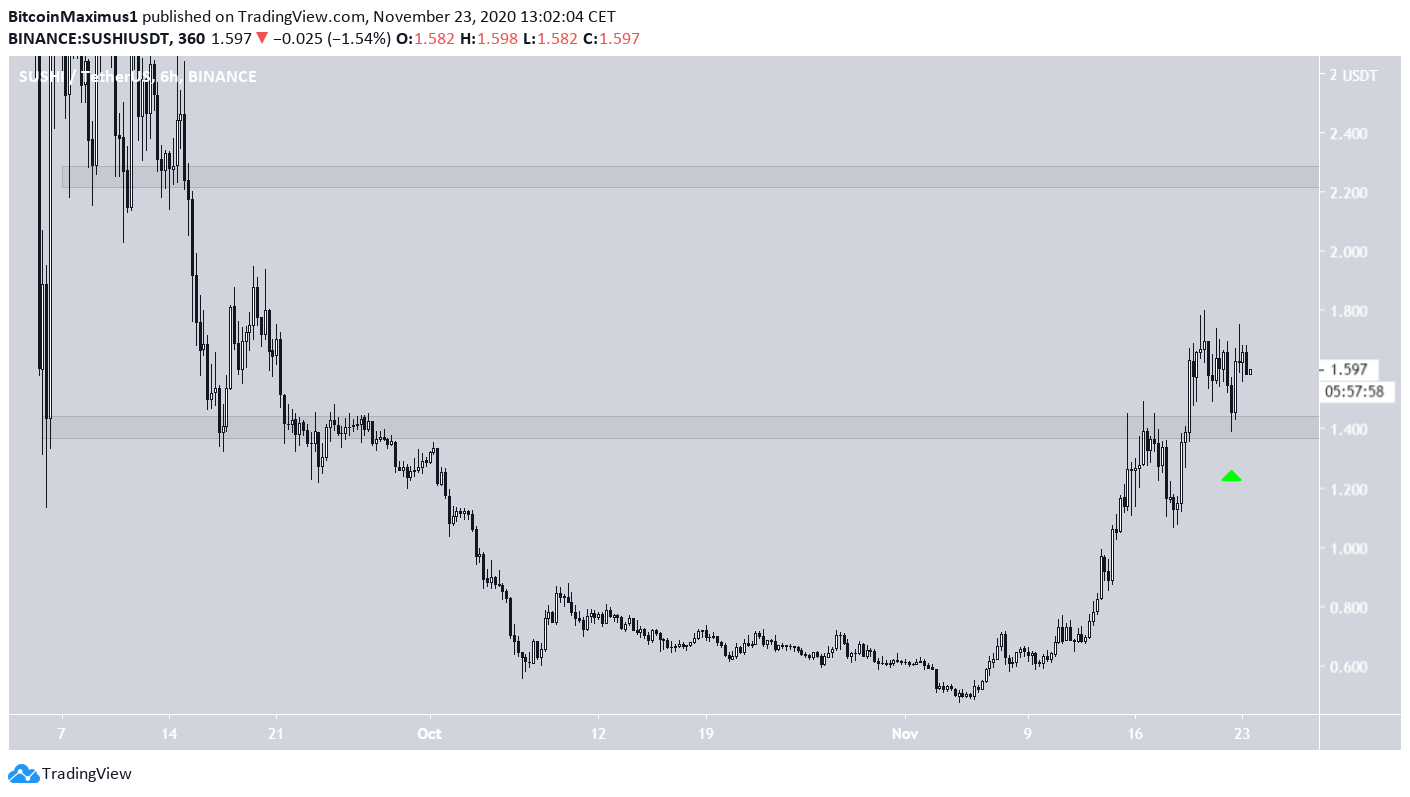
The SUSHI price has been moving upwards since it reached an all-time low of $0.47 on Nov 4. The rally since then has been swift, and on Nov 17, the price reached a high of $0.179, before declining slightly.
Despite the drop, SUSHI has only returned to the $1.40 area and validated it as support. Previously, the price had been trading below this level since Sept 22, so the reclaim is a bullish sign that could pave the way for even higher prices.
If SUSHI continues to rally, the next resistance area would be at $2.25.
Future Movement
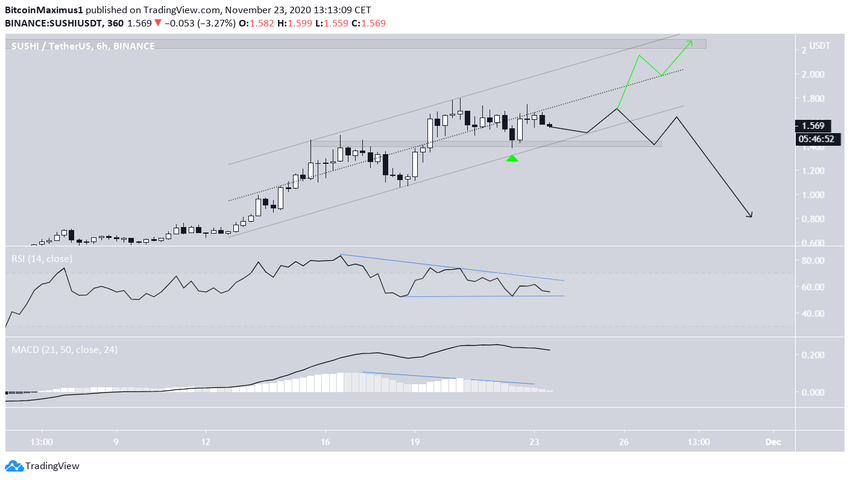
A closer look at the rise reveals that SUSHI is trading inside a parallel ascending channel, currently trading very close to the support line. The support line also coincides with the recently reclaimed $1.40 support area. Therefore, a breakdown from the channel would indicate the end of the trend and that SUSHI will likely decline below $1 again.
On the other hand, a reclaim of the middle of the channel, which is currently providing resistance near $1.70 would mean that prices are heading higher. The resistance line of the channel coincides with the $2.25 area, making it likely to act as the top if the price continues to rally.
Technical indicators are slightly bearish. While the RSI is above 50, it has created a descending triangle. A price breakdown from the channel would also cause a breakdown from the triangle, confirming that the price is heading lower.
Similarly, the MACD is above 0 but has formed significant bearish divergence.
While the direction of the trend is currently unclear, a loss of the $1.40 area would confirm a bearish trend. As long as the price is trading above this level, however, the possibility of continuation remains high.
SUSHI’s Wave Count
Cryptocurrency trader @TheEWguy outlined a SUSHI chart, stating that despite the rise, SUSHI has likely begun a long-term bullish impulse and will increase for some time. He outlined the $0.70 – $0.90 area as a potential retracement level to initiate longs.
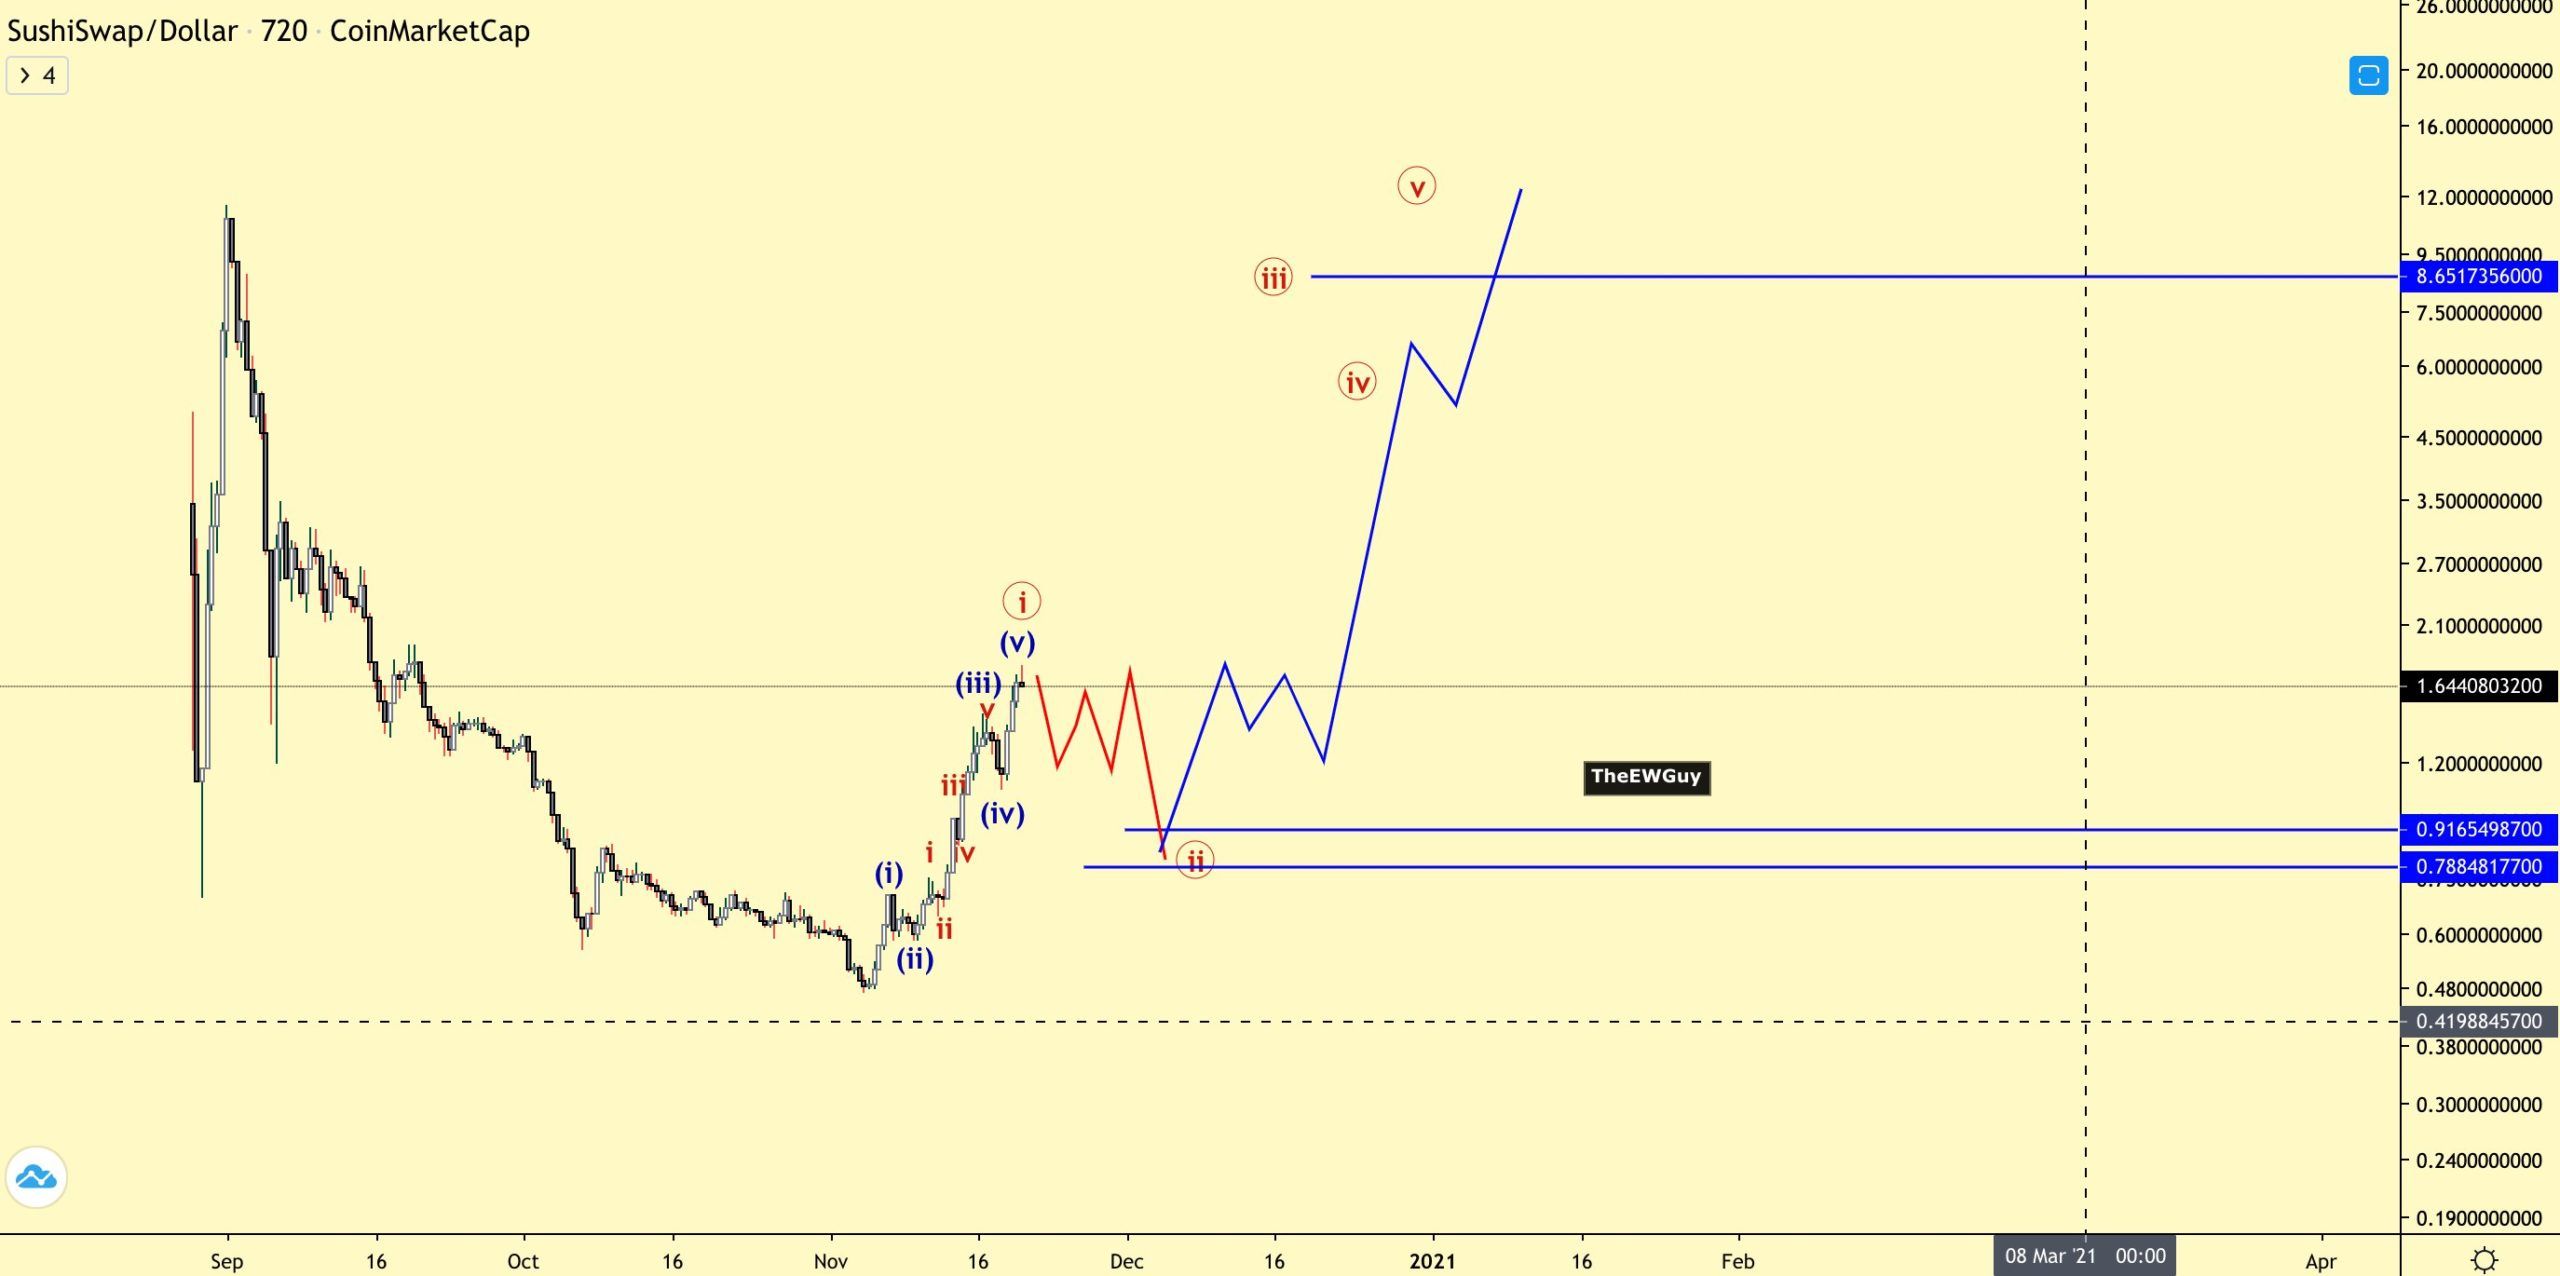
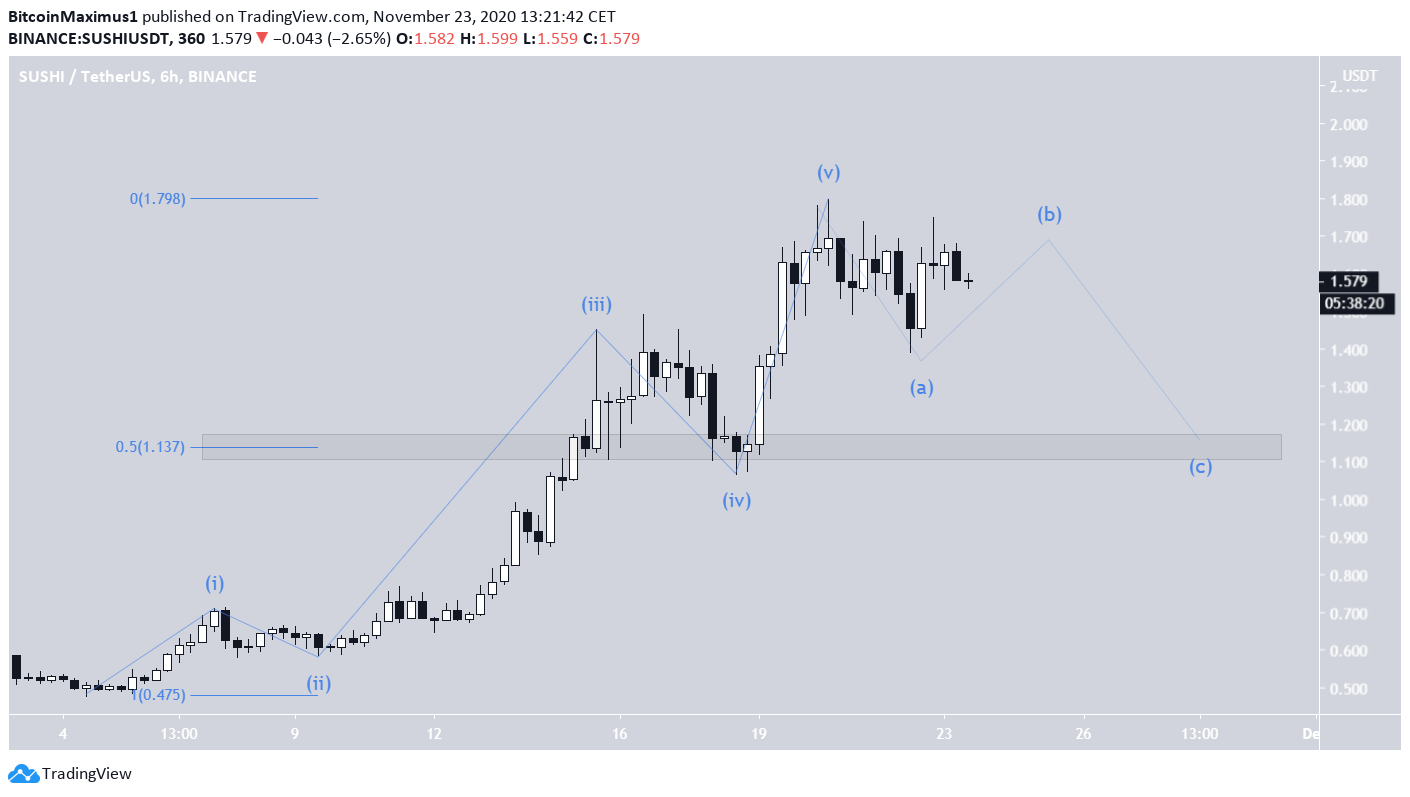
Since the upward move began on Nov. 4, the SUSHI price seems to have completed what looks like a bullish impulse (shown in blue below). If so, a corrective A-B-C structure awaits, which could end near the 0.5 Fib retracement level at $1.13.
If the price were to reclaim the middle of the channel, as outlined previously, it’s possible that the price begins a final upward move towards the $2.25 area. However, a corrective structure would again await after that, causing the price to fall for a period of time.
Conclusion
To conclude, whether the SUSHI price breaks out or down from the ascending channel will be crucial in determining if the upward move is done.
Either way, the price seems to be very close to reaching the top of its upward move and should soon begin a corrective period towards the support area near $1.05.
For BeInCrypto’s previous Bitcoin analysis, click here!
Disclaimer: Cryptocurrency trading carries a high level of risk and may not be suitable for all investors. The views expressed in this article do not reflect those of BeInCrypto


