


Bitcoin has approached the $60,000 level and is back in the area of its all-time high (ATH) set in April 2021. Based on a fractal analysis of charts of previous BTC cycles, the peak prediction for the ongoing bull market even reaches the vicinity of $390,000.
Cryptocurrency and Bitcoin market analyst, @TechDev_52 has tweeted a series of charts on the possibility of future long-term movement of BTC. They show bullish predictions for the price of the alpha cryptocurrency for the next few months, especially at the end of this year.
In addition, the analyst used Fib levels to depict the potential bottom of a future bear market. Finally, he pointed out the similarities between the 1970s gold chart fractal and today’s Bitcoin price action.
Bitcoin’s fractal and Q4 pump
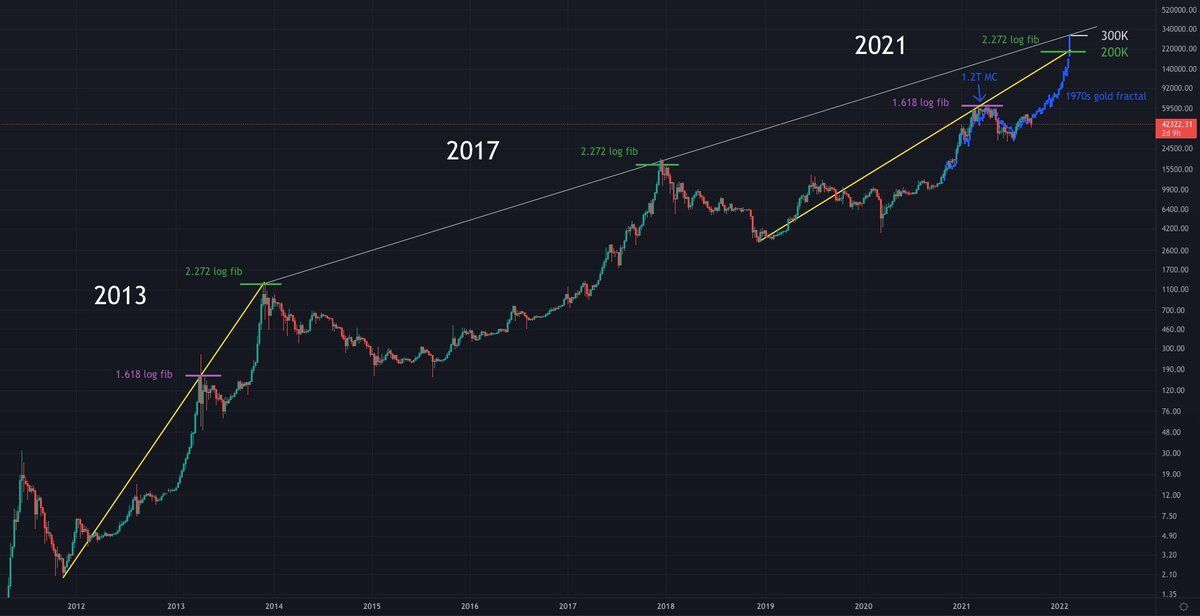
The first chart published by TechDev looks at the fractal structure of the monthly BTC chart. It compares the price action from the 2013 bull market with the current 2021 rally. It turns out that the monthly candles are very similar – both in terms of their alignment with each other and when comparing their shapes.
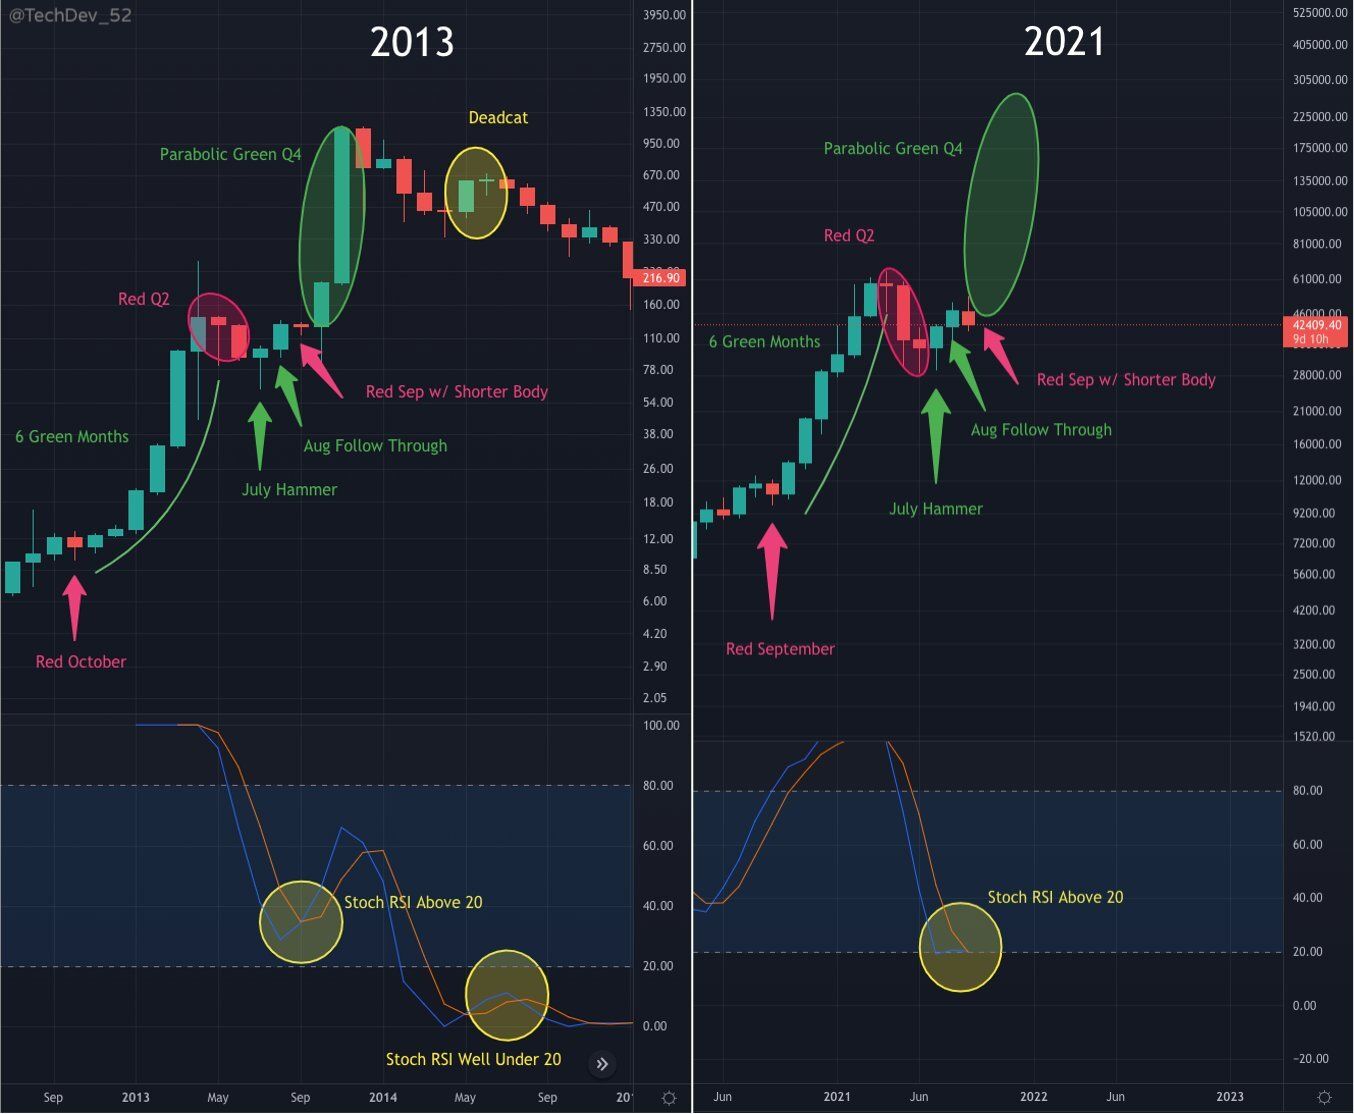
The start of the bull market in both cases was a red candle at the turn of the third and fourth quarters. This was followed by parabolic uptrends that led to 6 consecutive green monthly candles.
In the next stage, there was a correction (red circle) in the second quarter. It ended with a bullish hammer candle in July and a continuation of the increases in August. This was followed by a red candle in September, which historically has been a very bearish month.
What happened next was a parabolic rise for the last 2 months of 2013, which ended with a historical ATH at $1163. If this Bitcoin fractal were to continue, the end of 2021 could take the price into the $200-300k range.
Peak projection at $390,000
An even more bullish prediction is provided by the second of the published charts. It shows an analysis of Bitcoin’s potential fractal rise based on the bi-weekly RSI. TechDev points out that in both of the previous bull markets of 2013 and 2017, “the run after mid-cycle dip moved 30% per biweekly RSI.”
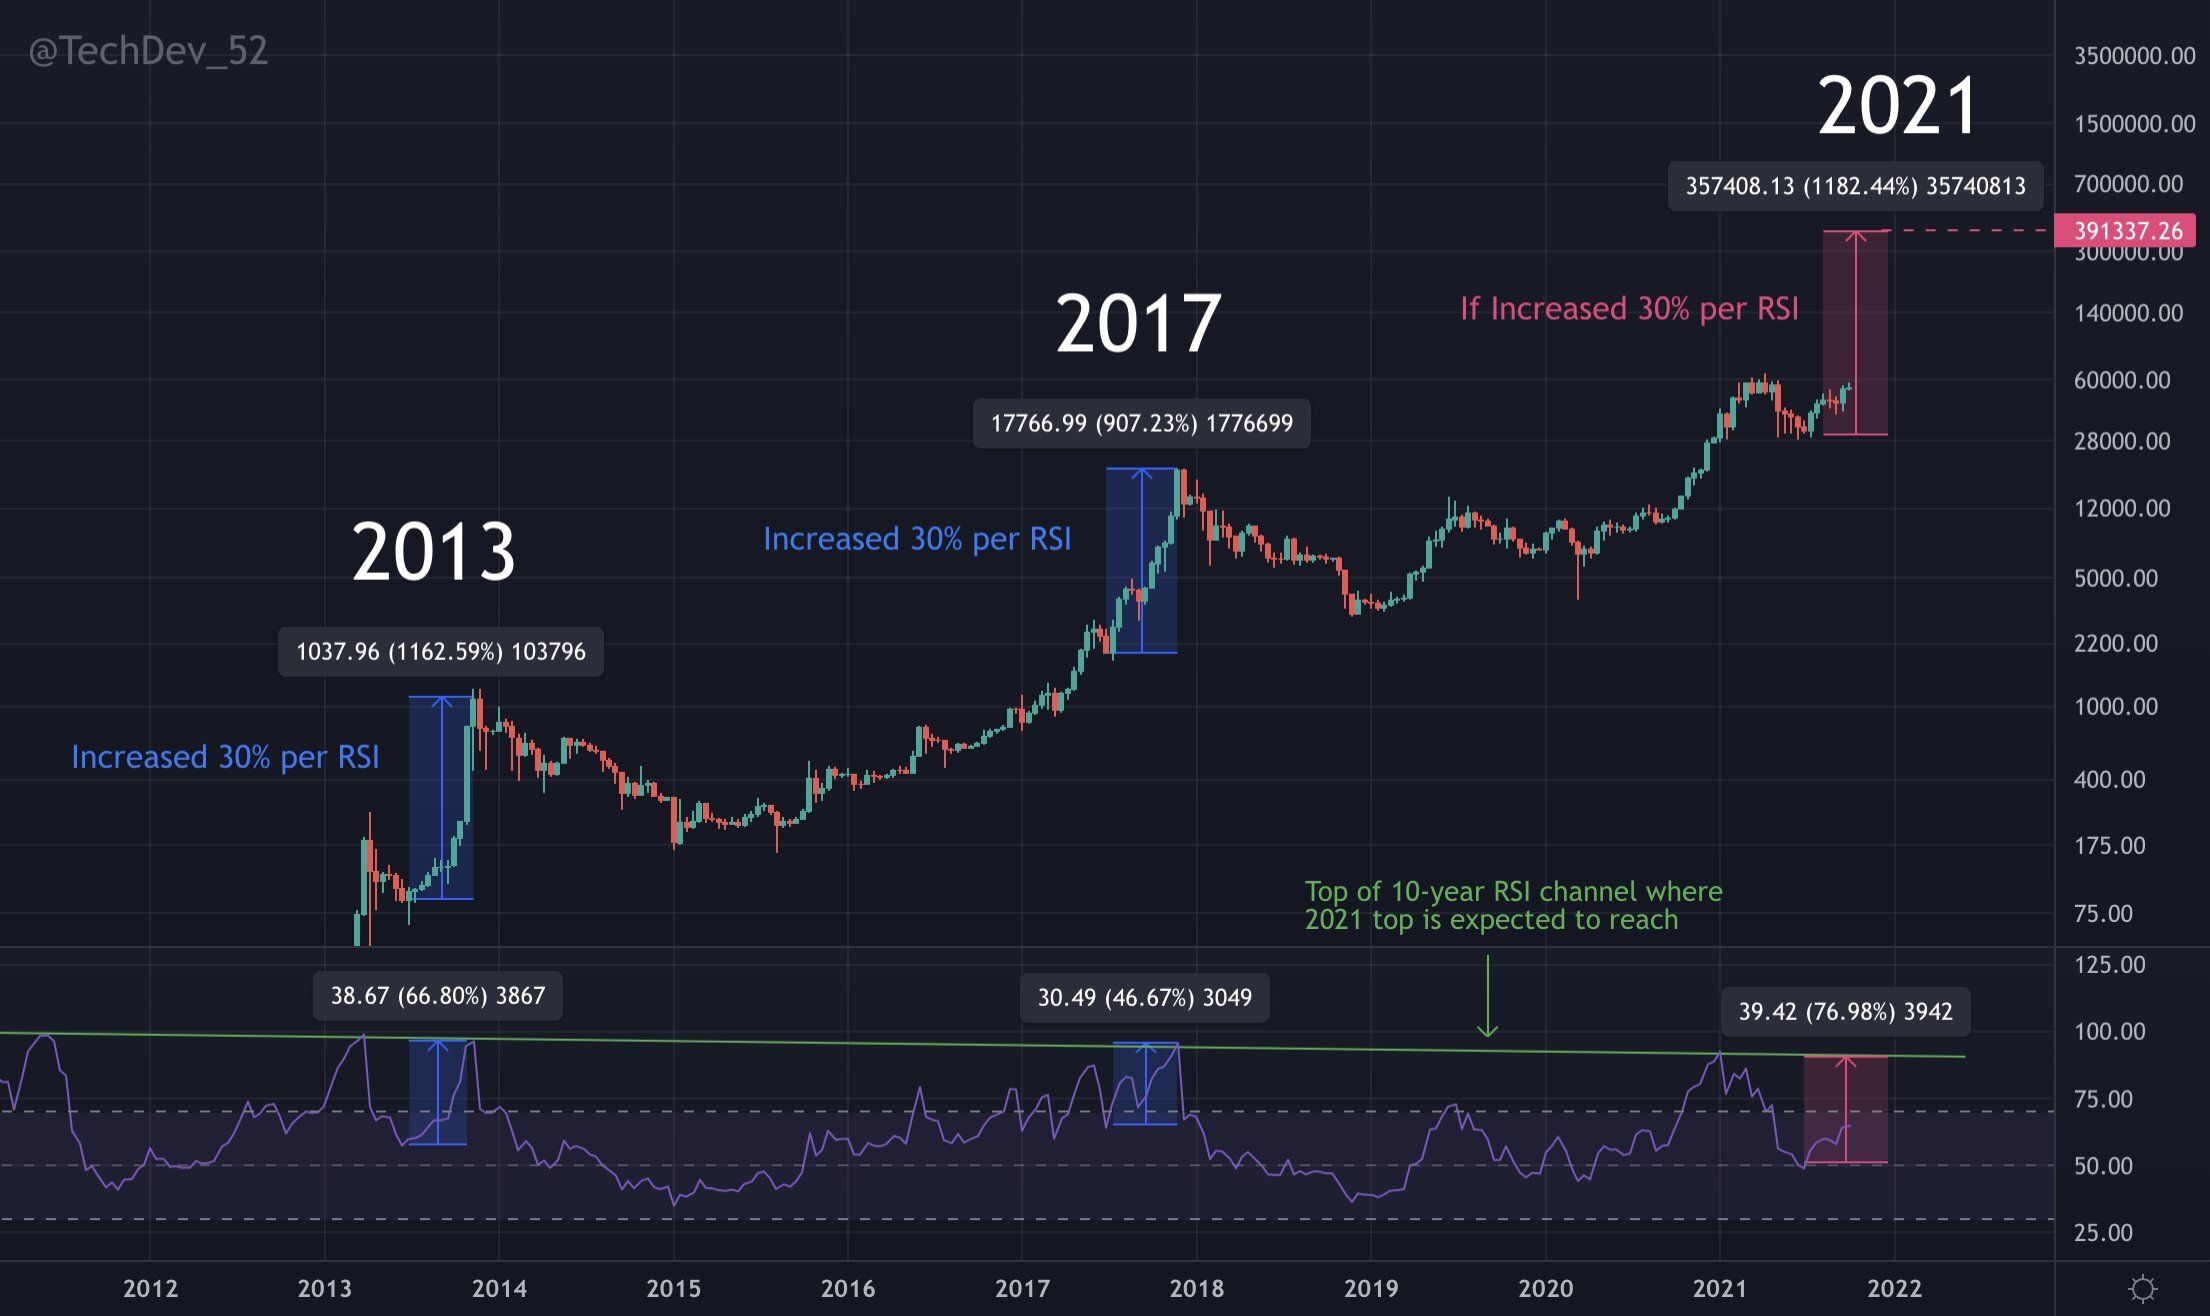
According to the analyst, if this Bitcoin fractal were to repeat itself, there is a theoretical possibility of a peak at $390,000. This analysis is further reinforced by the long-term trendline on the bi-weekly RSI (green), which has been in place since the first BTC cycle. However, he realistically admits:
“Do I think we get this high? No. But the consistency is interesting and shows we have tons of room to run.”
Bear market bottom
Another interesting chart shows a bottom prediction for a future bear market. The beginning of a macro downtrend is expected after the peak in the coming months. It turns out that the level to which the price of BTC can fall in the next few years is the area where it is currently located: $47-60k.
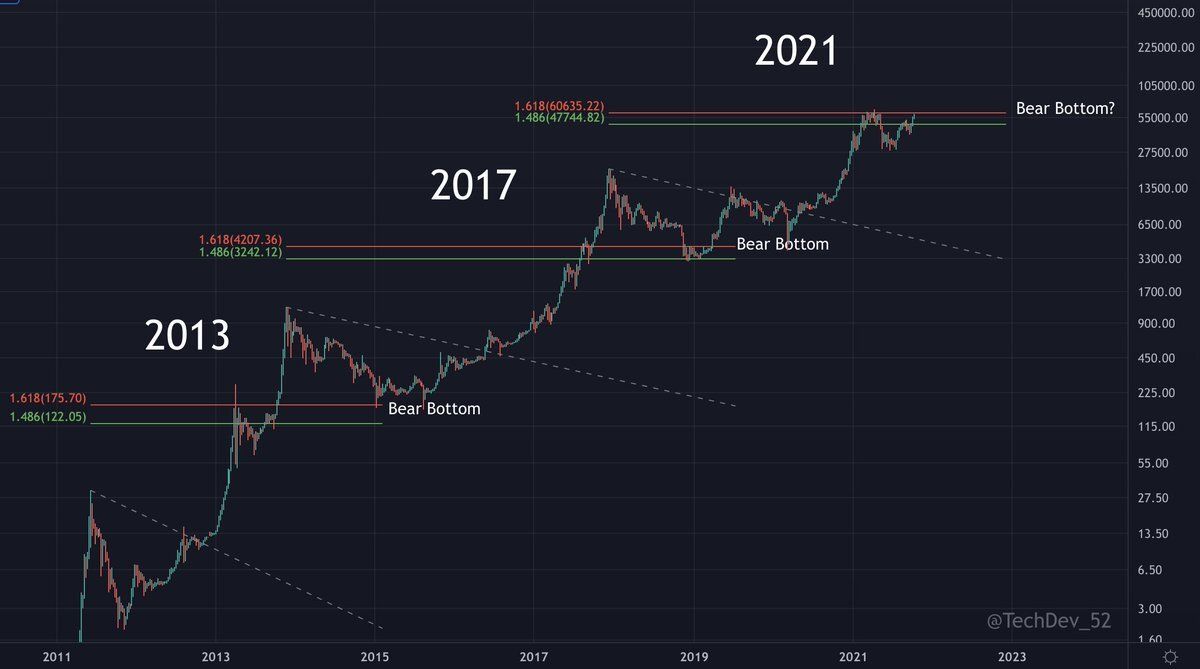
To determine this level, TechDev again uses Bitcoin’s historical fractal. He superimposes a long-term Fib retracement level on a logarithmic chart of BTC measuring from the absolute peak of each cycle to the absolute bottom.
It turns out that for the previous two cycles, the bottom of the subsequent bear market always reached the range of the 1.486-1.618 Fib external retracement. If this were to happen in the future as well, the $47-60k area would be reached after an 80-85% decline from the ATH of this bull market. A simple mathematical calculation shows that the peak of this bull market would have to be reached in the $235-315k range.
Gold’s ridiculous fractal
Finally, our analyst also points out the similarities that the current Bitcoin fractal exhibits with the gold price chart from the 1970s. Although the two charts correspond to different time frames, it is hard not to notice the numerous similarities. TechDev admits with disarming frankness that “now it’s just getting ridiculous.”
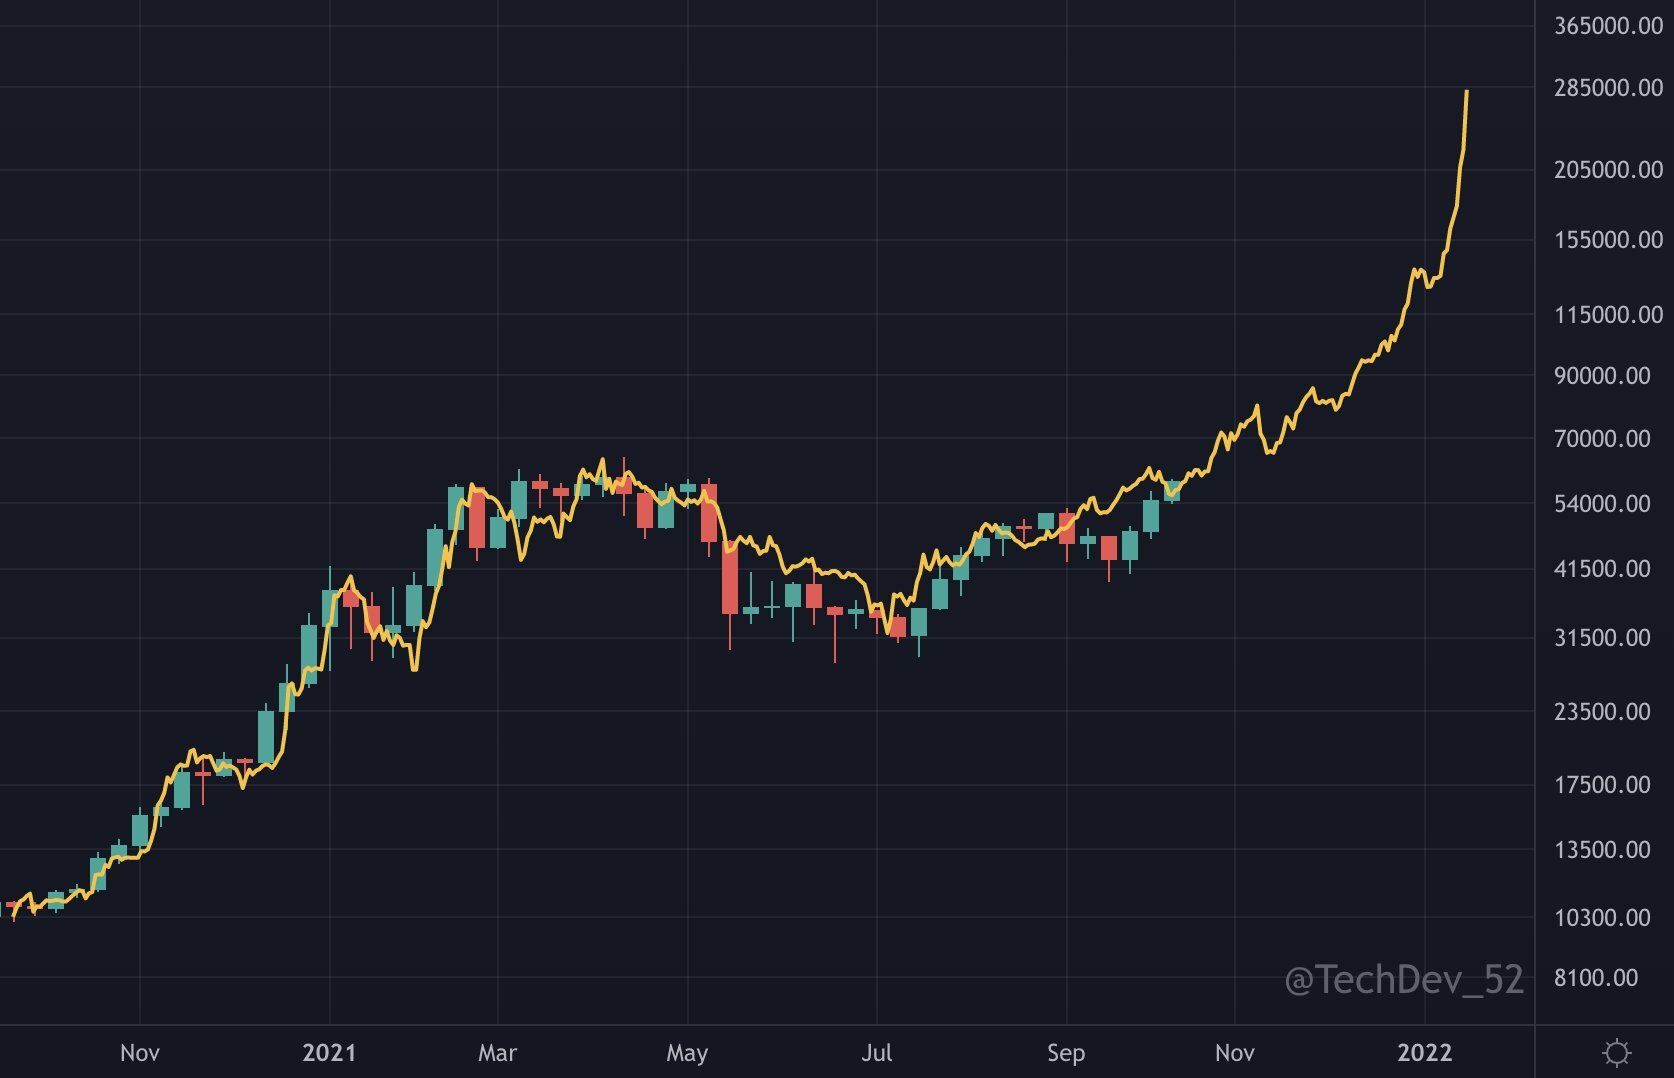
Interestingly, the Bitcoin price prediction based on the gold fractal remains within the ranges shown above for the bull market peak. Moreover, this calculation stays consistent with another TechDev chart, in a comment on which the analyst wrote: “200-300K #Bitcoin looks almost too programmed.”
This chart also uses the 2.272 Fib external retracement to estimate the top of this BTC bull market. It also uses the historical gold fractal (blue line). Even the market capitalization of both assets agrees. At the time, the total value of gold reached $1.2 trillion. Almost exactly the same as Bitcoin’s market capitalization today.
For BeInCrypto’s latest Bitcoin (BTC) analysis, click here.
What do you think about this subject? Write to us and tell us!


