The prices of both Ethereum (ETH) and TRON (TRX) have seen healthy growth since April 6, gaining 10% and 6% respectively versus Bitcoin.
In addition, their short-term patterns suggest that these upward moves might still be in their initial phases, indicating that further increases are in store.
Ethereum (ETH)
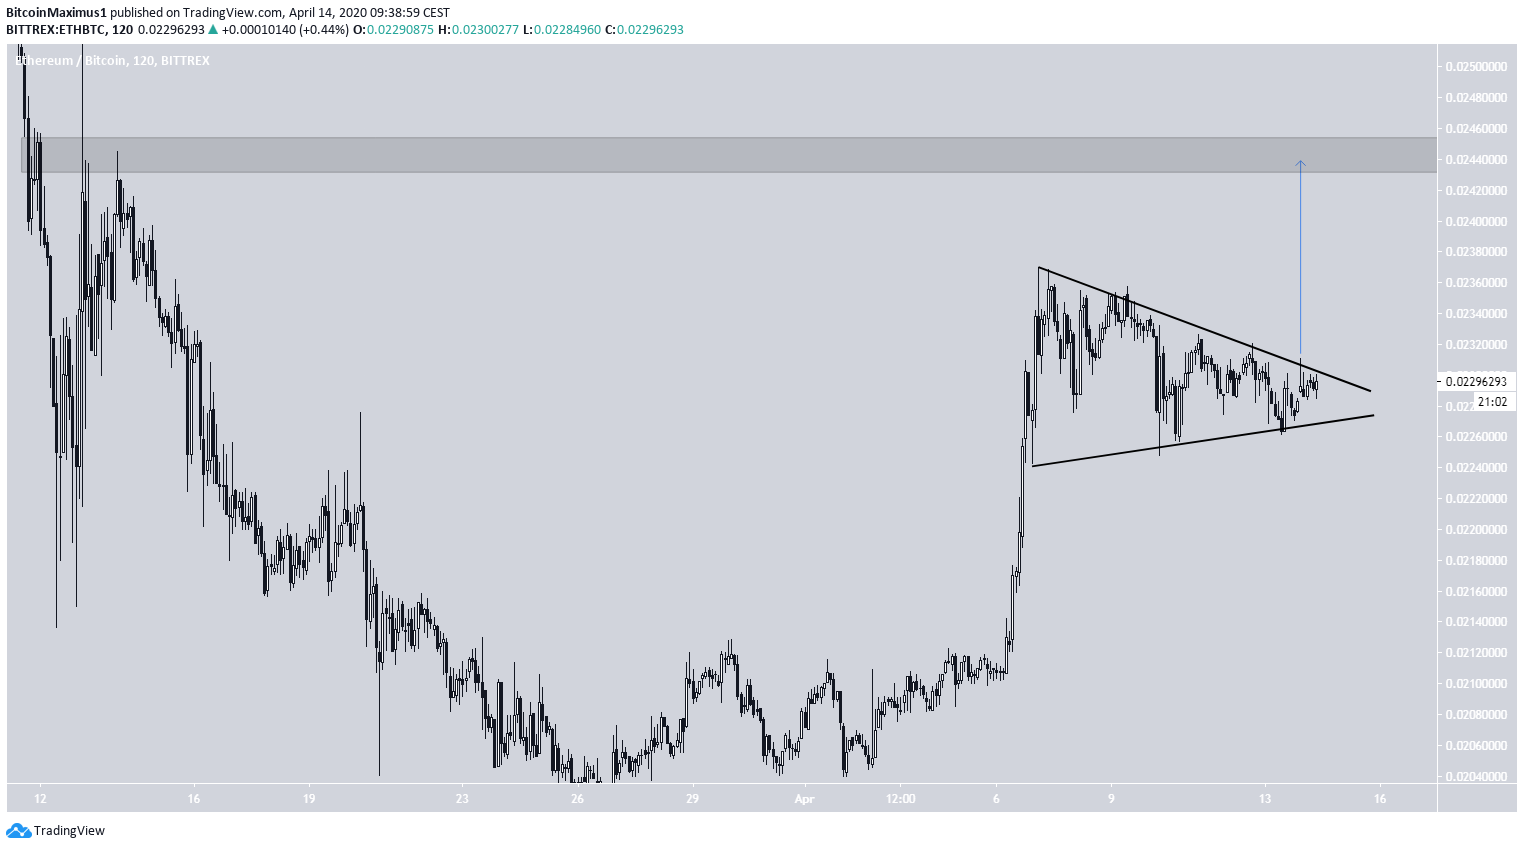
Well-known cryptocurrency trader @PostyXBT tweeted an Ethereum chart showing a short-term symmetrical triangle in place. He stated that he believes another leg up is due and outlined a resistance area at ₿0.0245.
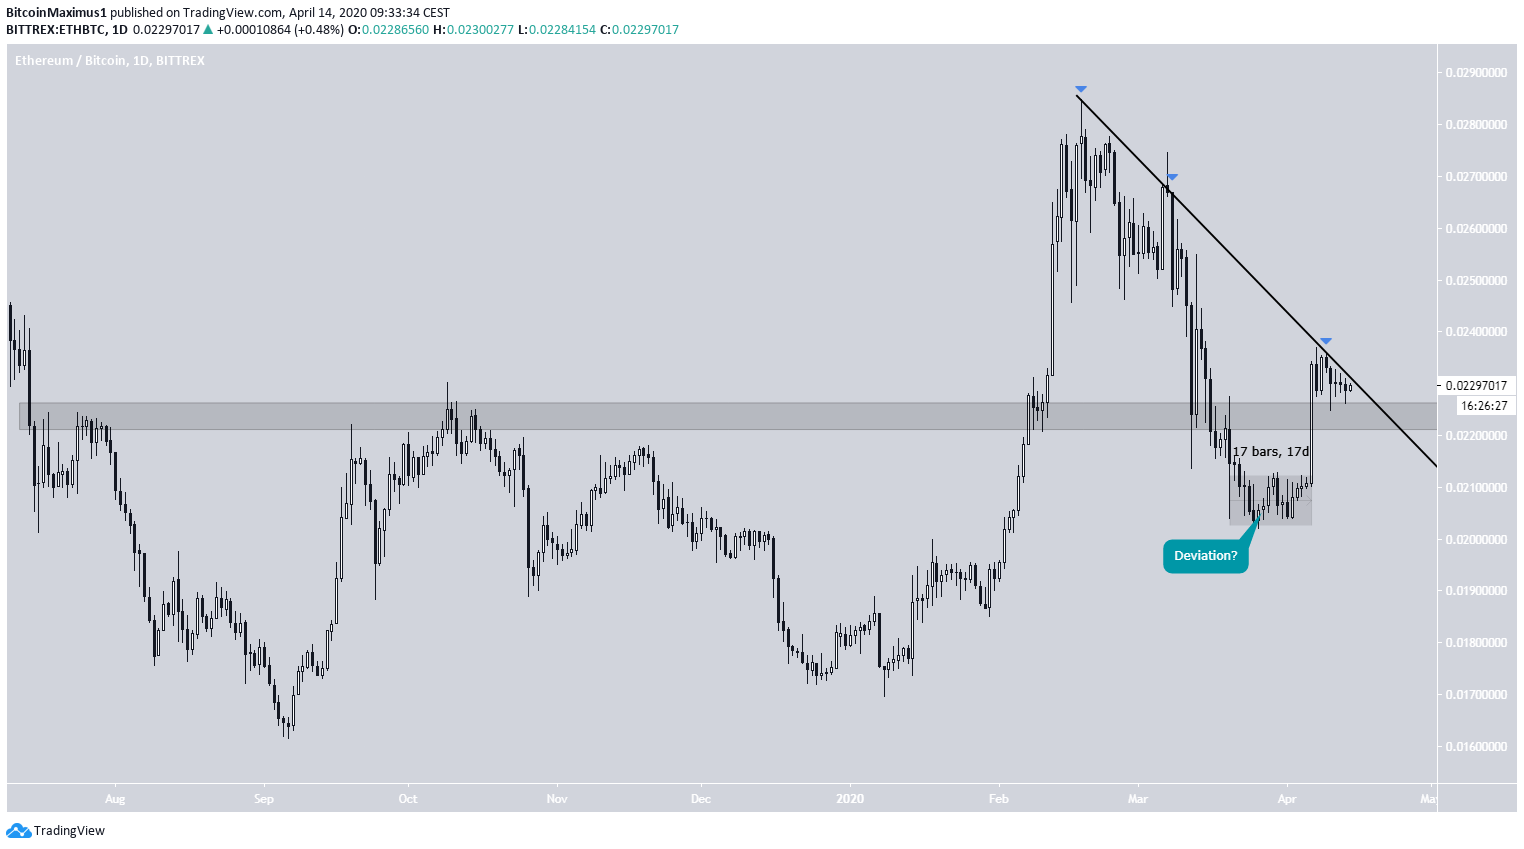
When looking closer at the Ethereum price, we can see that it has reclaimed a very significant area as support at ₿0.0225. This area acted as a zone of resistance between August 2018-February 2020. After breaking out, the price reached a high of ₿0.0284 before beginning the still ongoing downward move.
Anyone else expecting another leg up for #ETHBTC soon? pic.twitter.com/hG4tctCX13
— Posty (@PostyXBT) April 14, 2020
Since the price has reclaimed this area, it allows for the possibility that the movement in the end of March and the beginning of April was just a deviation, and the price will continue moving upwards. In order to verify this possibility, it has to break out above the current descending resistance line that it has previously validated three times.
The price has to make a decision soon about whether it will move above this descending resistance line or break down below the support.
The short-term chart supports a breakout. The price is trading inside a symmetrical triangle, which is a neutral pattern that normally leads to a continuation of the previous move.
A breakout that travels the entire height of the pattern would take the price to the resistance are at ₿0.0245, as outlined in the tweet.
TRON (TRX)
Full-time trader @BillGK_Crypto outlined a TRX chart and stated that the price has reclaimed an important level as support and is likely to move upwards soon.
The old saying goes..
TA: This line said
FA: This bloke said$TRX fits into the 'this line said' this time around.
Continues to consolidate above reclaimed level & has held relatively well so far relative to other major $alts during the recent $BTC volatility. pic.twitter.com/274Xg3P5G4
— BillGK (@TraderBGK) April 14, 2020
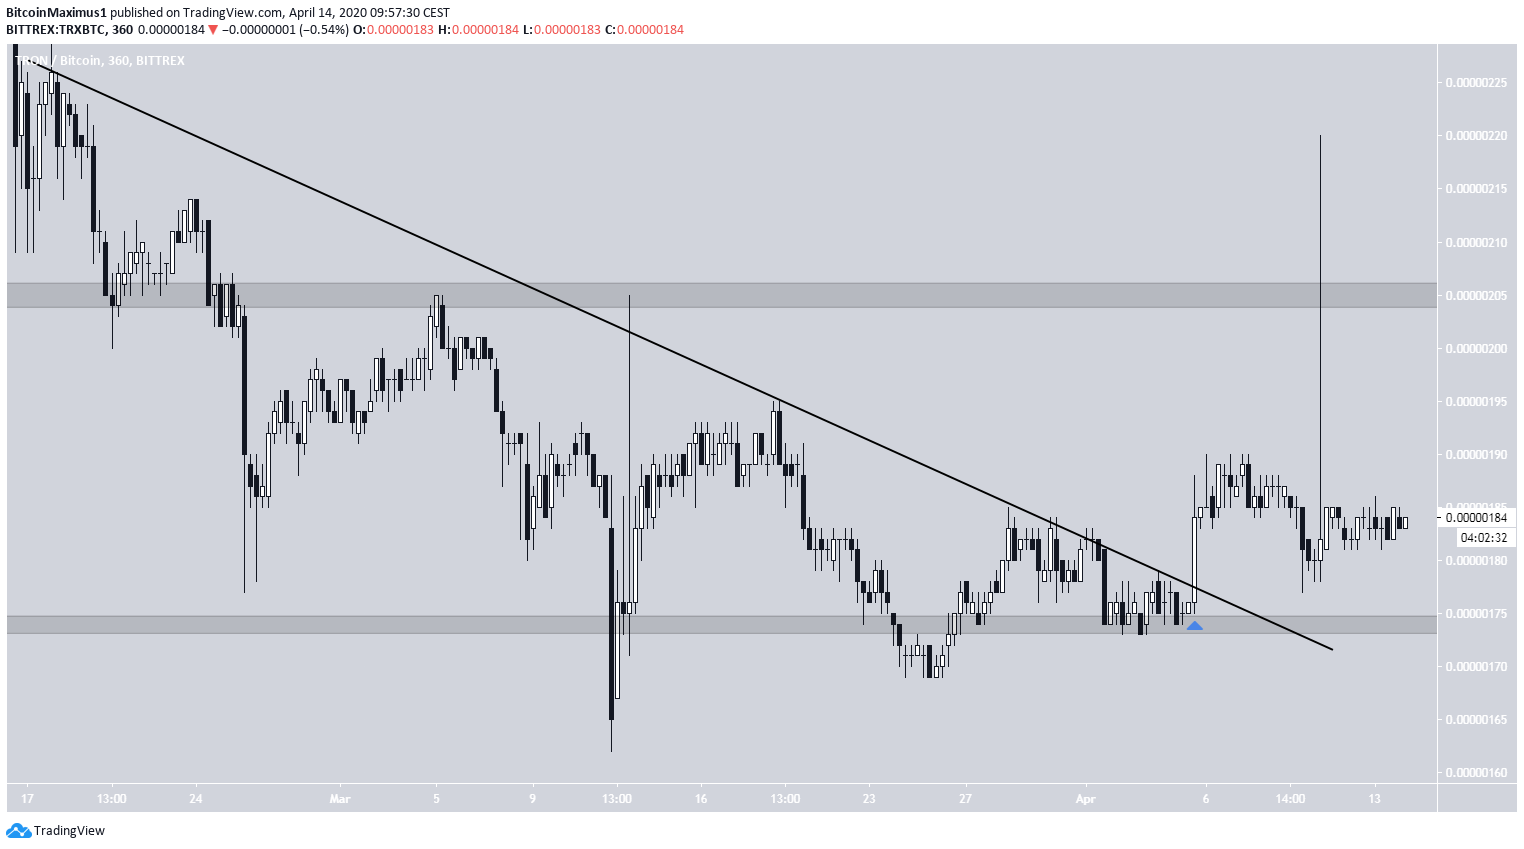
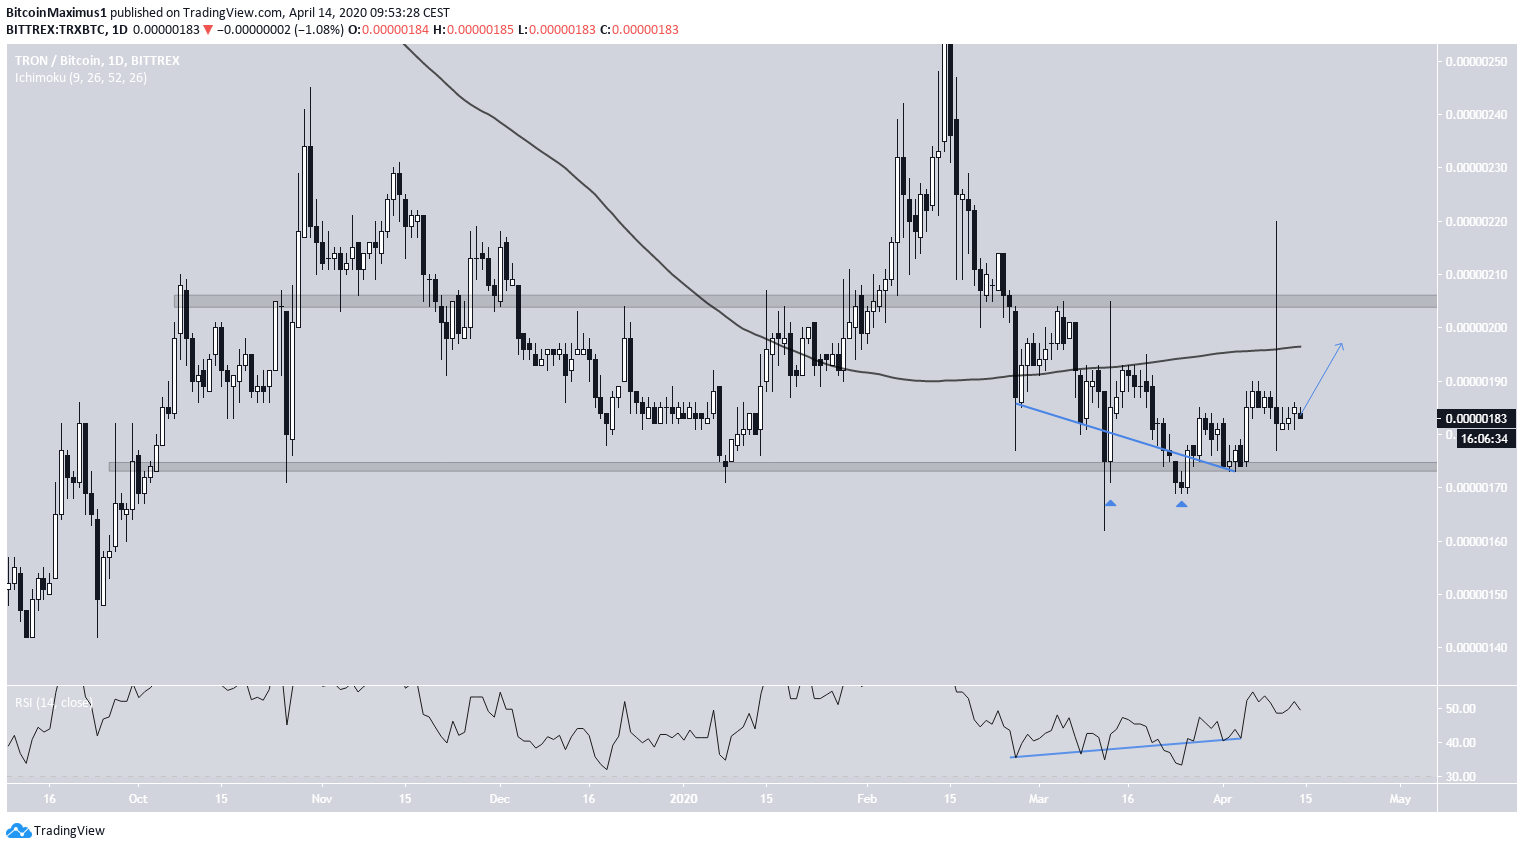
The TRX price has been trading in a range between 175 and 205 satoshis since October 2018. On March 25, the price briefly decreased below this support level, but immediately reclaimed it and validated it as support afterward. This is a bullish development that suggests that the price wants to move upwards.
Furthermore, the daily RSI has generated significant bullish divergence, which preceded the upward movement. The price is expected to move towards the resistance area of 205 satoshis, or at least the 200-day moving average (MA) at 195 satoshis.
The possibility of this upward move is supported by the short-term chart which shows that TRX has already broken out above a descending resistance line.
As long as the price stays above 175 satoshis, it is expected to continue moving upwards.