The Cosmos (ATOM) price reached a new all-time high on Aug 23. The upward trend has yet to show any weakness.
The Solana (SOL) price reached a new all-time high on Aug 13 and has broken out over a short-term descending resistance line.
Cosmos (ATOM)
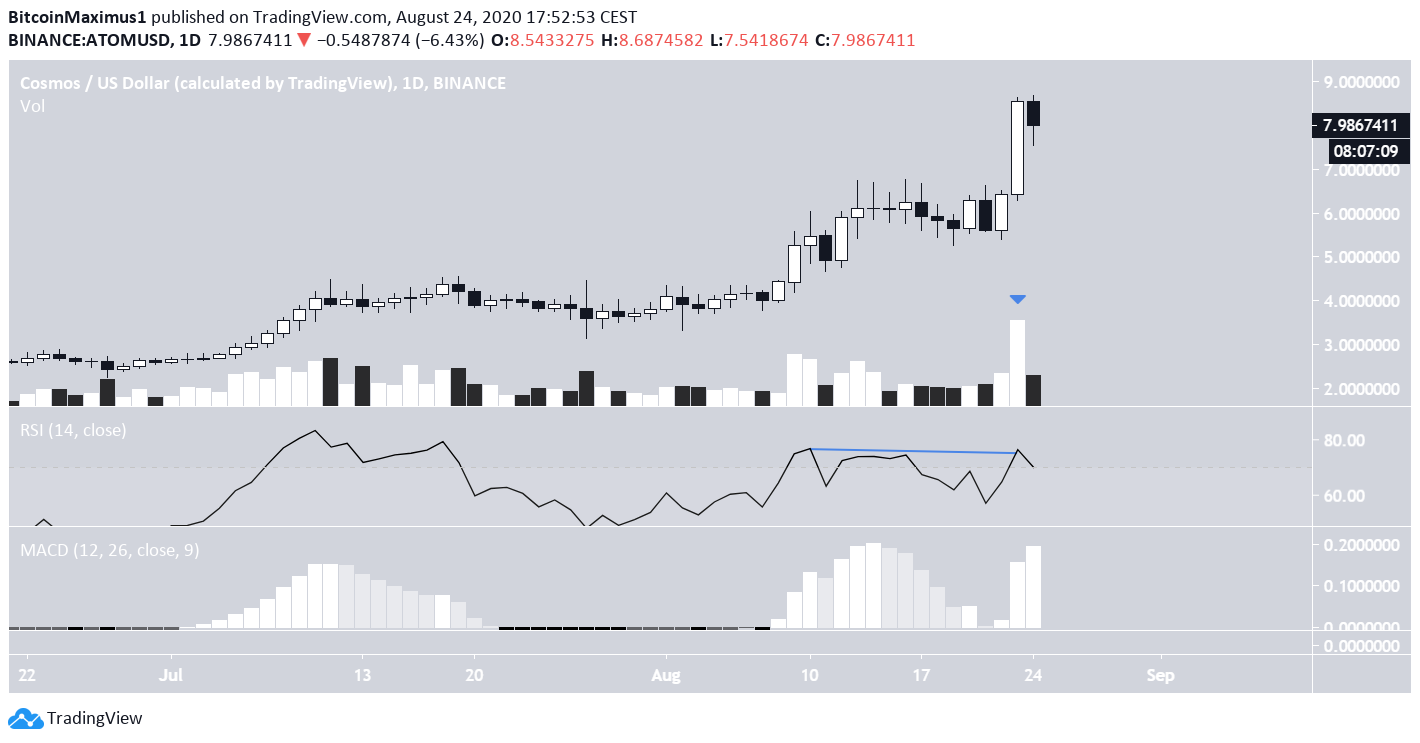
On Aug 23, ATOM created a bullish engulfing candlestick and reached a new all-time high of $8.58. The increase transpired with the highest daily volume ever recorded for the coin.
While there is some bearish divergence in the RSI, it is not very pronounced, and there is none showing in the MACD.
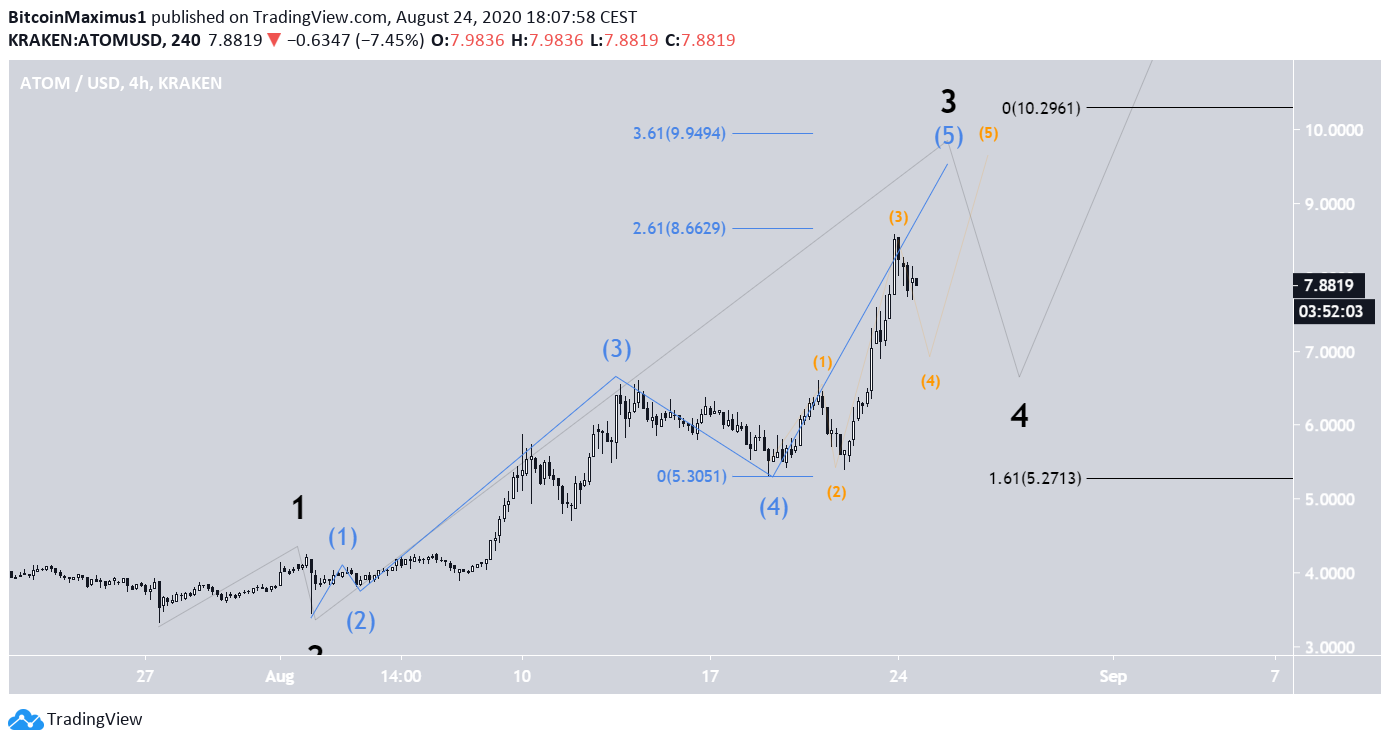
Beginning with a low of $3.31 on July 27, the ATOM price has likely initiated a five-wave formation (black in the chart below). The price looks to be currently in the third wave.
We can also outline a five sub-wave formation (blue) inside that third wave, that suggests the price is nearing a top.
While the price has already reached a significant Fib level, the next is near $10. This target was found by outlining the 3.61 Fib level of sub-wave 4.
However, since the price is at an all-time high, we cannot state with certainty where the current movement will end until the four minor sub-waves (orange) end and the fifth begins.
Cryptocurrency trader @rookieXBT tweeted:
seeing $ATOM and $DOT go up makes me think $SOL is a 400 IQ play here
keeping an eye out
— RookieXBT 🧲 (@RookieXBT) August 23, 2020
Next, we will humor RookieXBT and take a look at the price outlook for SOL.
Solana (SOL)
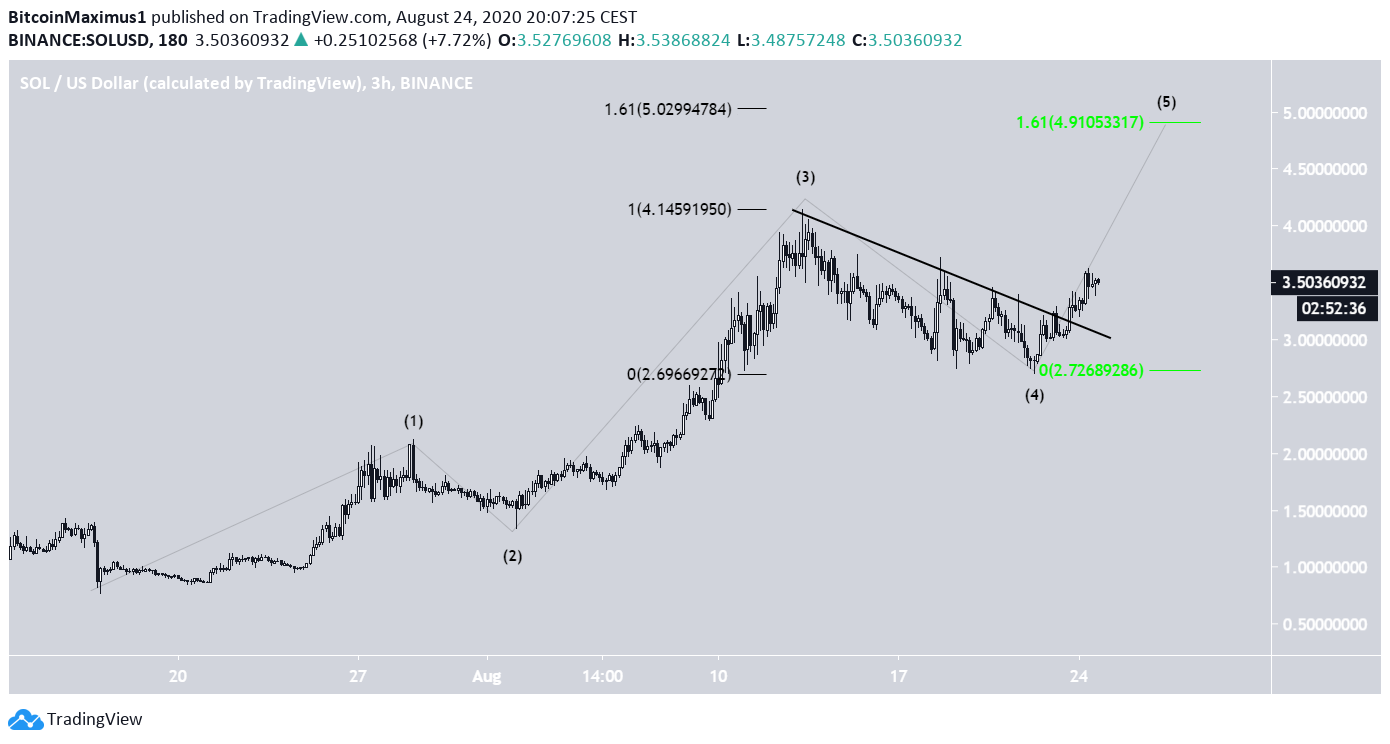
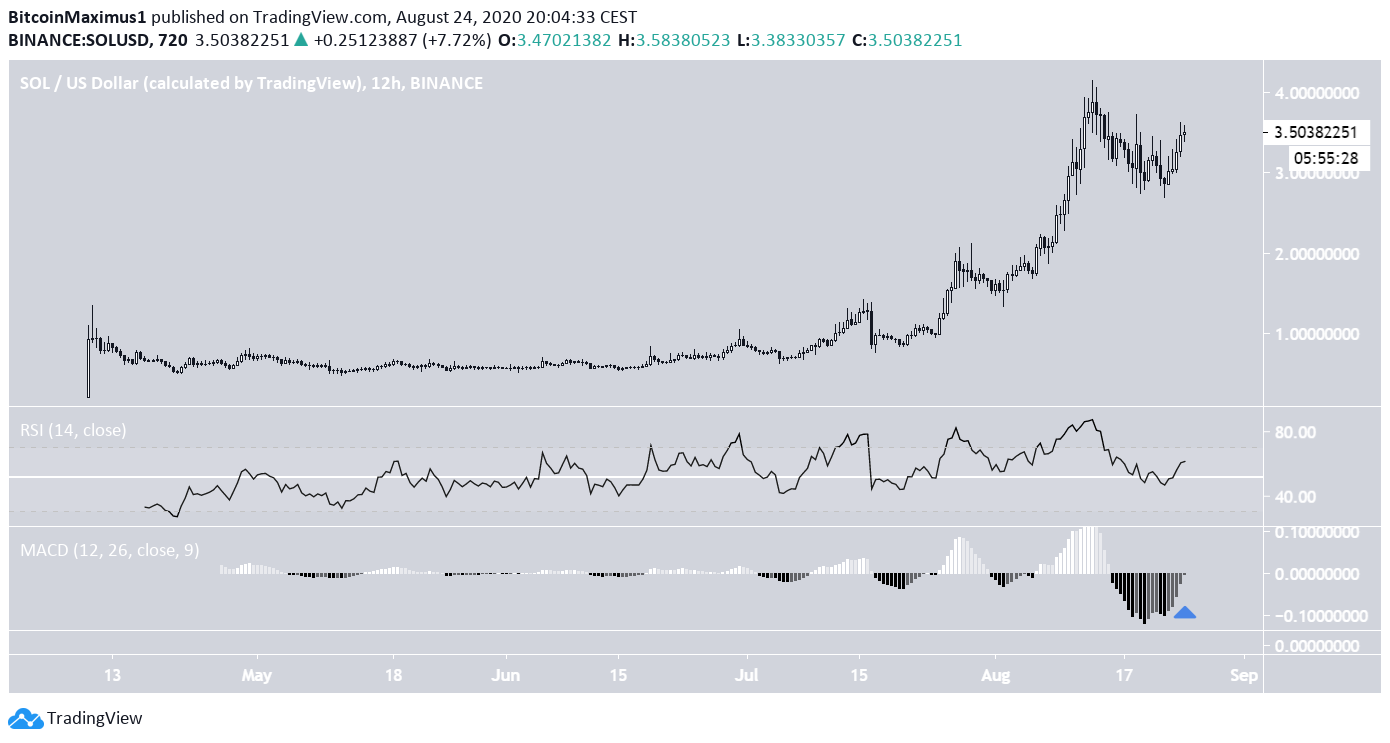
The SOL price reached an all-time high of $4.14 on Aug 13, ten days before that ATOM achieved its own. After a corrective period that ended at a low of $2.69, SOL resumed its upward movement, but still has yet to breach its Aug 13 highs.
Technical indicators are bullish. The RSI has bounced at the 50-line and the MACD has given a bullish reversal signal.
The movement since July 17 resembles a five-wave formation, and it looks as though SOL has already completed the fourth. The end of the wave was marked with a breakout from a short-term descending resistance line drawn from the Aug 13 highs.
Since the price is at an all-time high, we need to use Fib retracement levels in order to determine the most likely top of the next wave. The 1.61 Fib level of wave 1 and wave 4, is found at $5.02 and $4.91, respectively, so a high around these levels could be a possibility.