
Both ChainLink (LINK) and Monaco (MCO) are very close to reaching or have already reached a top. A period of correction is expected for both.
ChainLink was one of the biggest risers of the fall season, increasing by more than 150% since September. However, it reached a high in mid-November and has been correcting. On the other hand, MCO has yet to have its corrective period and has increased by 95% since the beginning of September.
Well-known trader @walter_wyckoff stated that out of all altcoin charts, LINK and MCO are the ones that seem most likely to increase.
Honestly searched all day for decent looking alts, except $LINK and $MCO there is nothing around.
If you found some decent alt shill it here, might chart it later if it's worth it👇👇👇
— Levi Alterman (@levi_alterman) December 11, 2019
Contrary to the tweet, we believe there are several altcoins with charts that suggest possible growth in the near future.
With that in mind, let’s analyze LINK and MCO and try to outline their future price movement.
ChainLink
After reaching a high of 36,650 satoshis on November 14, the LINK price began a retracement. It briefly fell below the 0.382 fib level at 28,000 satoshis before bouncing upward.
Whenever a significant support level is broken but the lower price cannot be sustained, it often means that the price will reverse and move higher. The LINK price created a bullish engulfing candlestick with significant volume on December 10, solidifying the strength of the current movement.
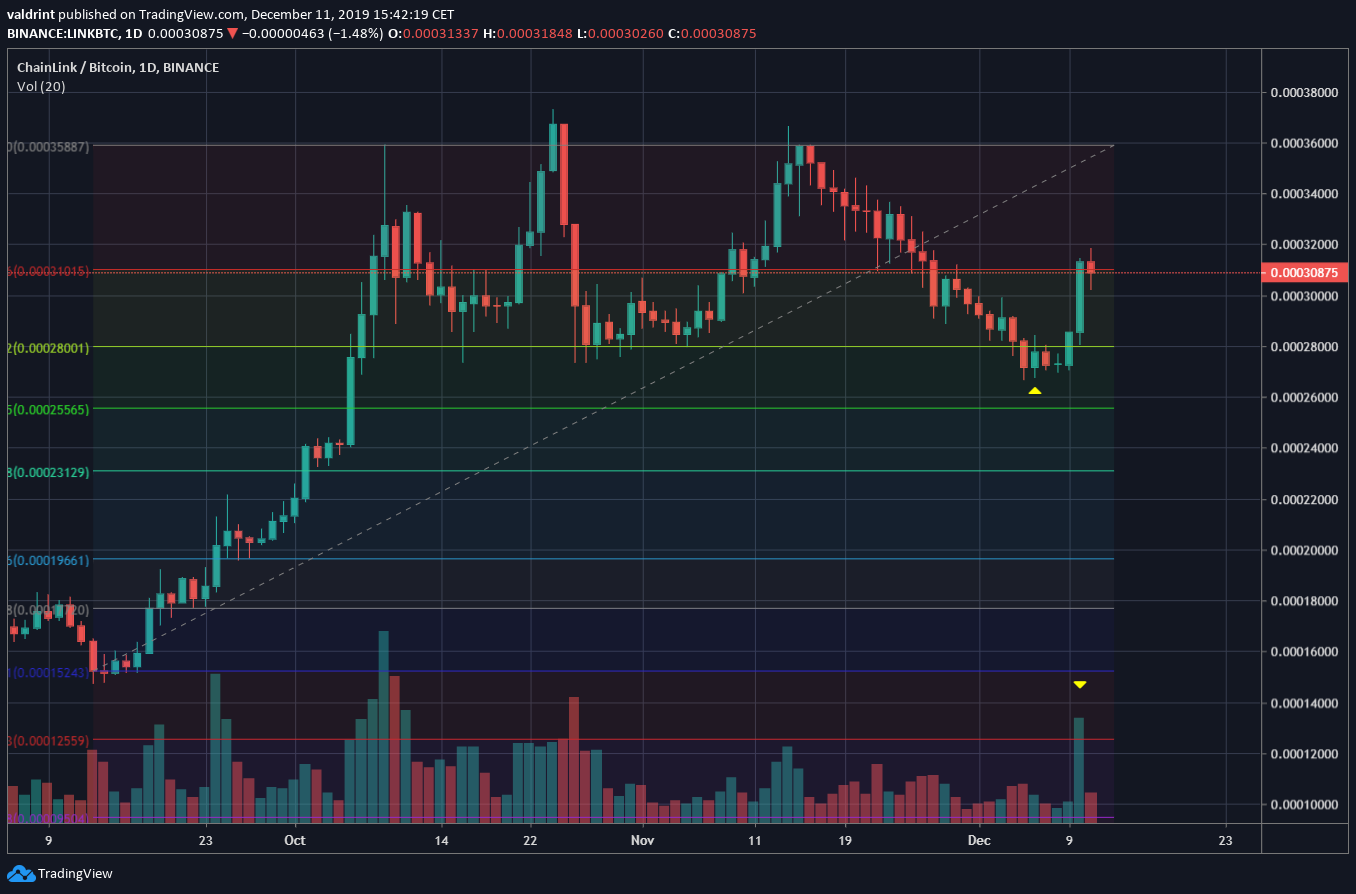
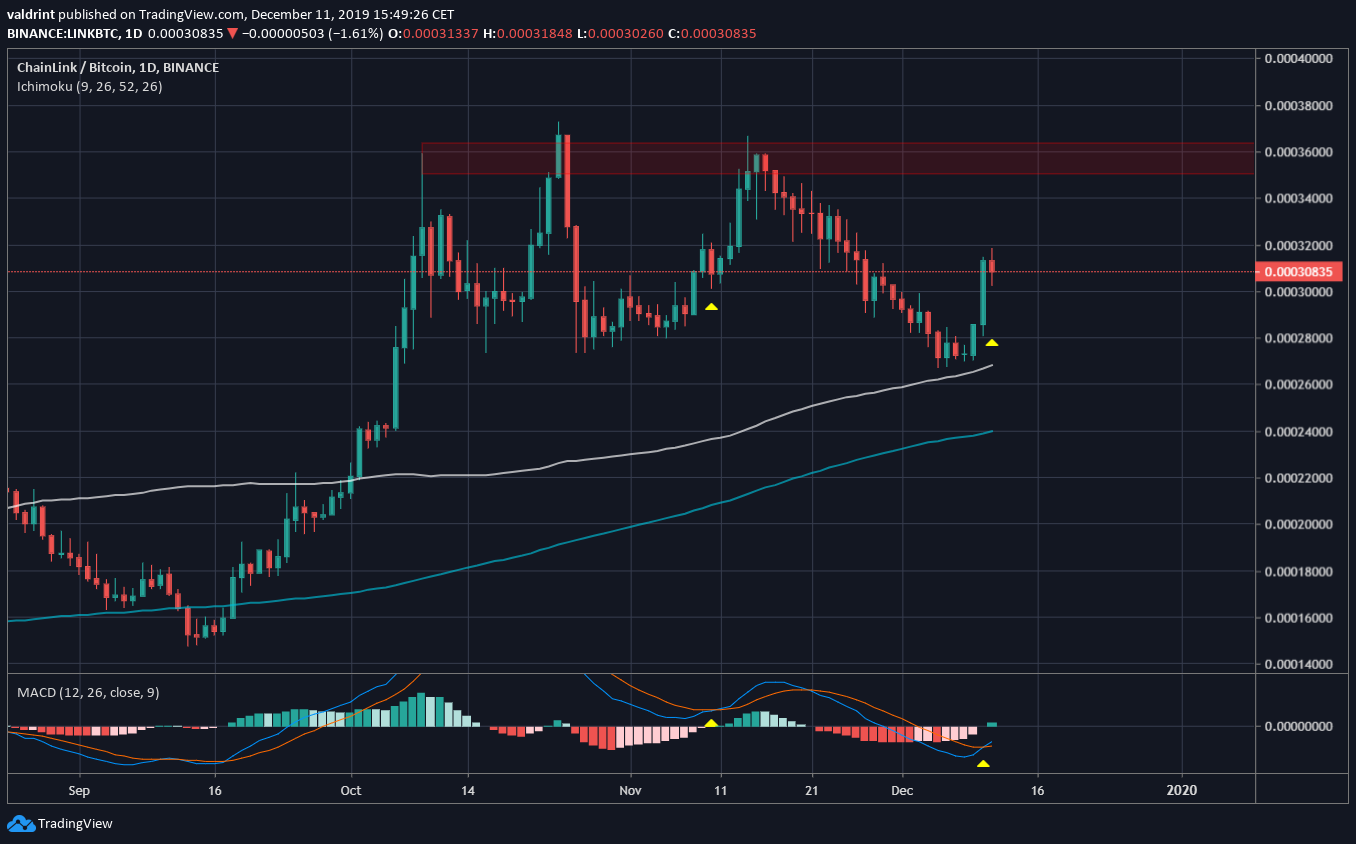
Additionally, this support area coincided with the 100-day moving average (MA). The price is trading above both the 100- and the 200-day MAs.
Additionally, a bullish cross in the MACD has just transpired. The previous time this occurred, the price moved towards the 36,000 resistance area. It is possible that the price will act in a similar manner this time.
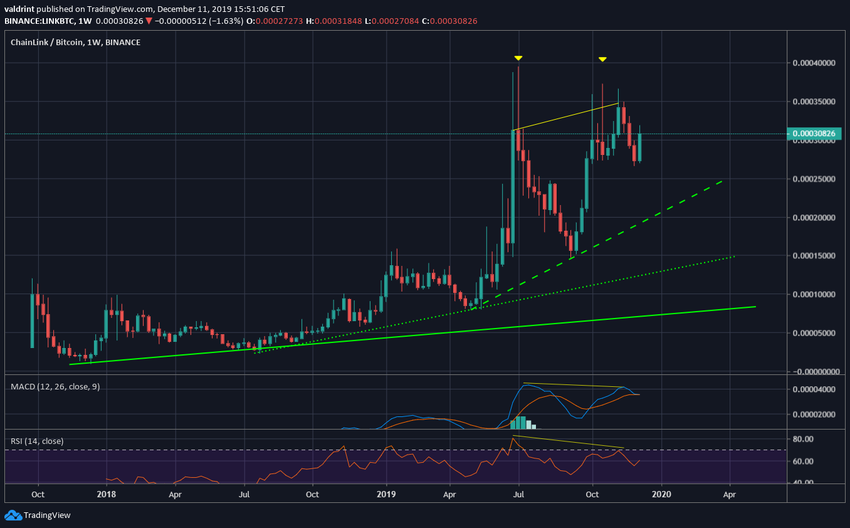
However, the weekly chart reveals that the possibility of a continued upward movement is slim.
The price has reached a double top near 36,000 satoshis, combined with a bearish divergence in both the RSI & MACD.
This suggests that the price will eventually decrease to one of the three ascending support lines outlined, depending on how significant the correction is.
MCO
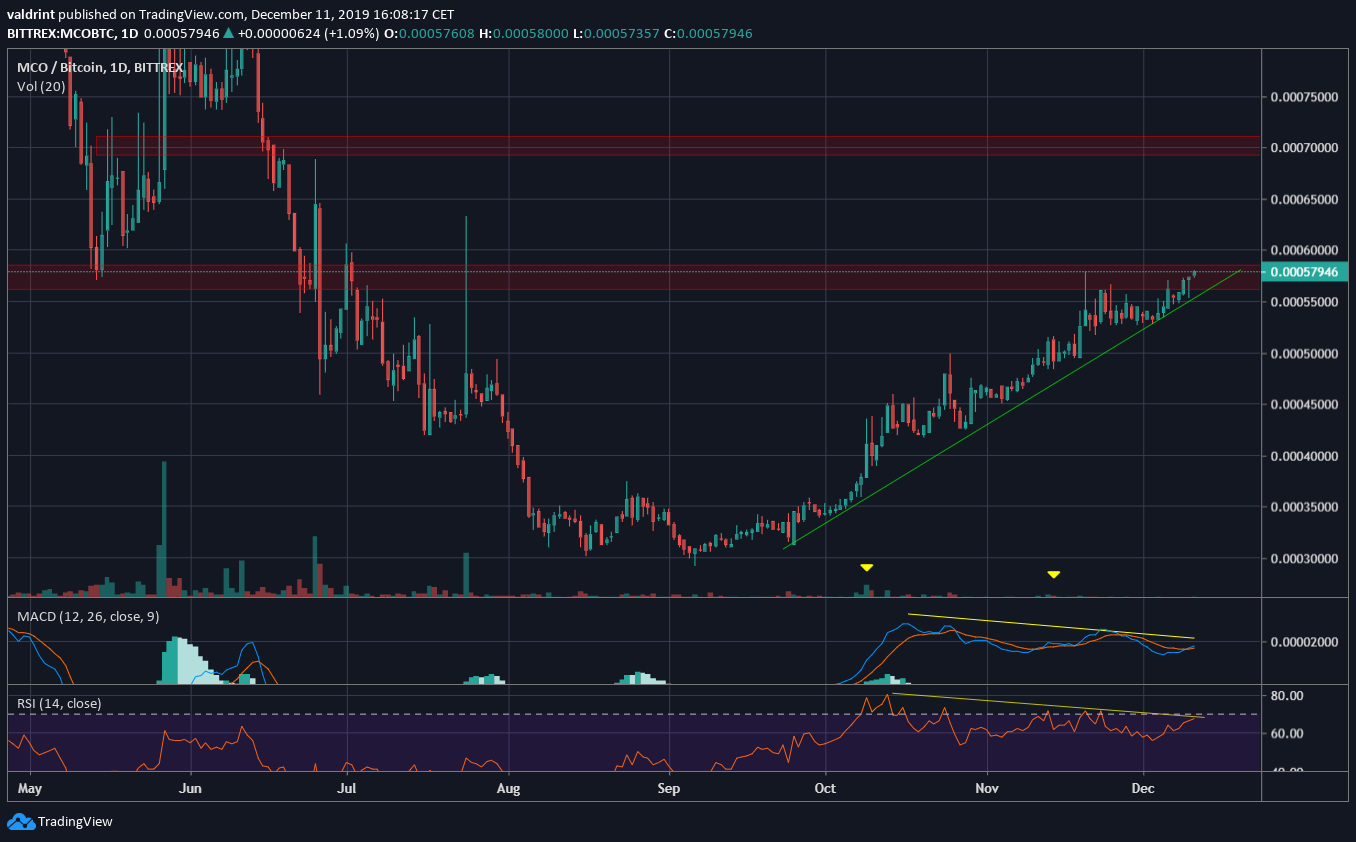
The MCO price reached a bottom of 31,224 satoshis on September 24 before beginning the current upward movement. At the time of writing, it was trading inside the resistance area at 58,000 satoshis.
It is following an extremely steep ascending support line that is bordering on being parabolic.
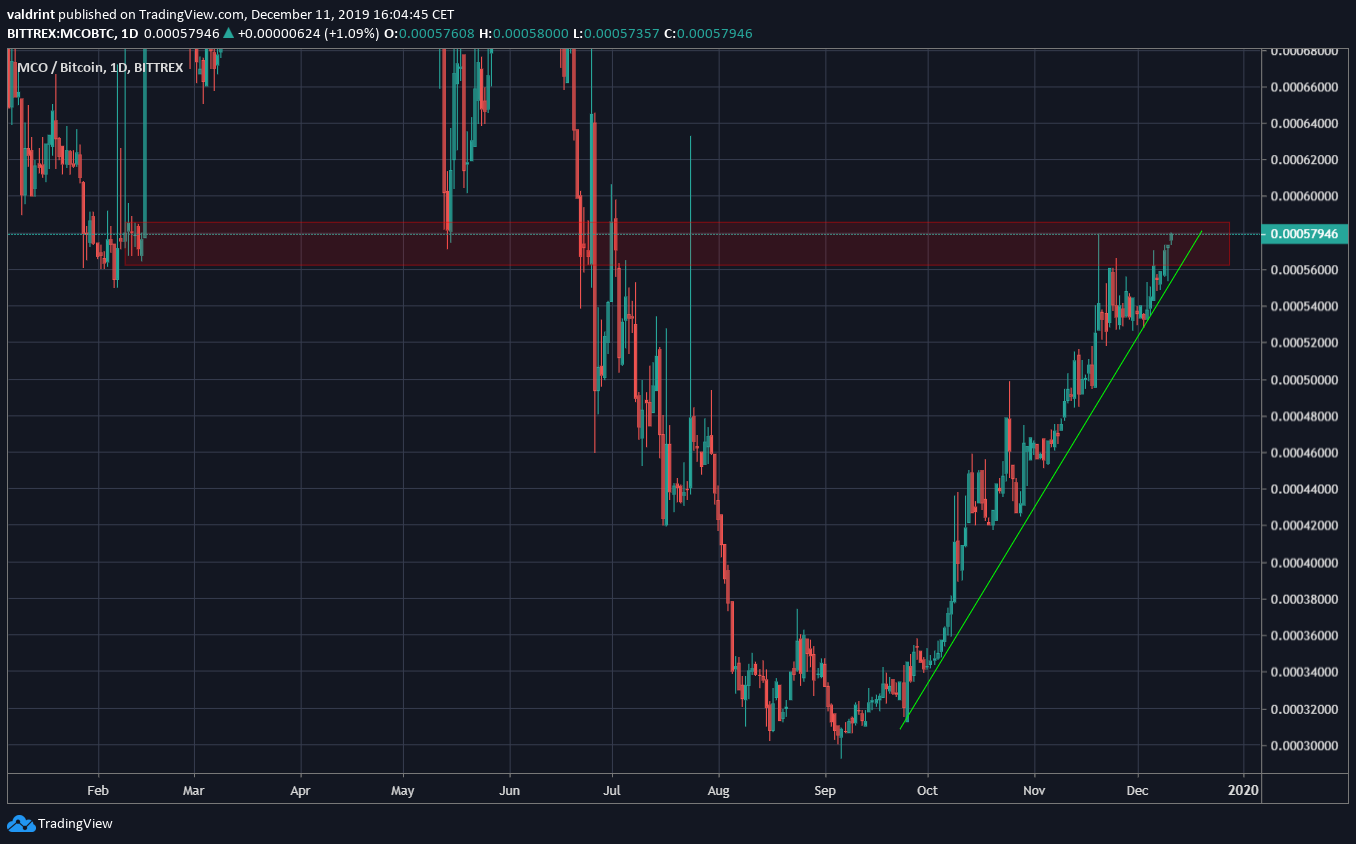
Technical indicators suggest the price will not break out. Rather, it has shown extreme signs of weakness.
Both the RSI and MACD have been generating bearish divergence for roughly two months and are very close to overbought levels. On top of that, the volume has been almost nonexistent throughout the entire upward move.
Illiquid coins such as these can be subject to rapid movements in either direction. Since the unusually steep ascending support line does not seem sustainable, a breakdown is expected.
While it is possible that the price moves upwards towards 70,000 satoshis, that seems extremely unlikely.
To conclude, the charts for neither LINK nor MCO seem to have bullish outlooks. However, while LINK may post short-term gains, MCO looks bearish in every time-frame.
Images are courtesy of Twitter, TradingView.
