
During the ongoing Bitcoin (BTC) rapid increase, many ALT/BTC pairs have fallen near their all-time lows. In this article, we will take a look at two of them, which have been showing some signs of a reversal.
Algorand (ALGO)
Well-known trader @BillGK_Crypto outlined an ALGO chart which shows that the price has fallen to its lowest levels since October 2019. He has outlined a movement in which the price sweeps the lows and then increases towards the middle of the range (EQ).
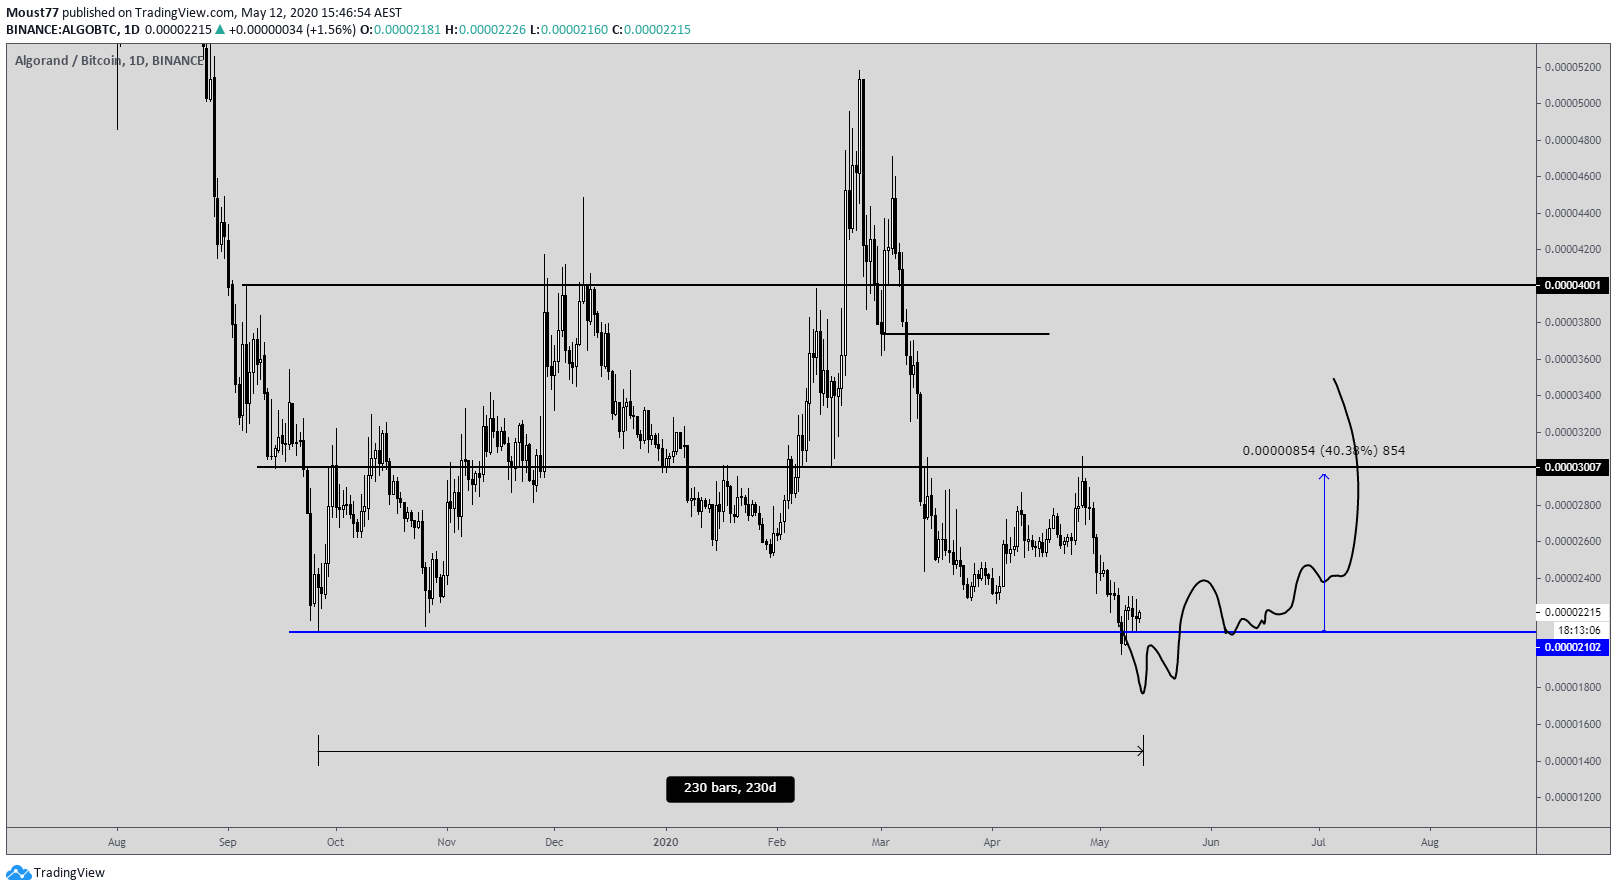
The price has indeed fallen below the range low, which is found at 2,250 satoshis and has even validated it as resistance afterwards.
In order for the move outlined in the tweet to transpire, ALGO has to quickly reclaim this lost support. Luckily, there are some signs that it might do so. First, the price is possibly creating a double bottom, which began with the bullish daily candlestick on May 9. As long as the price does not fall below it, the possibility of a reclaim is there.
Next, there is a very considerable bullish divergence developing in the RSI, which also suggests that ALGO might reclaim the range.
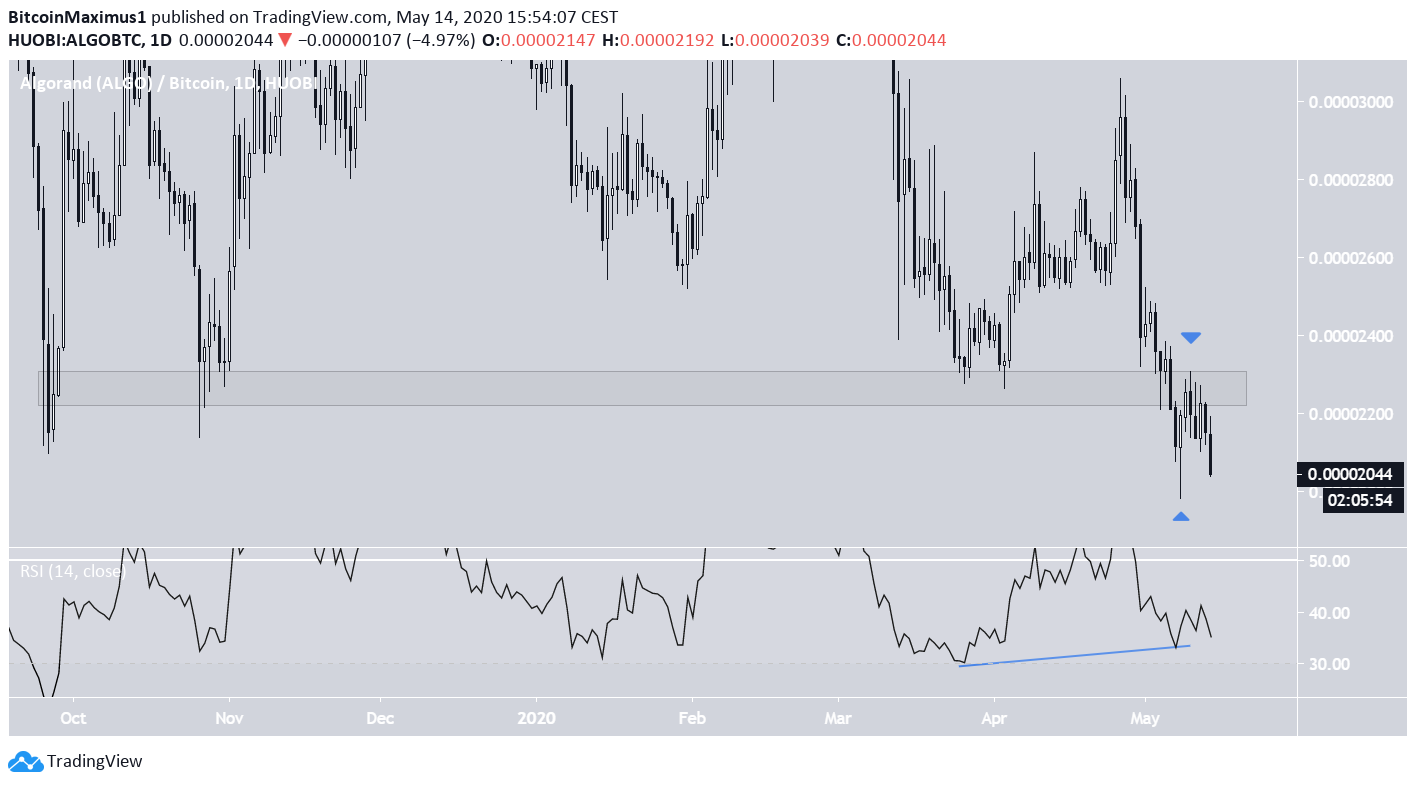
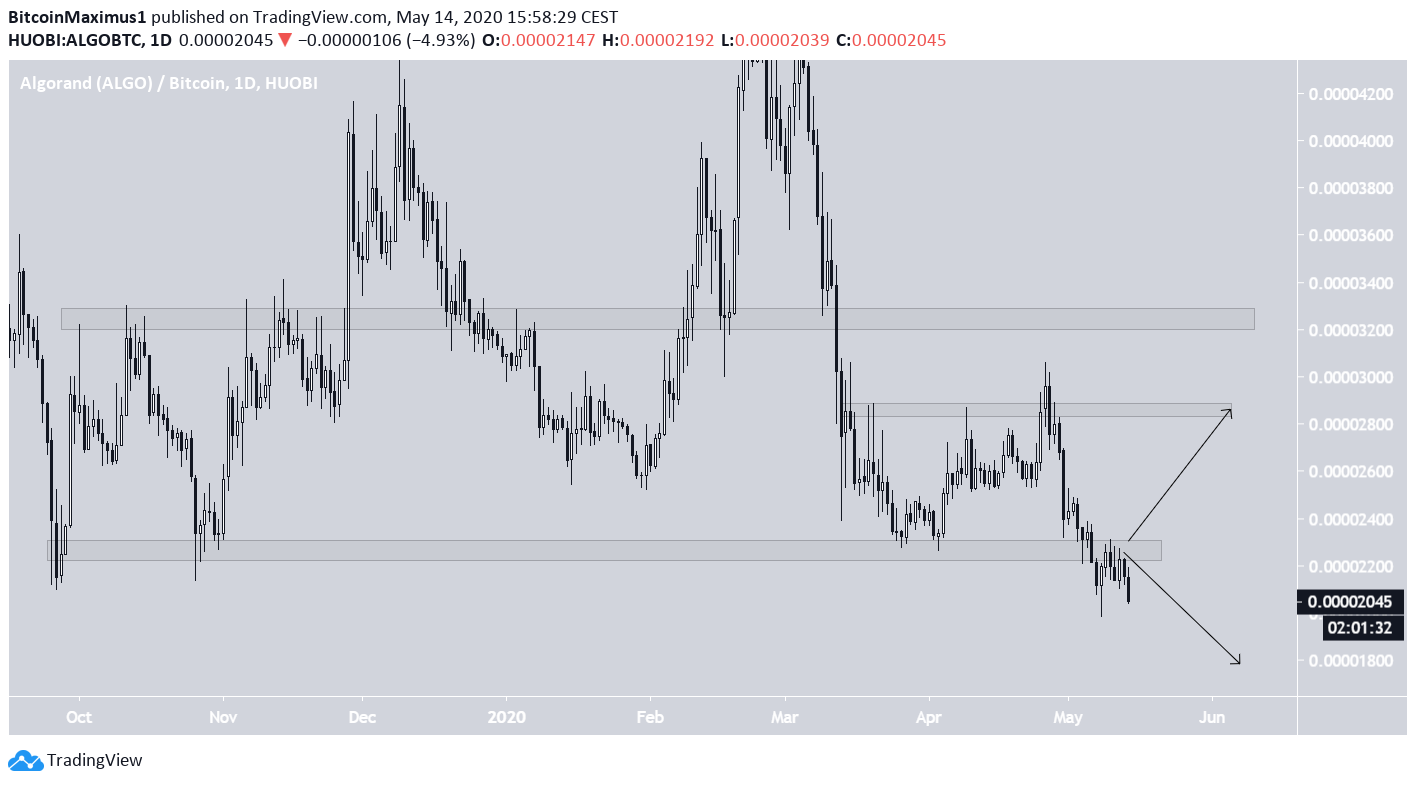
If it does, the closest levels of resistance would be found at 2,800 and 3,250 satoshis, respectively. However, if not, ALGO could fall into price discovery, since it is already trading very near an all-time low.
Nano (NANO)
Another coin that has fallen to its range lows is NANO. The weekly range low was shown by @FundamentalWolf, who simply outlined the lines in the weekly chart.
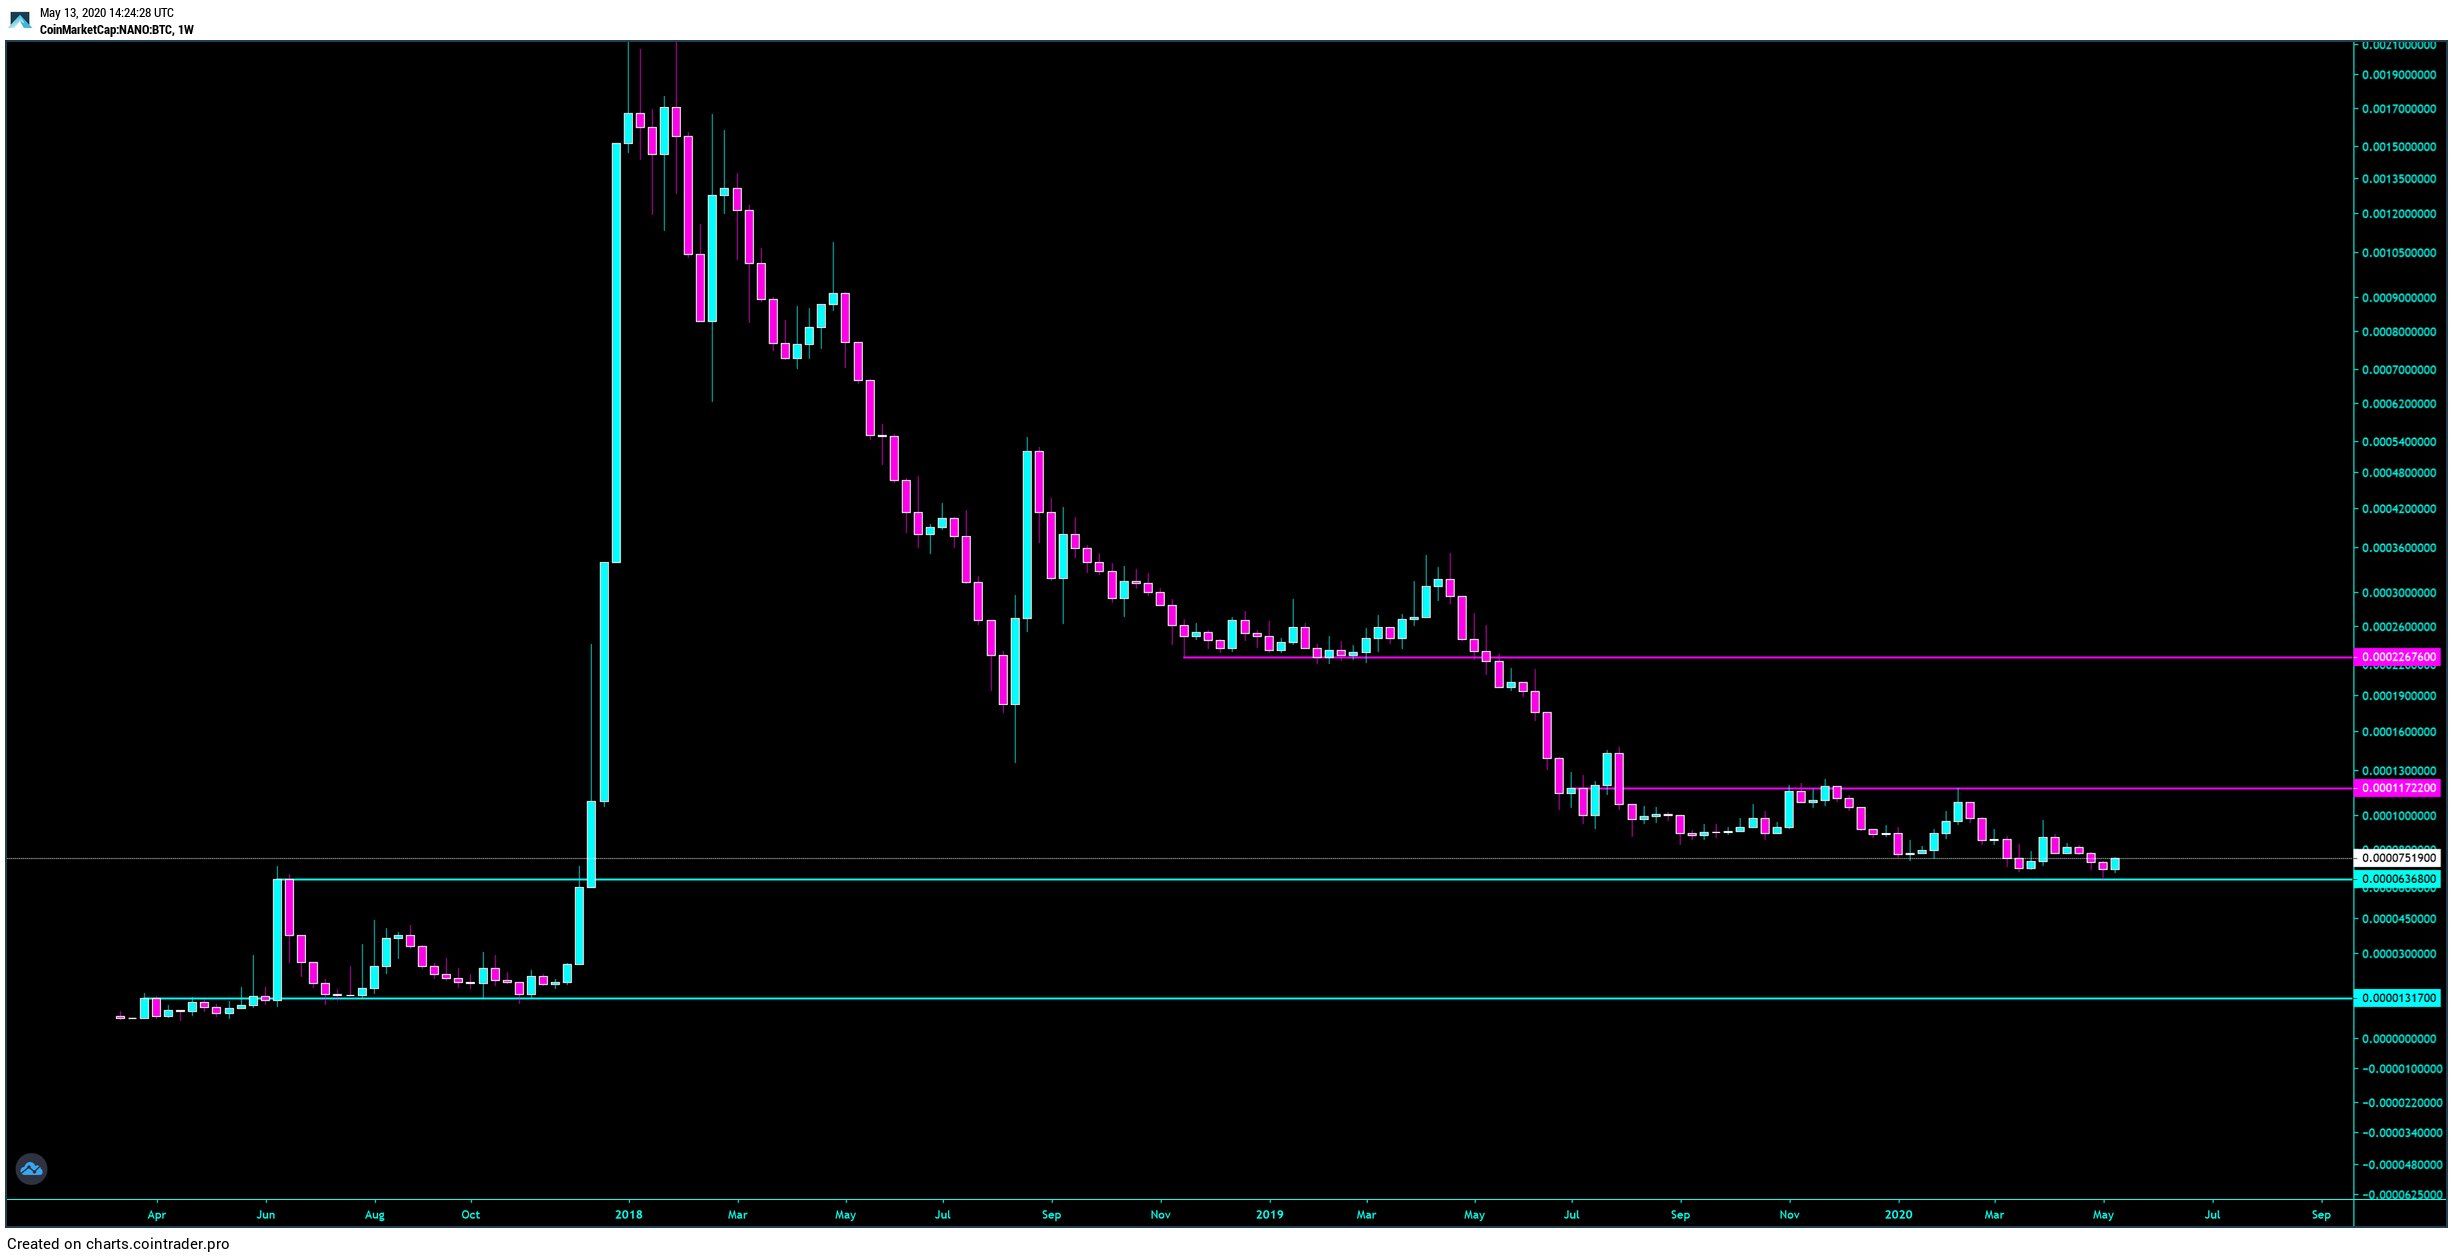
Unlike ALGO, the range for NANO is not completely clear. However, the price has been trading inside a massive descending channel since August 2019, currently being right at its support line.
However, there is considerable resistance above the current price, in the form of the EQ of the channel and the 200-day moving average (MA), which limits the potential for future increases.
On the other hand, there is bullish divergence developing in the RSI, so a move towards the EQ is likely.
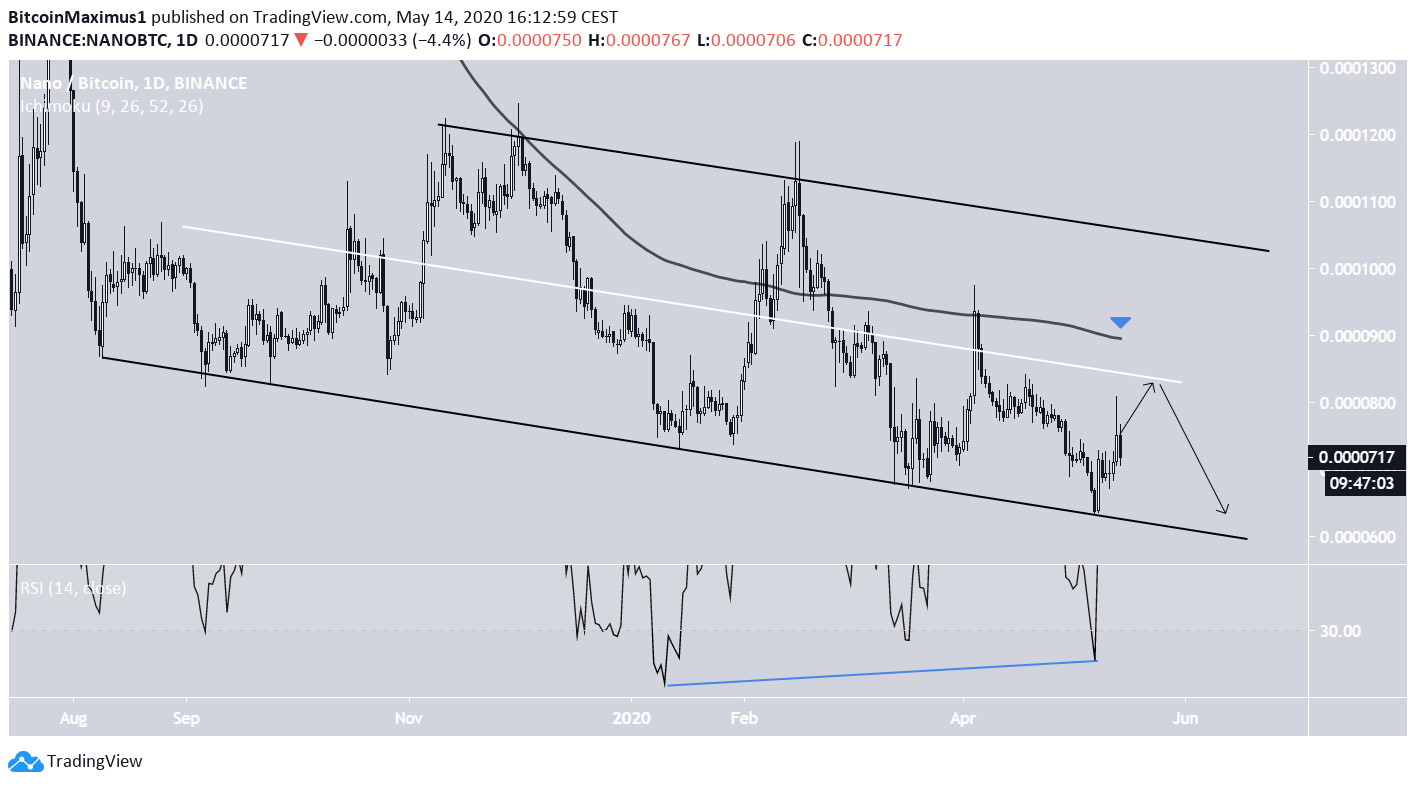
However, we cannot state with certainty whether the price will break out or not.
