Theta Token (THETA) has broken out above an important resistance level and validated it as support afterwards. RVN has yet to break out but is showing strong signs of a reversal.
Ravencoin (RVN)
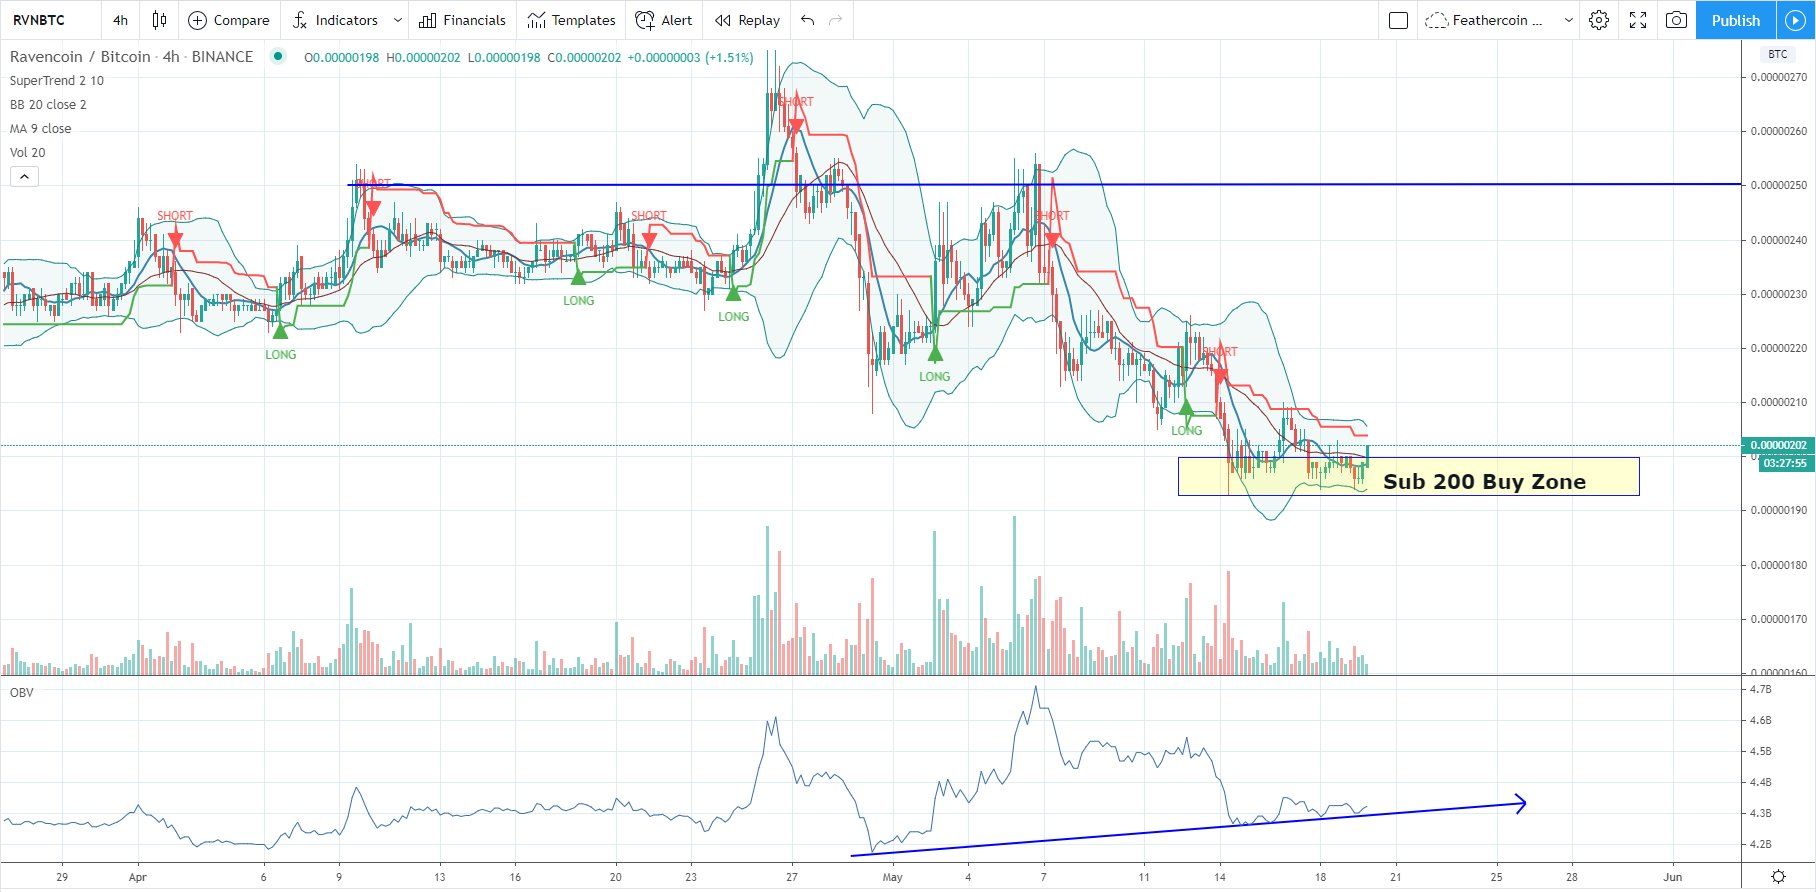
Cryptocurrency trader @IncomeSharks outlined an RVN chart in which the price is exiting his buy zone, which is found at 200 satoshis. As for the target for this movement, he has outlined the 250 satoshi resistance level.
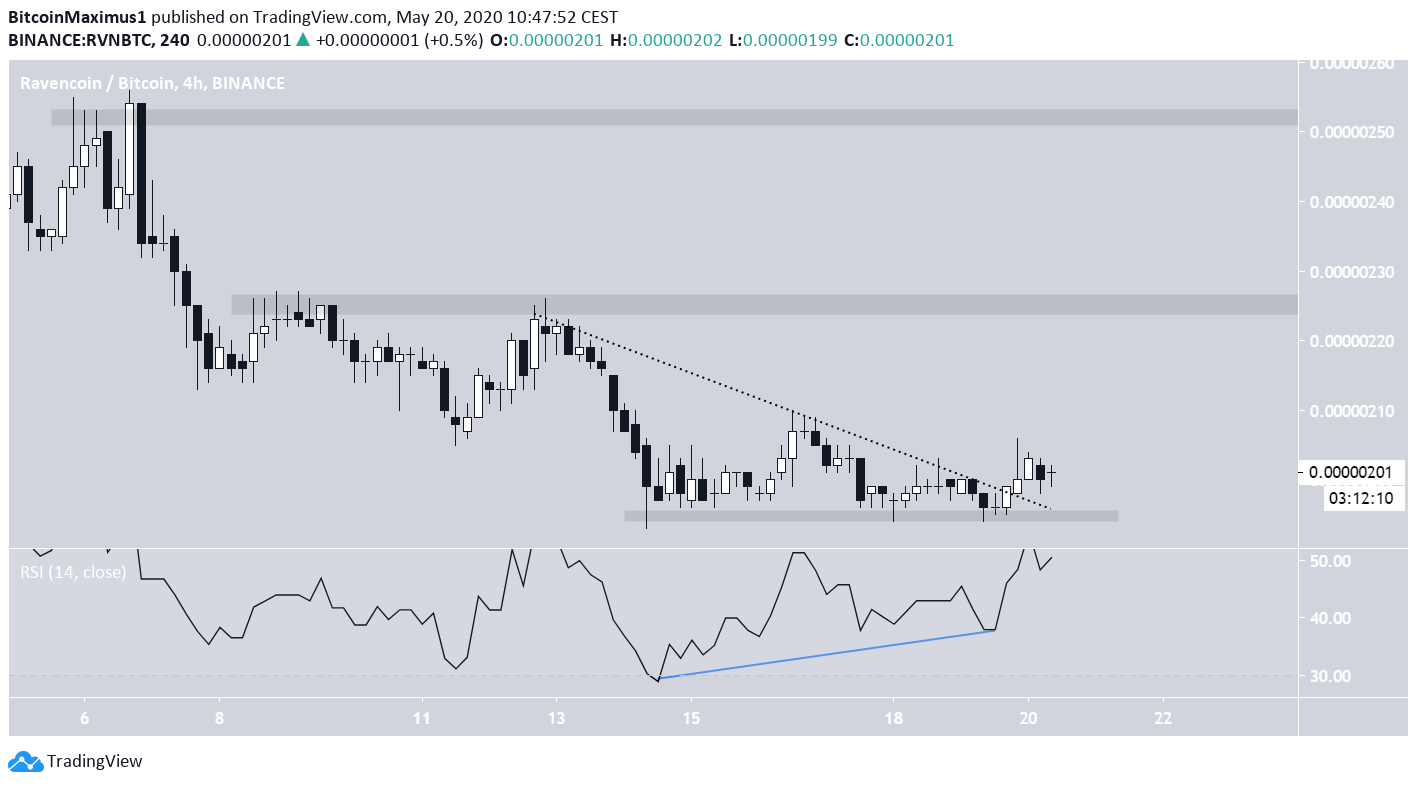
When looking closer at the price movement, we can see that RVN has already broken out from a descending resistance line that had been in place over the past week. This is a bullish sign that suggests that the price is likely to move upwards.
Furthermore, RVN has created a triple bottom which is combined with bullish divergence in the RSI. This is a sign that the price is likely to move upwards. The first resistance level is found at 225 satoshis, while the next one between 250-255 sats, as outlined in the tweet.
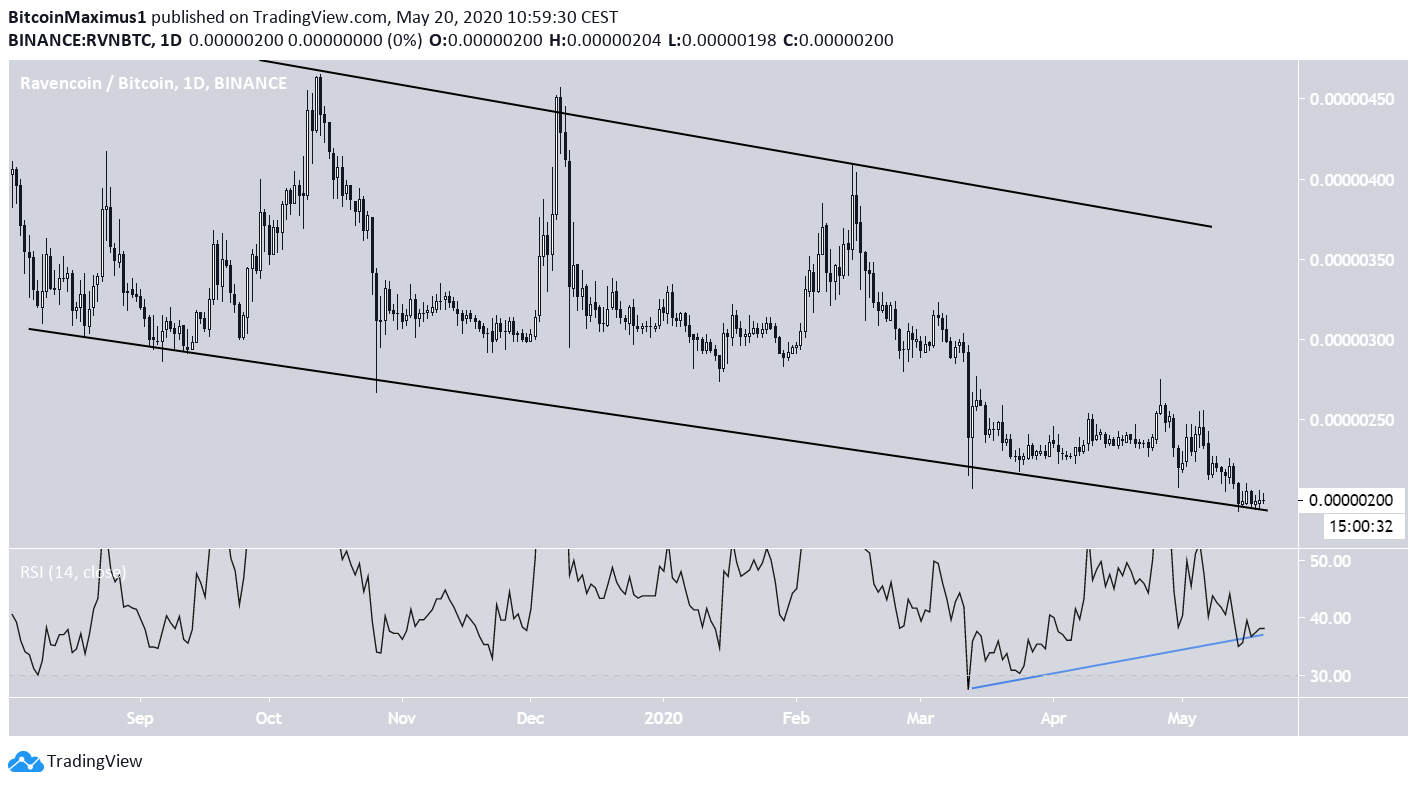
Higher time-frames also align with this projection. RVN has been following a descending support line since August 2019. Furthermore, there is a very strong bullish divergence even in the daily time-frame, indicative that the price is likely to move upwards.
The long-term resistance line is currently at 360 satoshis. While it is possible that the increase will take the price all the way to this area, the potential move would likely take several months to transpire.
Theta Token (THETA)
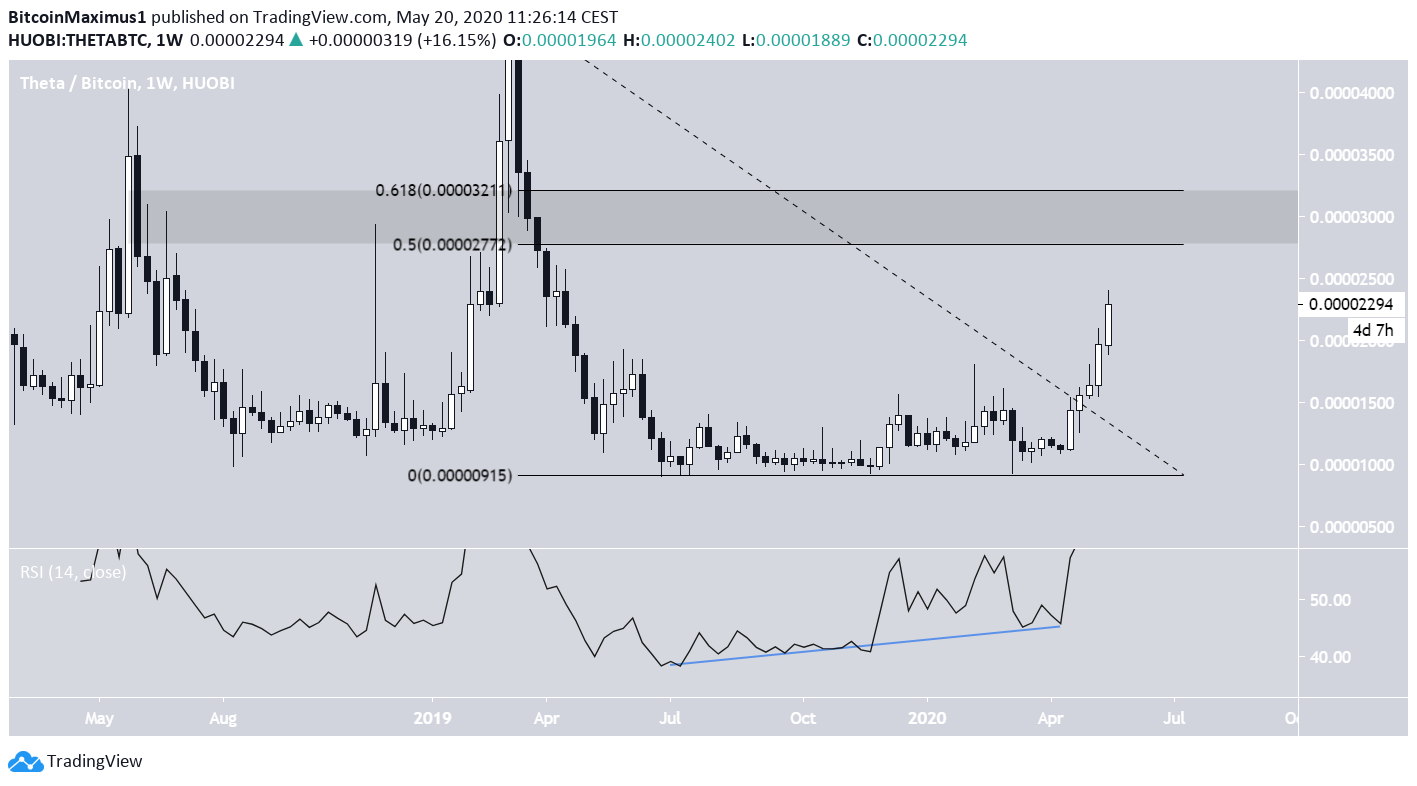
Another interesting coin to take a look at is THETA. However, it has already broken out and moved above the main resistance level. @CryptoMichNL believes that as long as the 1,800 current support level holds, the price is likely to make an attempt at 2,600 and eventually 3,000 satoshis.
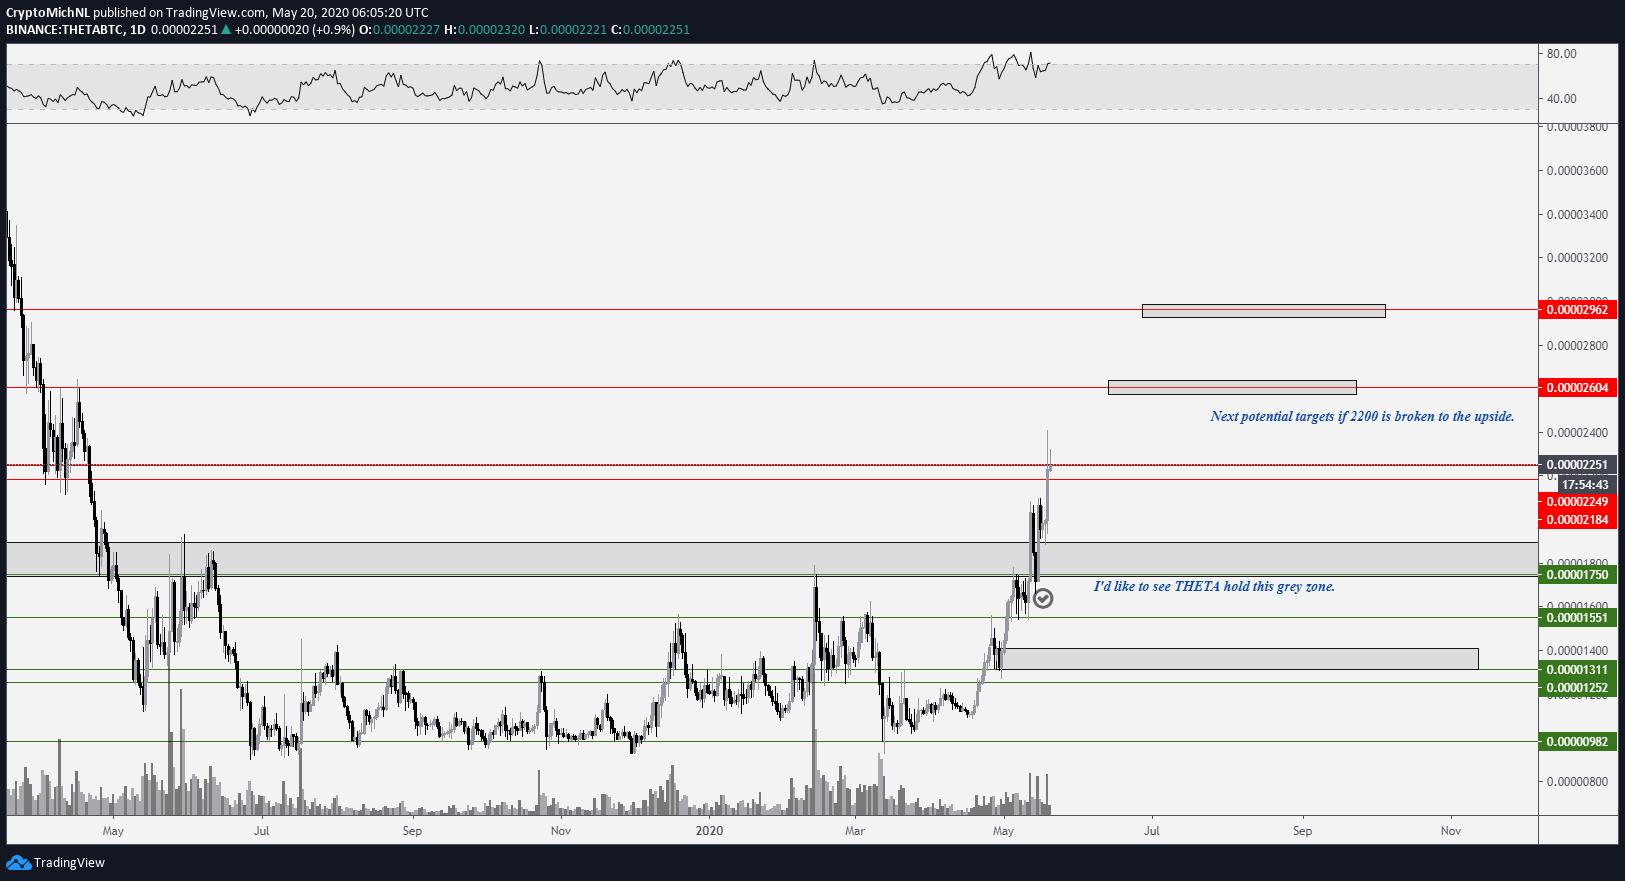
The aforementioned support level is found at 1,550 satoshis. The price has already broken out above it and validated it as support afterwards.
While the RSI has been generating bearish divergence, the price is in the process of creating a bullish engulfing candlestick, so its looks like the rally is not yet over.
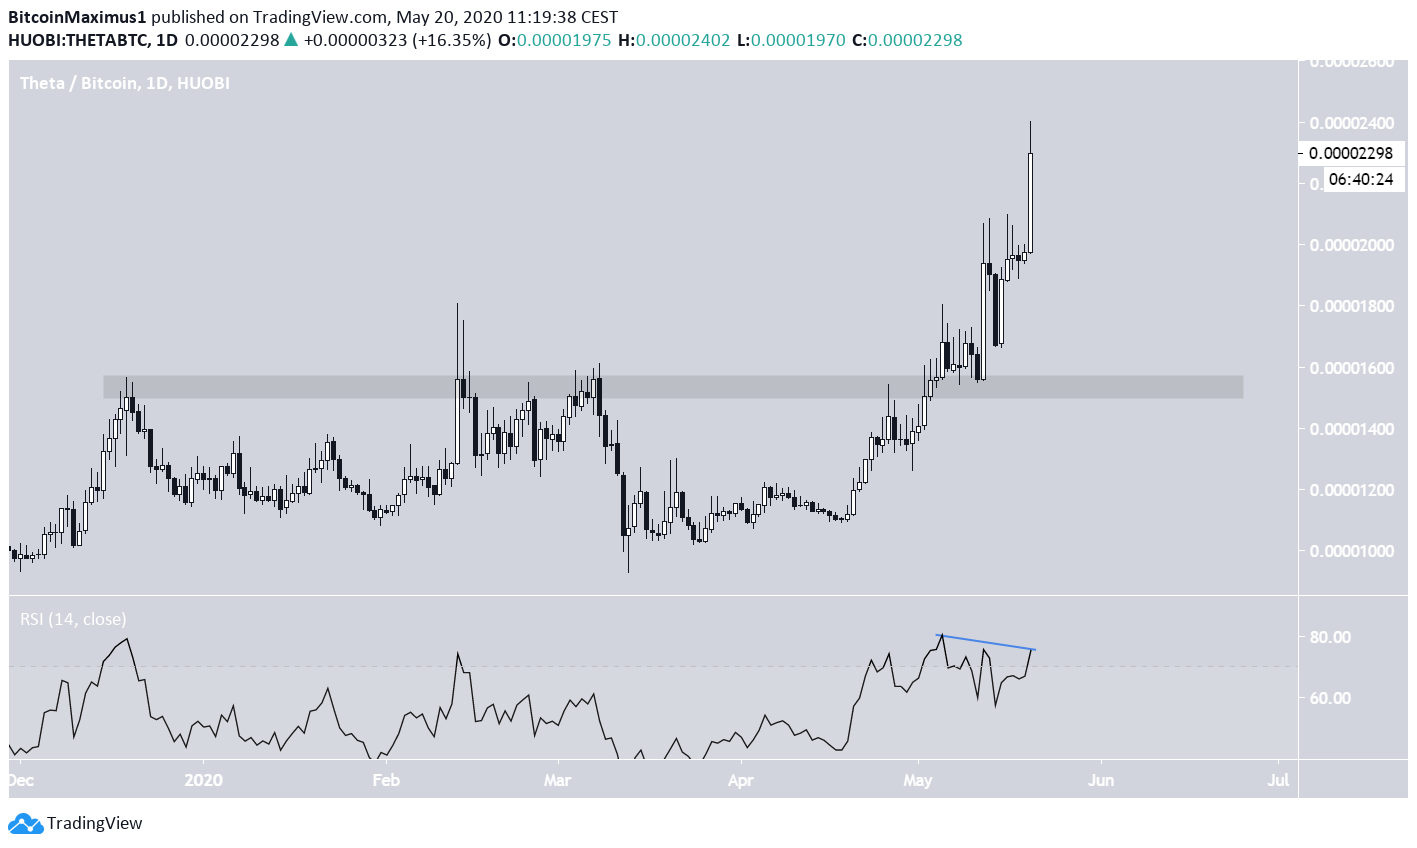
Similar to RVN, the long-term chart for THETA supports the continuation of this upward movement. Prior to the move being initiated, there was considerable bullish divergence in the weekly RSI, which is uncommon.
The most likely reversal level is found between the 0.5-0.618 Fib levels of the entire previous decrease, found at 2,700-3,200 satoshis.