


Be[In]Crypto takes a look at Bitcoin (BTC) on-chain indicators, specifically the Thermocap ratio.
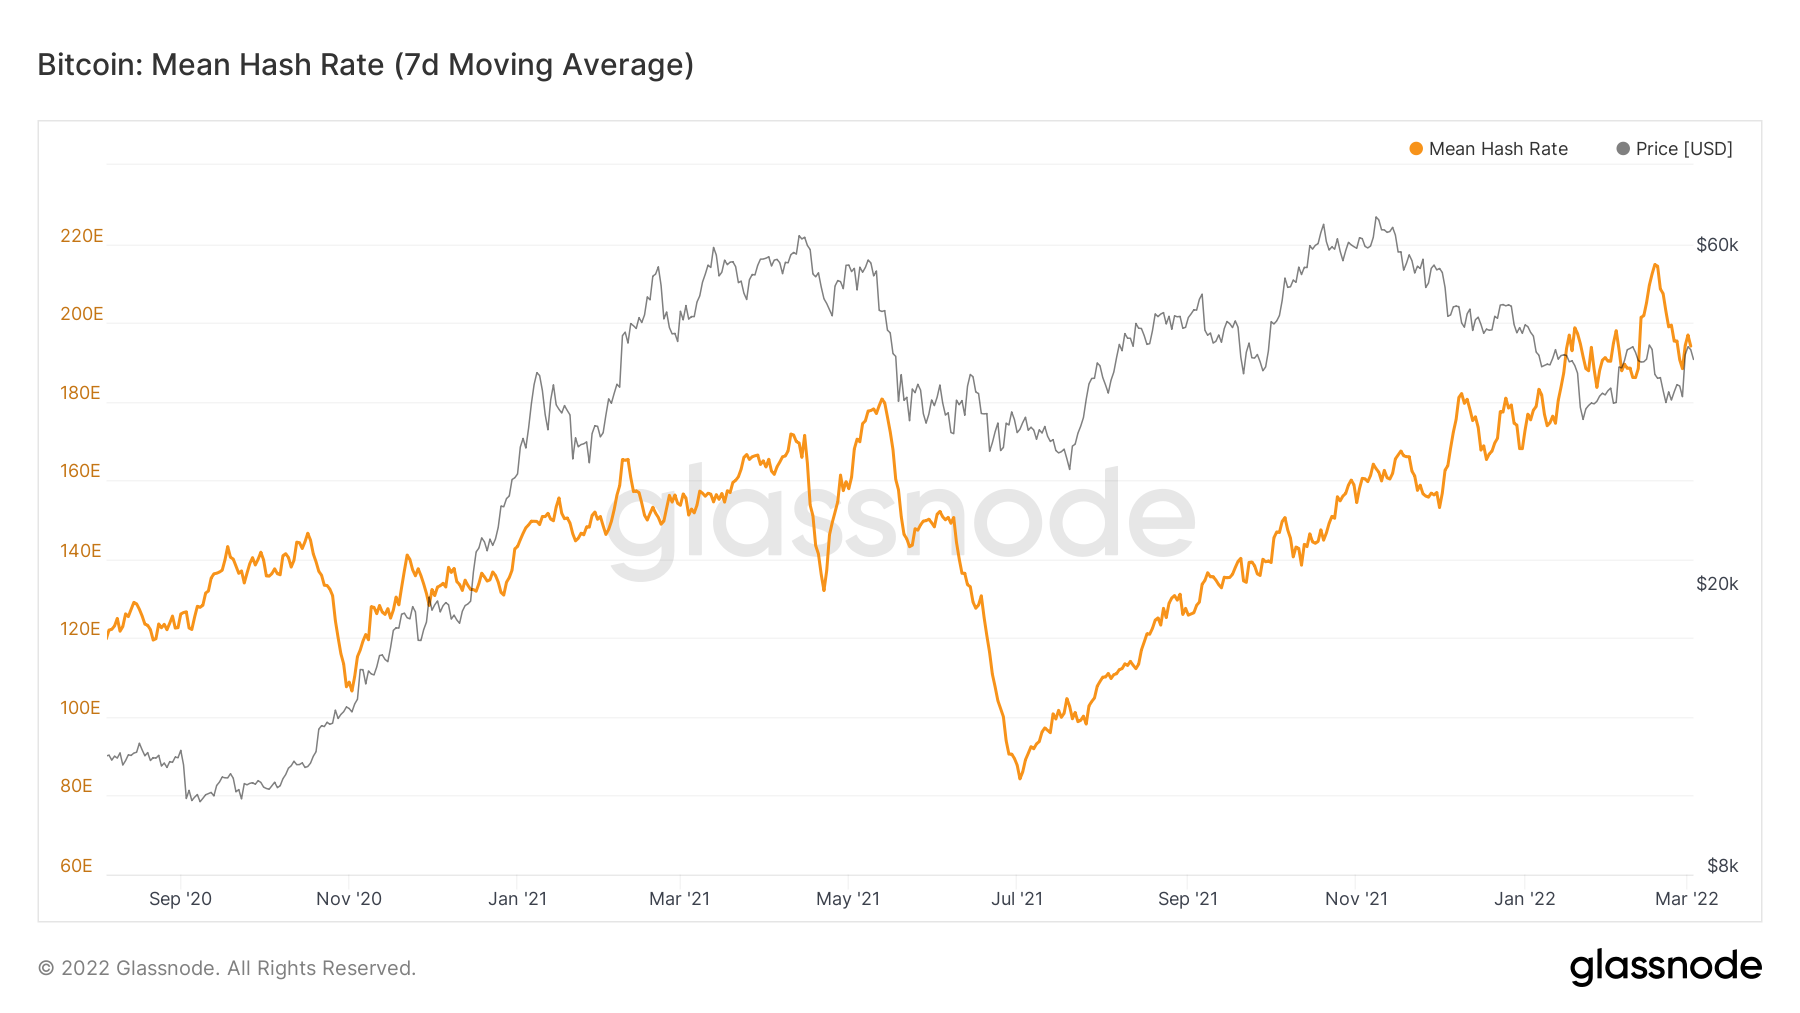
BTC hash rate
The BTC hash rate measures the computing power of the entire network, referring to the number of hashes produced per second by all miners on the network. The higher the hash rate, the more computing power is used to mine coins.
In mid-February, the Bitcoin’s hash rate reached a new ATH, trading at $43,980.
Market Cap to Thermocap Ratio
The market cap to Thermocap ratio is an on-chain valuation metric used to determine Bitcoin’s relative market value with respect to the aggregate security spend of miners. In other words, the ratio measures the aggregated amount of coins paid to miners, which speaks to whether BTC is trading at a premium or discount relative to the amount spent by miners. Historically, Bitcoin
The “Thermocap” is the all-time cumulative sum of revenue in USD that miners have generated to secure the Bitcoin Blockchain – calculated by taking the running sum of daily miner revenue in U.S. dollars.
Historically, values below 0.0000004 (highlighted in green) marked market cycle bottoms. Conversely, values above 0.000004 (highlighted in red) marked cycle tops.
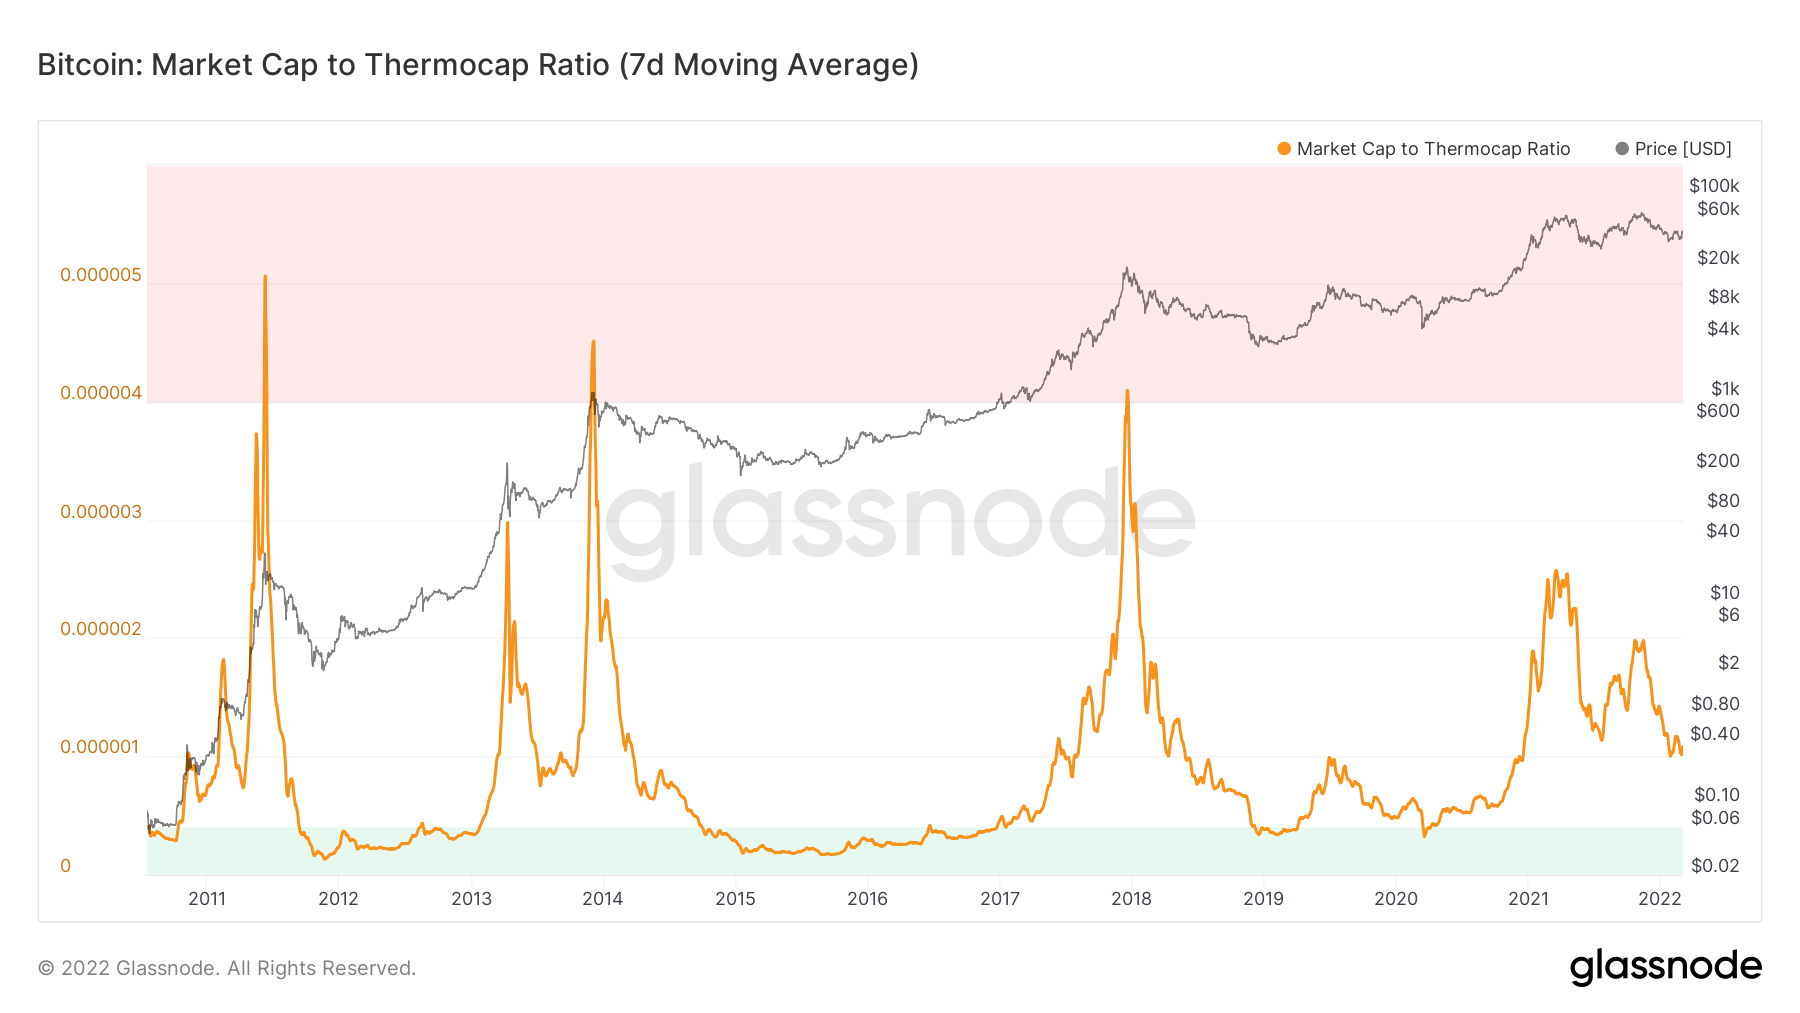
Since March 2021, an interesting development arose at the indicator reading, which can be seen from the chart.
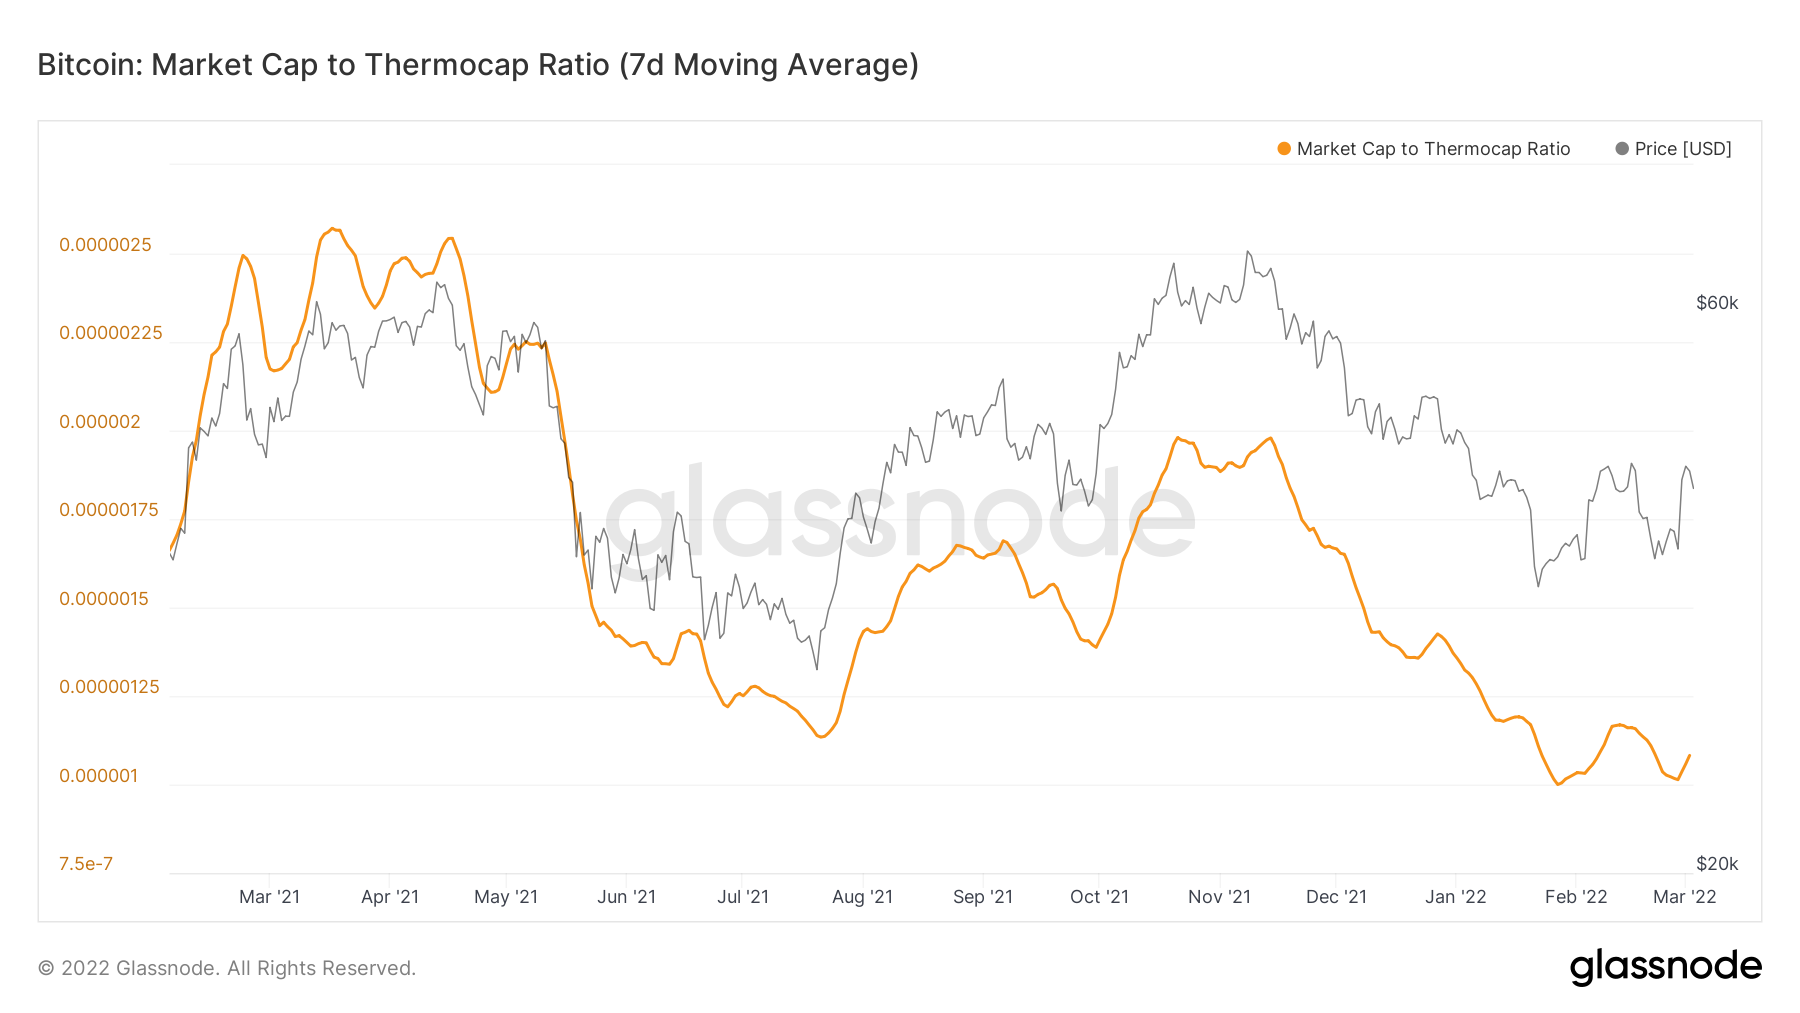
Since it’s decrease in April to June, the marketcap to Thermocap ratio fell sharply, leading to a low of 0.00000113 on July 20. At the time, the BTC price was trading at $32,000.
Currently, the market cap to thermocap ratio is at 0.000001. However, the BTC price is close to $43,000.
Based on the foregoing indicator, the current BTC price is undervalued when compared to the price back in July 2021.
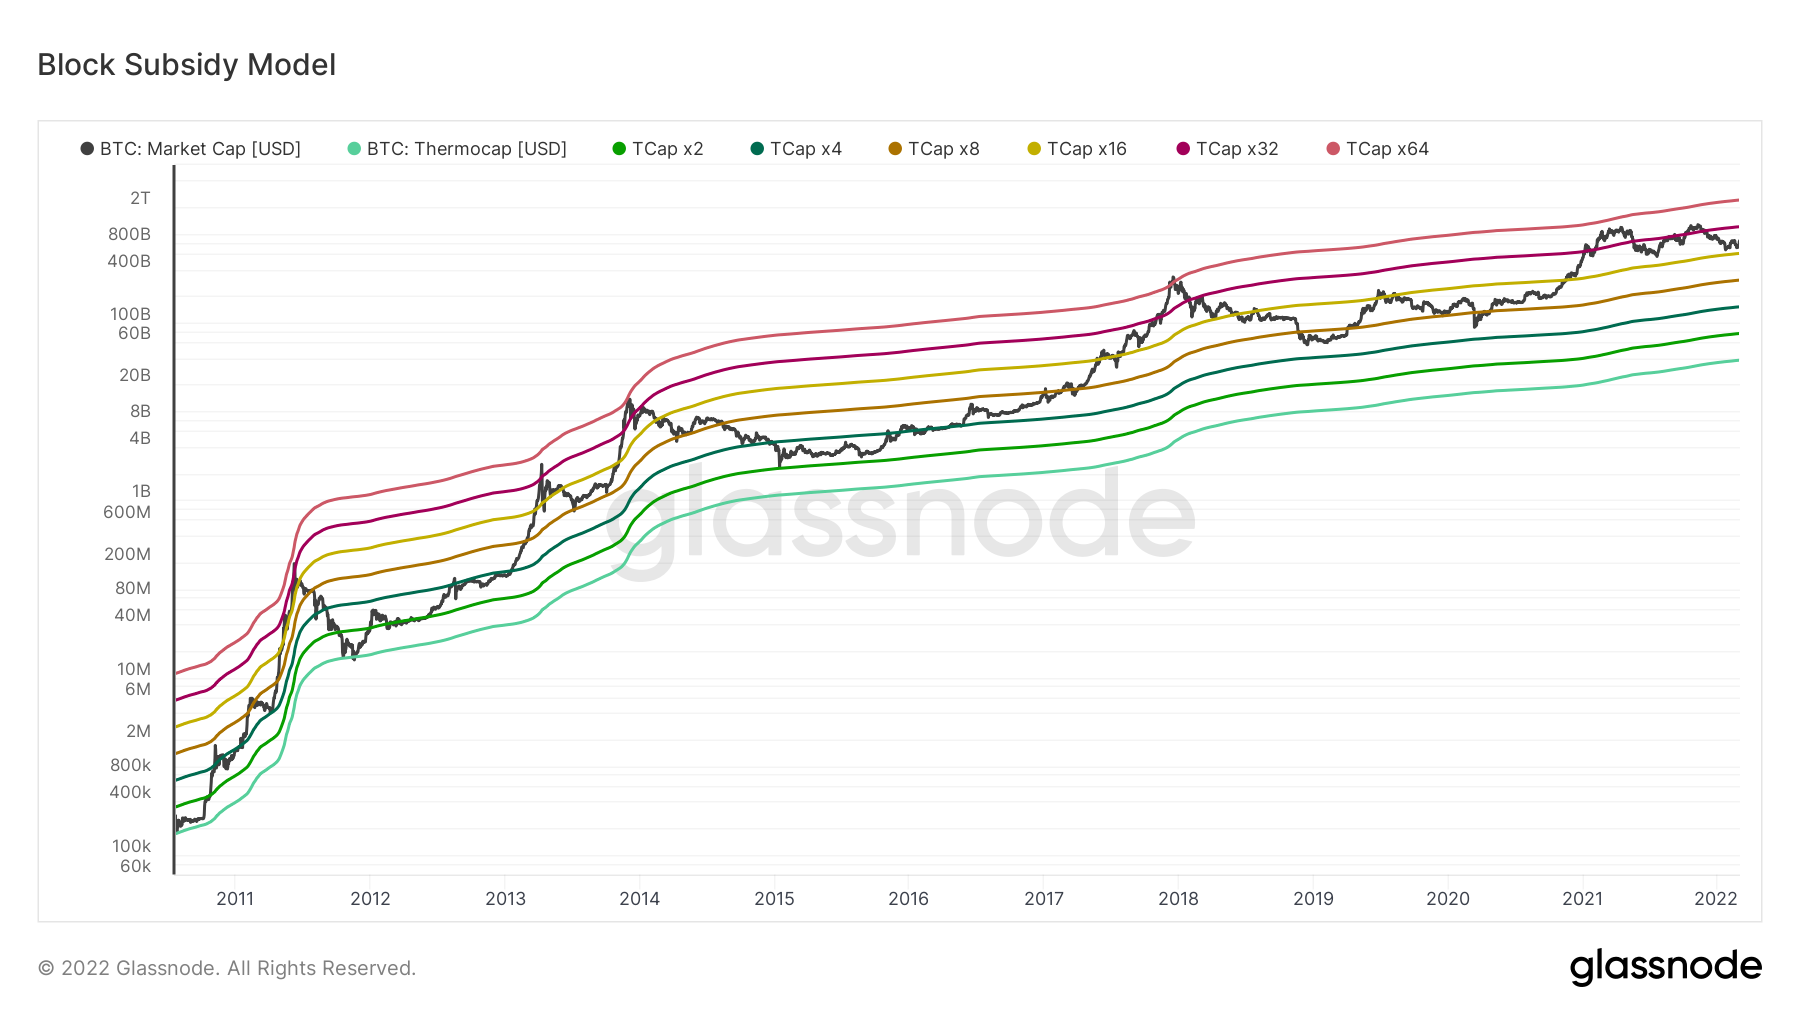
Block subsidy model
The block subsidy model measures the cumulative cost of production for Bitcoin. Afterwards, the sum of all the block rewards determines the maximum rational investment of miners is estimated.
In the chart below, this is presented by taking the multiples of the Thermocap.
Historically, each BTC cycle top has been reached at the 64 multiple of the Thermocap (pink). From previous patterns, once BTC increases above the 16 multiple, which is where the current market cap is (yellow), the subsequent fall marks the corrective phase.
However, this was not the case in 2022, since the current high was made just slightly above the 32 multiple (purple).
Therefore, it is imperative that the market cap stays above this line in order for the bullish trend to remain intact.
For BeInCrypto’s latest Bitcoin (BTC) analysis, click here.
What do you think about this subject? Write to us and tell us!
