


A look at on-chain data, specifically the market cap and thermocap ratio, in order to determine when the current bull market comes to an end.
The market cap/thermocap (MC/TC) ratio suggests that neither bitcoin (BTC), ethereum (ETH), nor litecoin (LTC) have reached their tops.
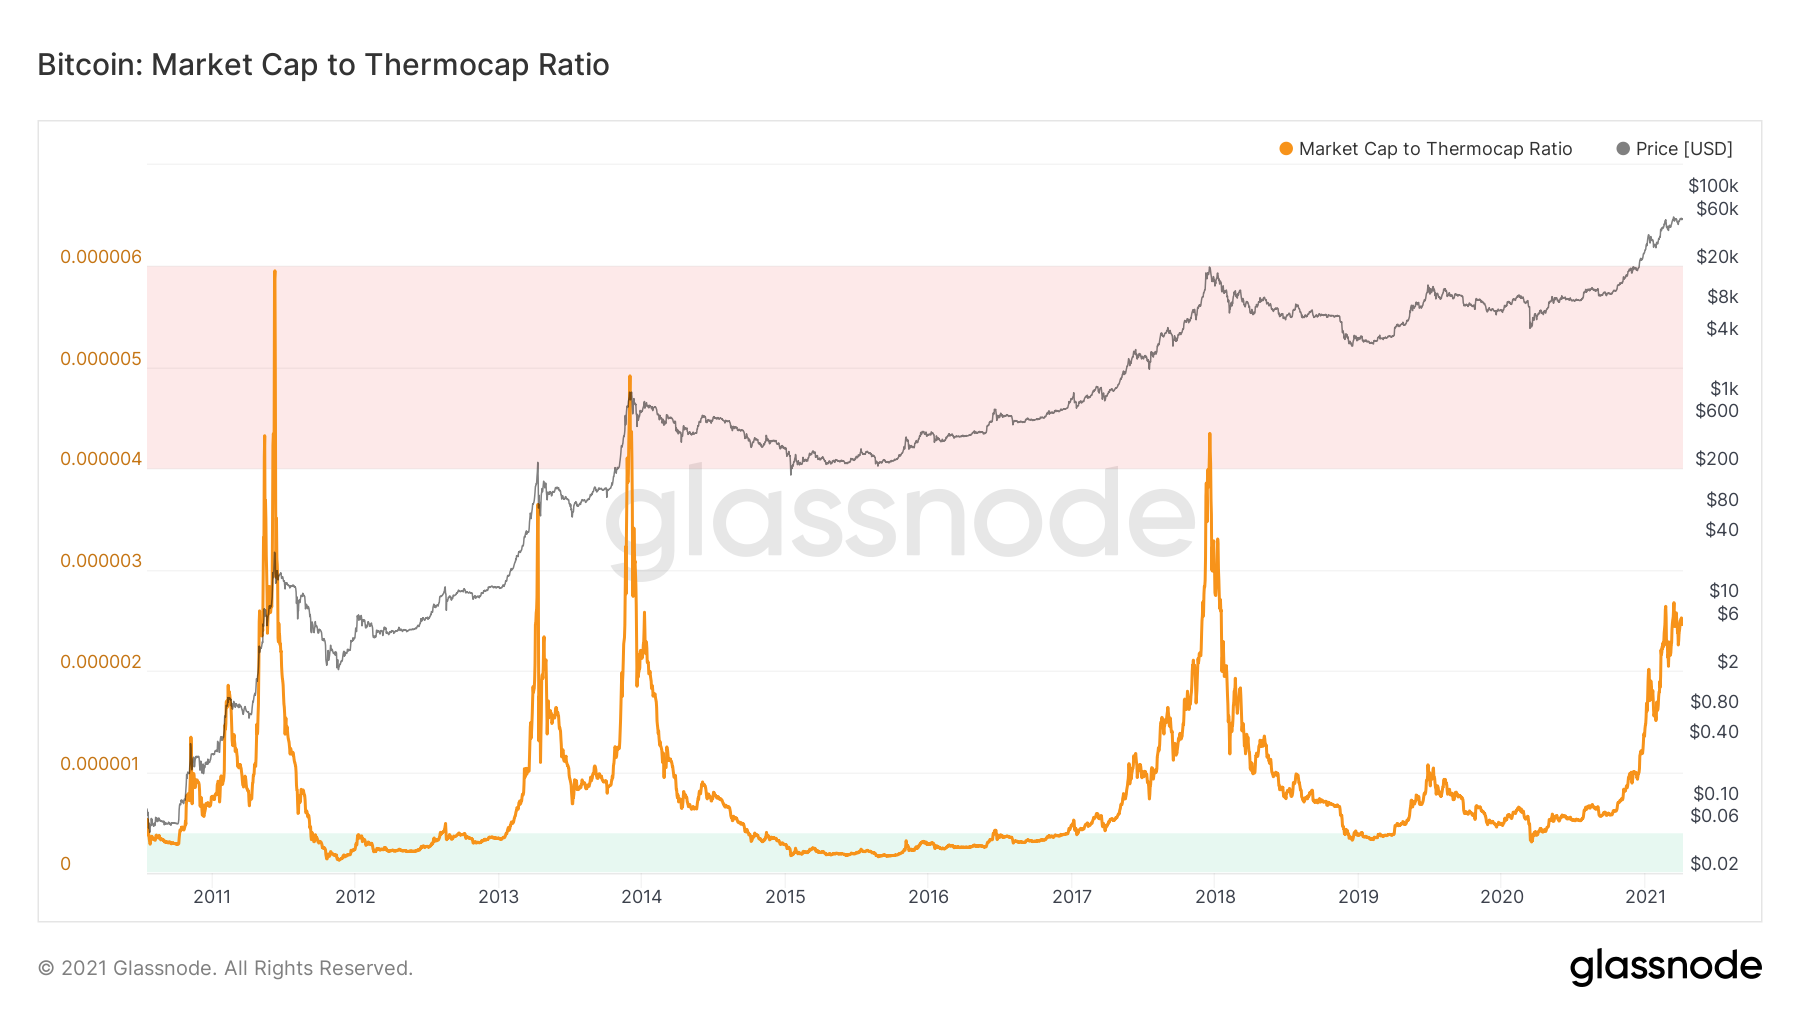
Bitcoin thermocap
The thermocap measures the cumulative rewards that crypto miners receive starting rom day one.
An interesting ratio that has so far correctly predicted the two previous market tops is the MC/TC ratio. It simply divides these two values in order to find a ratio which can be used to asses whether the BTC price is trading at a premium in regards to the amount of rewards paid to miners.
In the 2011, 2013, and 2017 price peaks, the MC/TC ratio also reached a peak in overbought territory, which is designated as the area above 0.000004 (highlighted in red).
During the 2011 peak, MC/TC was at 0.00000595, in 2013 it was at 0.00000491, while in 2017 it was at 0.00000439.
These were the only three times in bitcoin’s recorded price history that MC/TC was above 0.000004.
Currently, MC/TC is at 0.00000246. This indicates that there is ample time until the bull market is over.
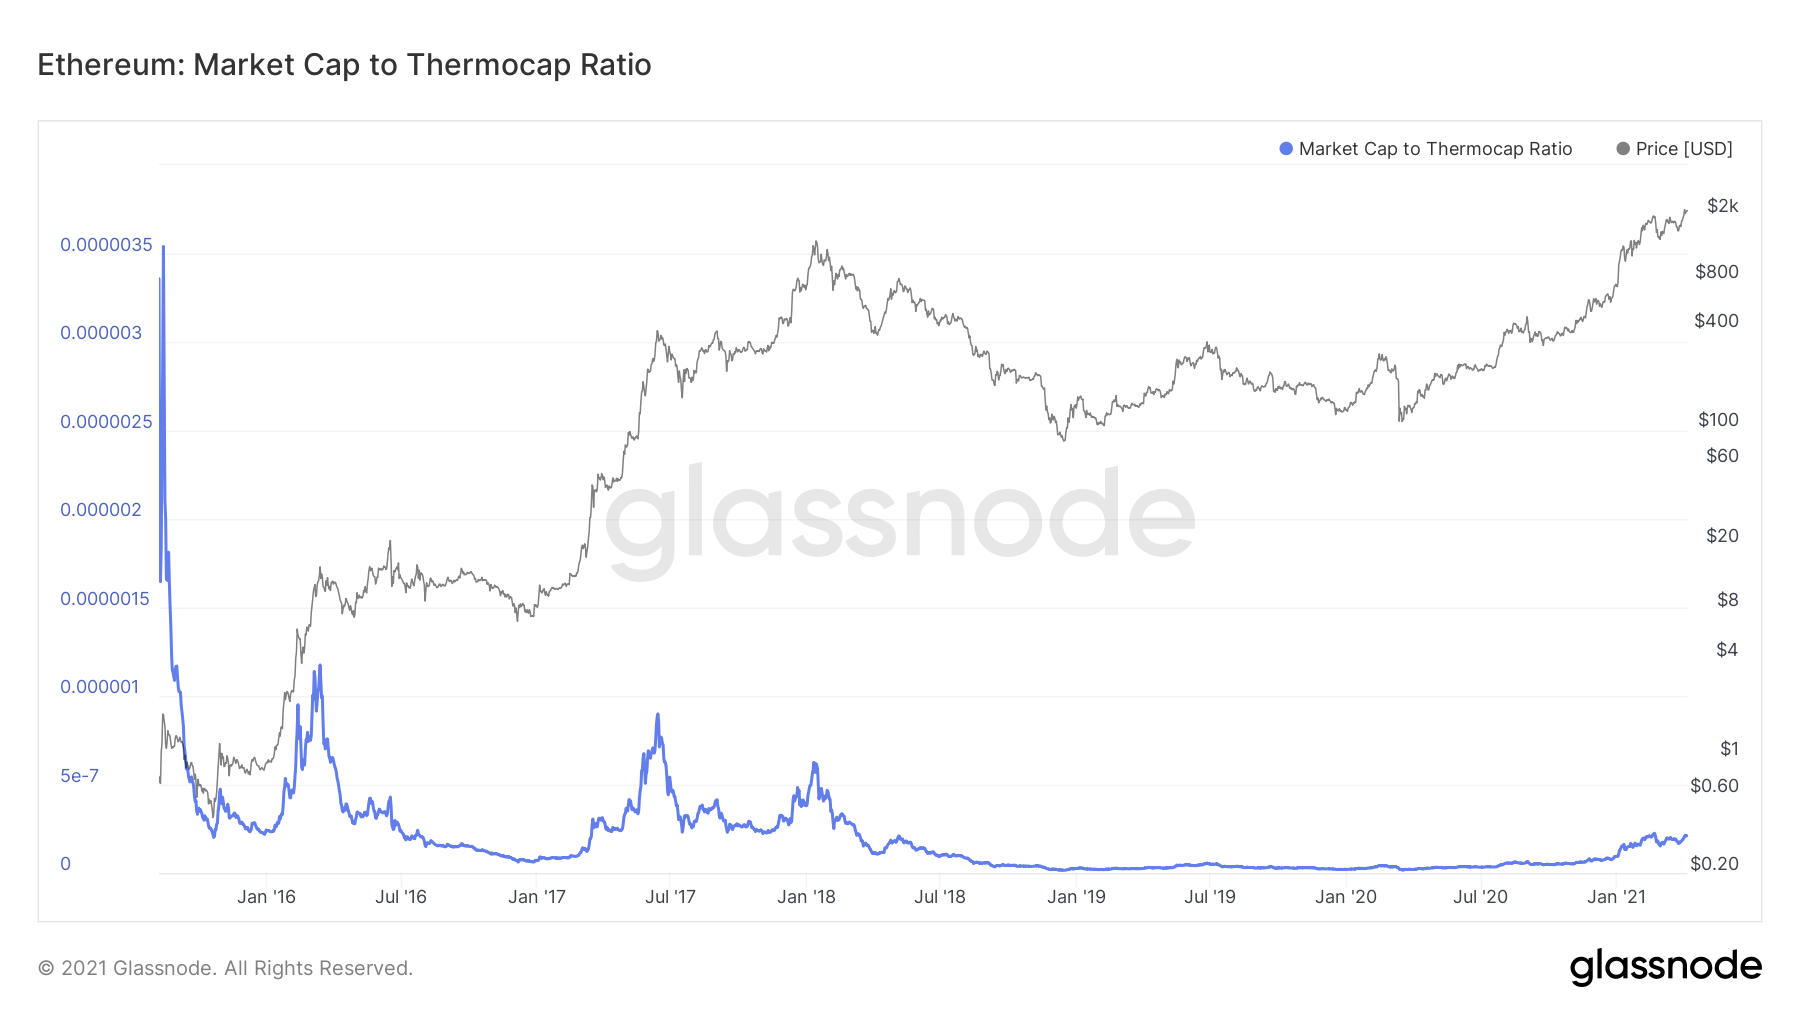
Ethereum thermocap
The same reading can also be applied to ethereum.
In the 2017 peak, the MC/TC value was at 0.0000009. In the 2018 one, it was at 0.00000062. The highest was in the 2016 one at 0.00000118.
While there isn’t a clear overbought value in the same way, the current MC/TC value is 0.00000021. This is three times smaller than that in the 2018 peak.
Similar to BTC, it also suggests that ETH has not reached a peak yet. Unlike BTC, which seems to be gradually approaching a peak, ETH does not seem to be close to doing so.
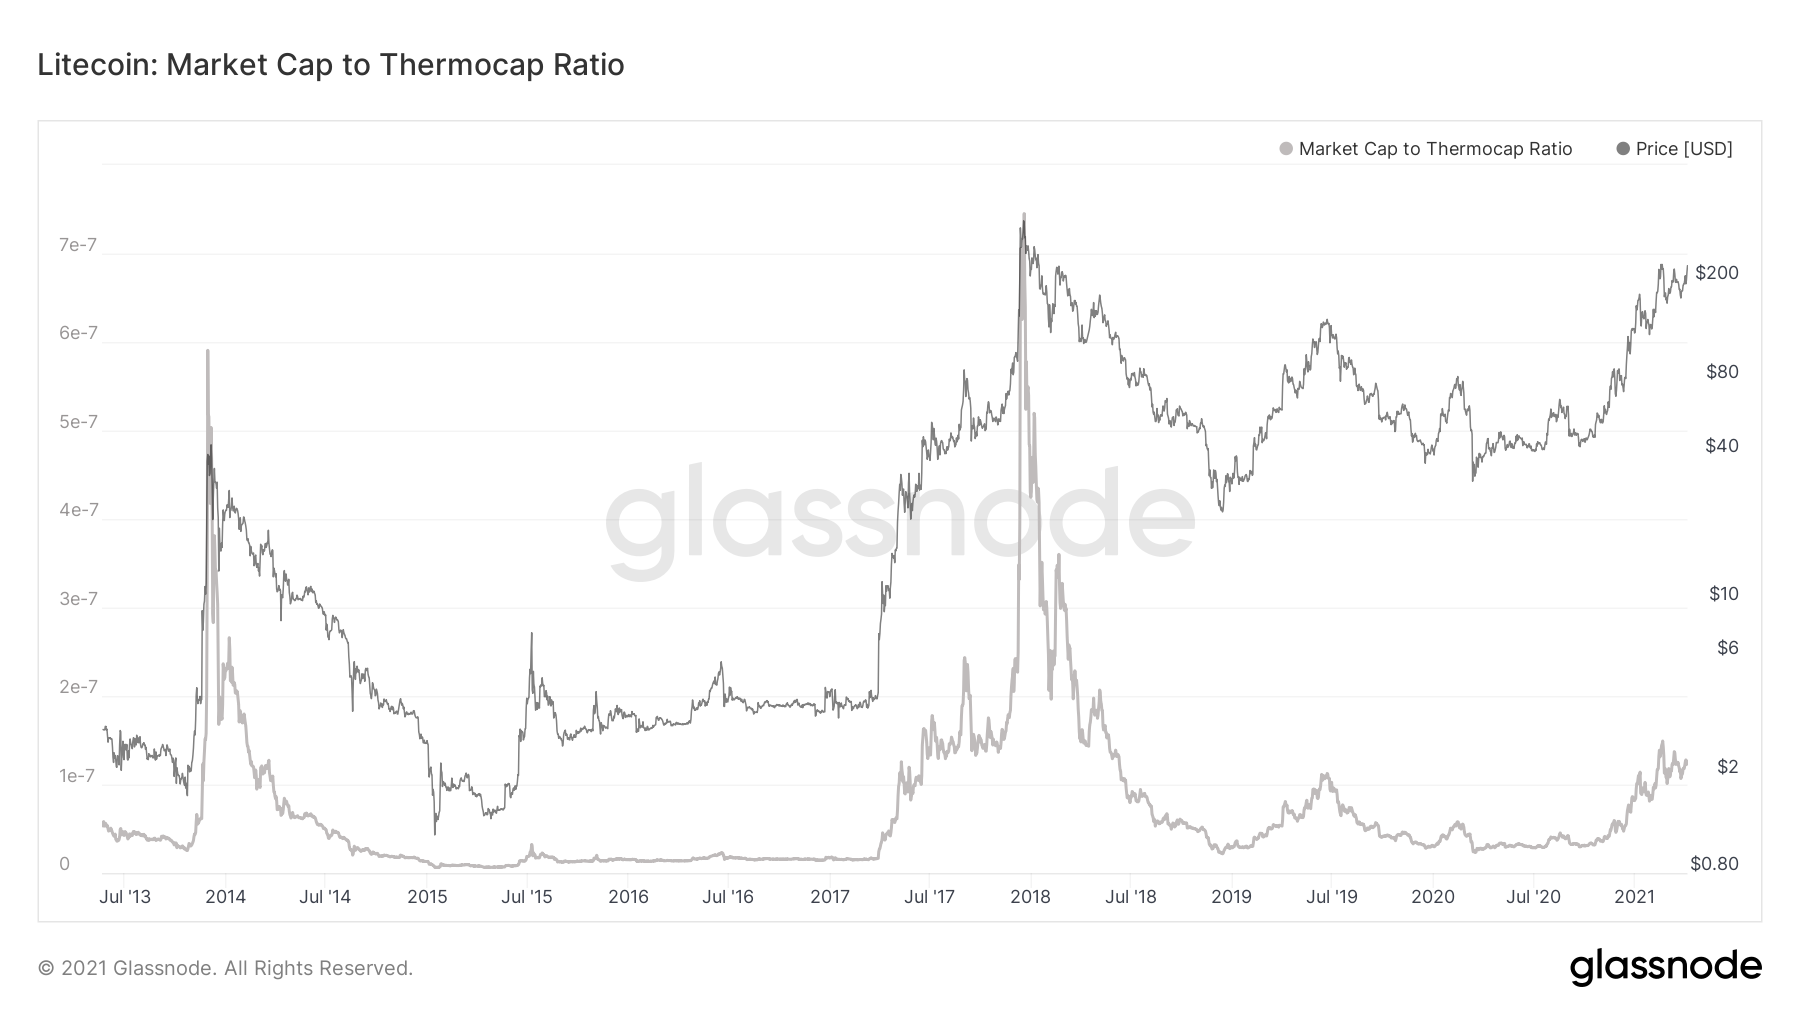
Litecoin thermocap
Finally, we can do the same with litecoin.
The MC/TC ratio for LTC mirrors that of BTC closer than it does that of ETH.
There are two distinct peaks, in which the price and the MC/TC peaks coincide with each other.
They are in 2014, when the MC/TC peak was at 0.00000059 and in 2018, when it was at 0.00000075.
The current MC/TC value is 0.0000013, suggesting that the LTC price has ample room to grow.
Conclusion
To conclude, the MC/TC ratio for BTC, ETH, and LTC indicates that the current bull market still allows for more price growth.
For BeInCrypto’s latest bitcoin (BTC) analysis, click here.


