


MANA is an ERC20 token used within Decentraland to purchase digital LAND, goods, and services.
Decentraland is one of the first truly decentralized virtual universe in the world. To gain access, users must use virtual reality goggles.
Development of Decentraland began in 2015. Its ICO was introduced in August of 2017. On Dec 7, 2018, it was listed on Coinbase Pro with three other ERC20 tokens.
In the following technical analysis, price trends, RSI, and StochRSI are used to analyze the performance of MANA over the last 380 days.

Price Fluctuations and Three Trends
Nov 24, 2017, is the first day that MANA is charted by TradingView. This is where our analysis begins. It ends on Dec 9, generating a data set with 380 unique data points.
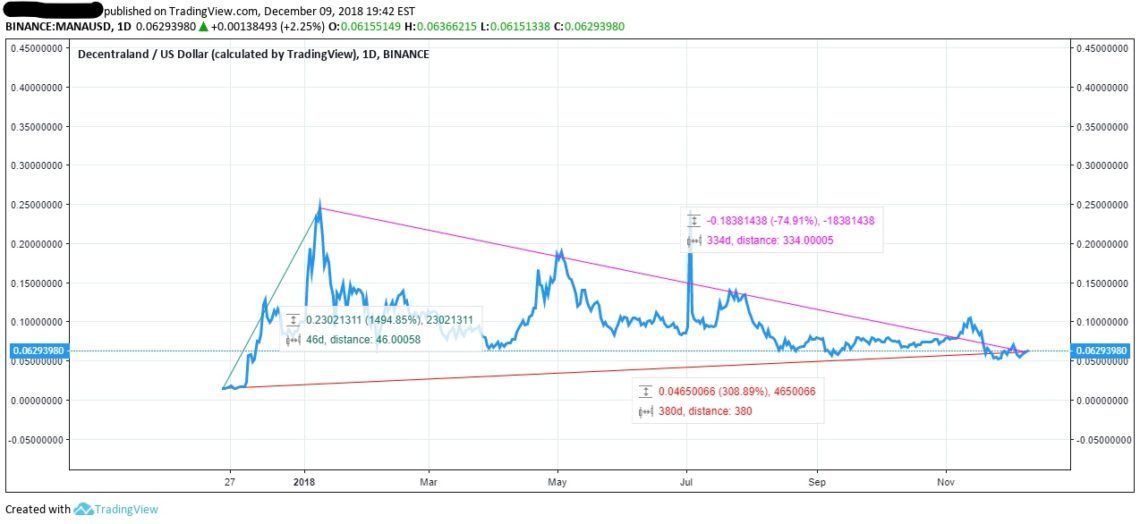
The graph above includes 380 days of closing prices for MANA and three trend lines designed to present various quantitative data of relevance:
1.) The red trend line includes the growth in value experienced by MANA in USD between the first data point (closing value of MANA in USD on Nov 24, 2017) and last data point (closing value of MANA in USD on Dec 9, 2018).
The first data point represents the value of MANA at the beginning of the series. This value represents USD 0.01540040.
The final data point of USD 0.06155487 signifies an increase of value over the 380 day period of USD 0.04650066.
This increase in value represents an average growth rate of 308.89 percent between the first data point to the last data point.
2.) The green trend line measures the growth between the data points with the lowest and highest respective values.
The data point with the lowest value occurs on Nov 24, 2017, which is also the first data point in the series. The highest value was reached on Jan 9, 2018, 46 days after the first data point. It represents a value of USD 0.24536925.
Between Nov 24, 2017, and Jan 9, 2018, MANA’s value grew by $0.23021311, which constitutes a positive growth rate of 1494.85 percent.
3.) The final trend line, drawn in purple, defines the negative growth rate between the highest value reached and the final value of the data set.
To summarize, the final data point represents USD 0.06155487 while the highest value reached represents USD 0.24536925. A loss of USD 0.183814378 was realized during the 334 days between Jan 9, 2018, and Dec 9, 2018, representing a negative growth rate of 74.91 percent of its value.
Despite this loss, however, the final value remains higher than the starting value as shown using trend line one.
RSI Never Oversold
When the Relative Strength Index (RSI) is included as an indicator, no point can be isolated in which MANA is oversold. Though the lowest RSI recorded is 31.0075 on Aug 14, 2018, RSI never crosses below the 30-point threshold.
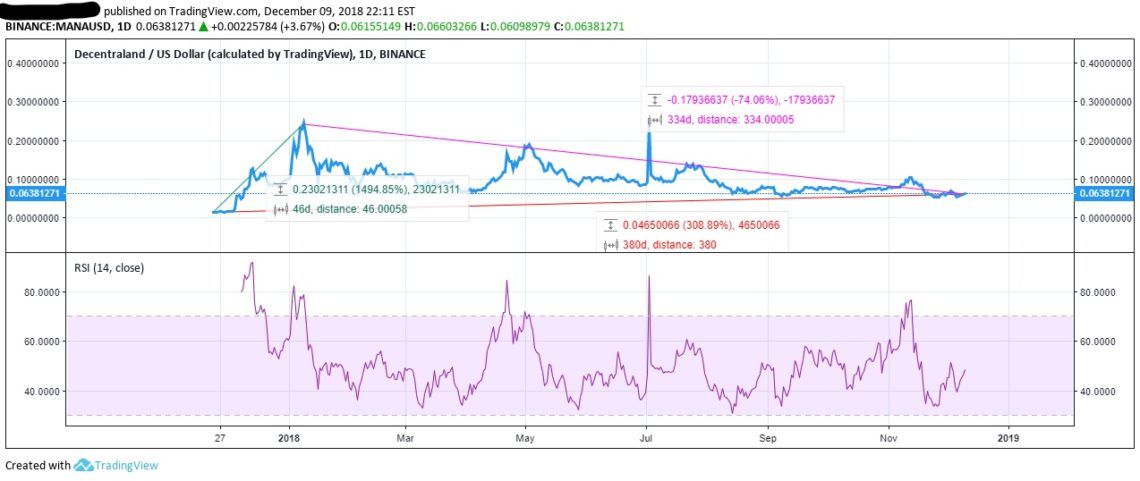
There are, however four periods in which MANA is overbought, meaning that it exceeds the 70-point threshold:
- Between Dec 8 and 20, 2017
- Between Jan 3 and 10, 2017, though on Jan 5, RSI dropped below the 70-point threshold hitting 68.866
- Between April 20 and 24, 2018
- Between Nov 12 and 13, 2018
There were also a series of individual days in which RSI exceeded the 70 point threshold such as on May 1 and 3, July 3, Nov 10.
Using Stochastic RSI to Determine Periods of Overselling
RSI is derived using standard price data in order to determine whether an asset is being overbought or oversold based on the price of that asset at a given time. Stochastic RSI (StochRSI), however, applies a stochastic oscillator formula to RSI, not to standard price data.
In so doing, StochRSI suggests to traders at what points the value of RSI, not asset price, is overbought or oversold. It was developed for usage in circumstances like this: when RSI values are too heavily limited between the 30-70 range to be used feasibly as an indicator for buying or selling of an asset.
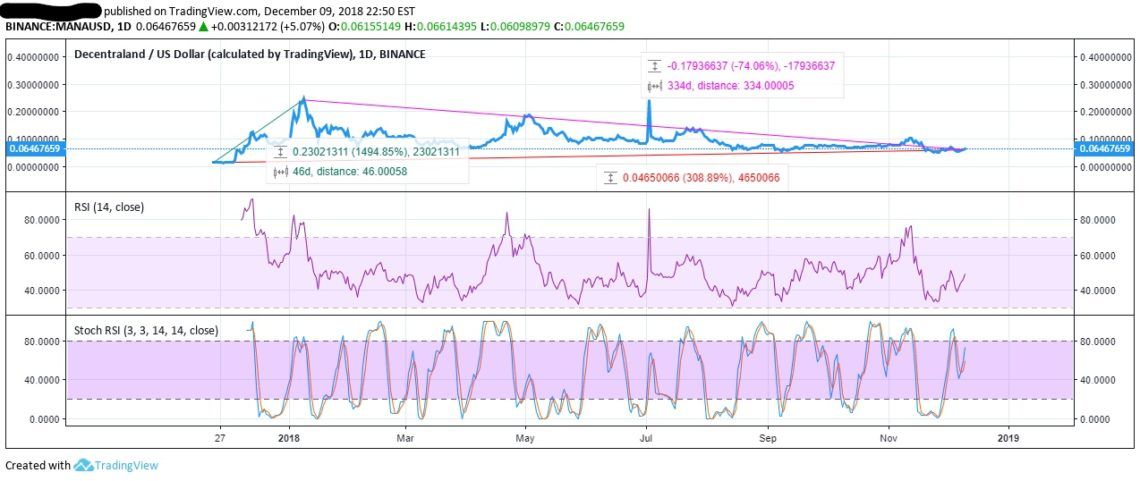
StochRSI is exhibited in the newly introduced section of this graph. Unlike RSI, there are now many periods in which overselling appears. For this reason, it may be more beneficial to rely on StochRSI when trading MANA rather than traditional RSI alone.
Conclusion
Despite large fluctuations in price over the last 380 days, the value of MANA in USD increased between Nov 24, 2017, and Dec 9, 2018. The lowest USD value of MANA was encountered on the first data point of the series and the highest appeared only 46 days later with a negative trend following for the following 336 days. Nonetheless, the positive trend of 380 days proved significant enough to overcome this negative trend.
Further, using RSI it was observed that MANA traders are prone to overbuying but have managed to prevent overselling. For this reason, StochRSI was introduced. With the use of StochRSI, multiple periods in which RSI was oversold were graphed.
What do you think is going to happen with MANA? Will the price continue to increase over time despite rapid fluctuations within the data series? Or will the negative trend that emerged at data point 46 eventually overcome positive price growth? Let us know your thoughts in the comments below!


