


The Sandbox (SAND) has reached a long-term horizontal support level and broken out from a descending resistance line shortly afterward.
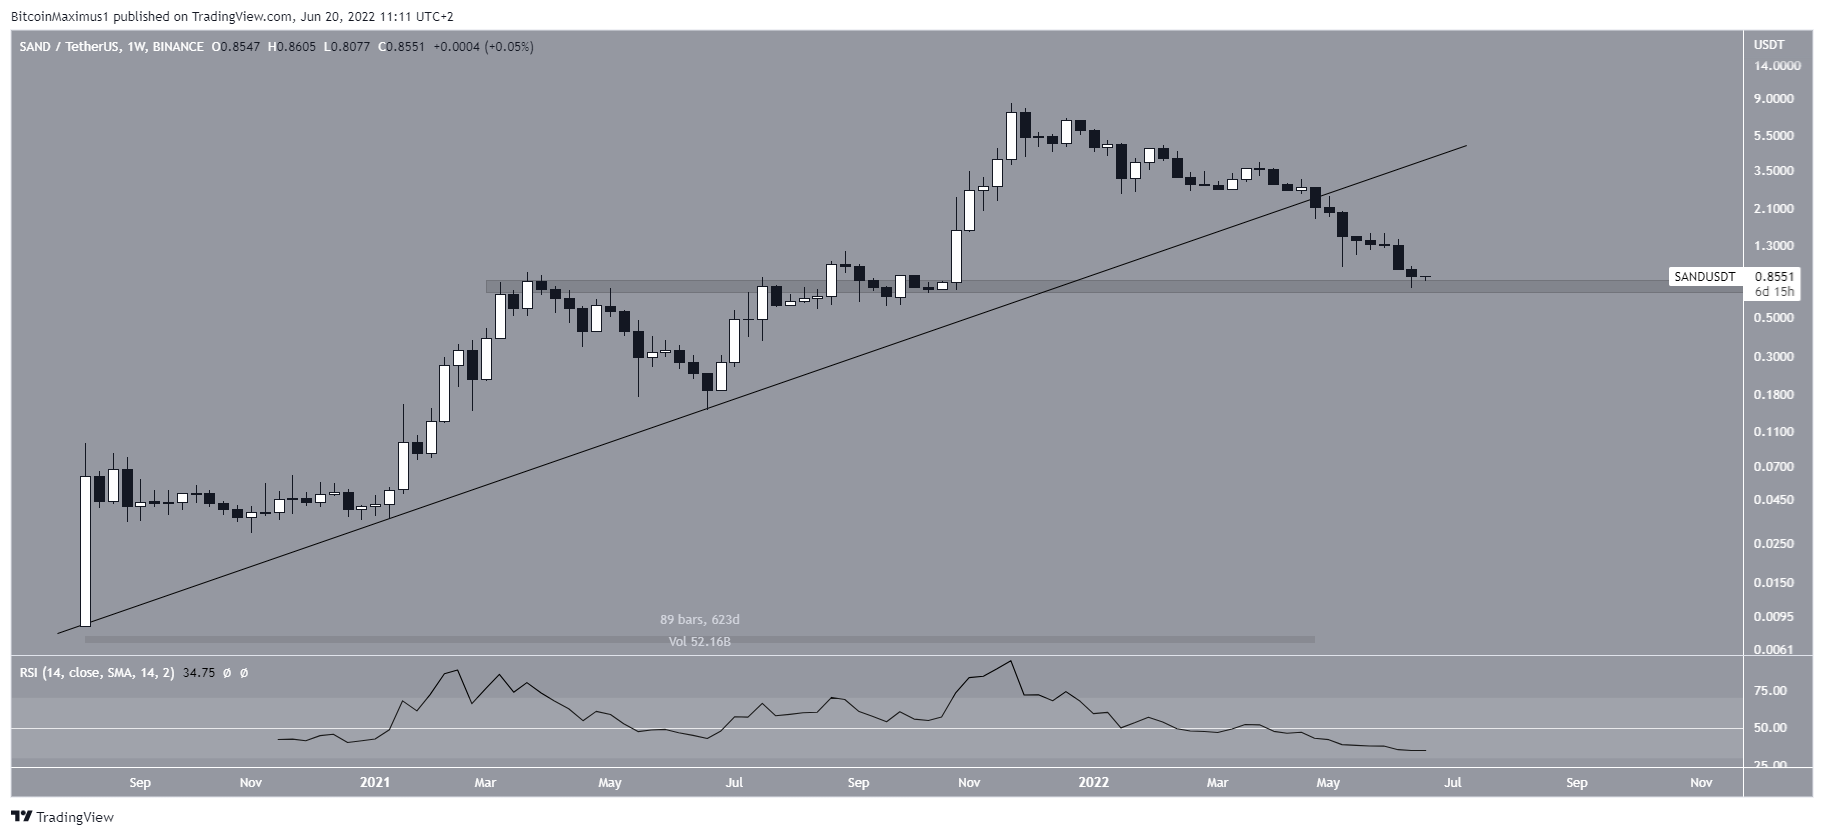
SAND has been falling since reaching an all-time high price of $8.48 on Nov. 25, 2021. The decrease has so far led to a low of $0.73 on June 18, 2022. Measuring from the all-time high, this amounted to a drop of 91%.
During the decrease, the price broke down from an ascending support line that had been in place for 623 days. A breakdown from such a long-term structure often indicates that a trend reversal has occurred.
This possibility is strengthened by the fact that the weekly RSI for SAND has fallen below 50, and is now at an all-time low of 33.
Currently, the price is trading just above the $0.77 horizontal support area, a level that previously acted as resistance in 2021.
SAND break out
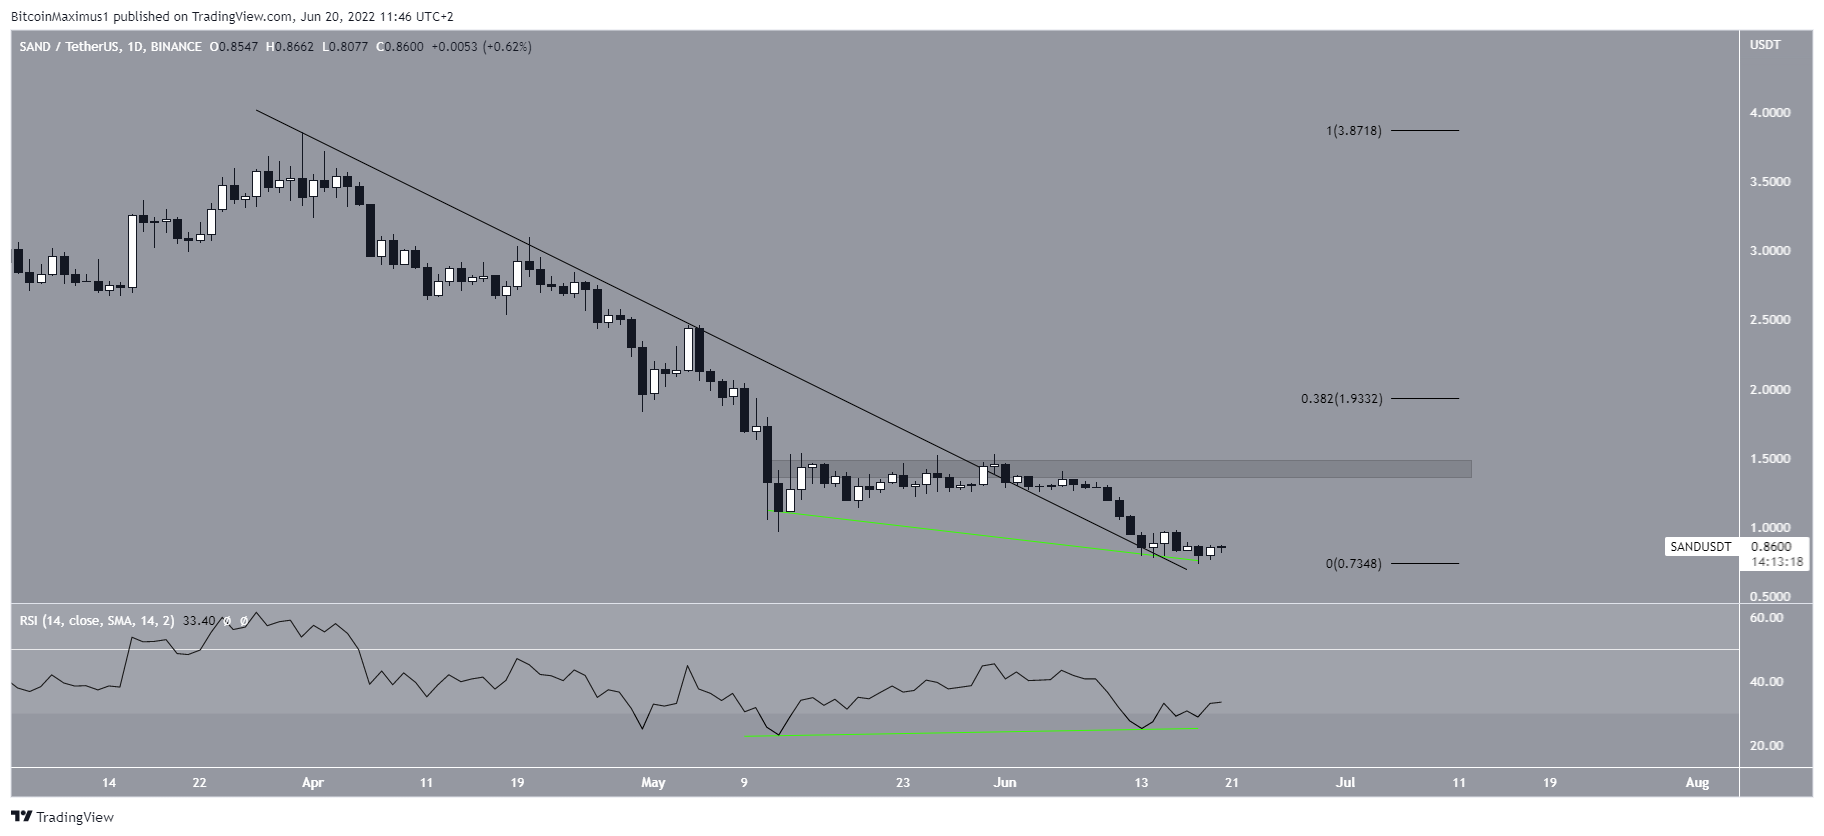
The daily chart provides a more bullish outlook than the weekly one.
The first reason for this is that the price has already broken out from a descending resistance lien that had been in place since the beginning of April.
The second one is that the daily RSI has generated a very significant bullish divergence. However, it has yet to move above the high between the divergences, which would confirm the bullish reversal.
In order for this to occur, the price would have to move above the two closest resistance levels, which are found at $1.43 and $1.93, respectively.
Wave count analysis
Cryptocurrency trader @JacobEmmerton tweeted a chart of SAND, which suggests that another downward movement is likely prior to a bullish reversal.
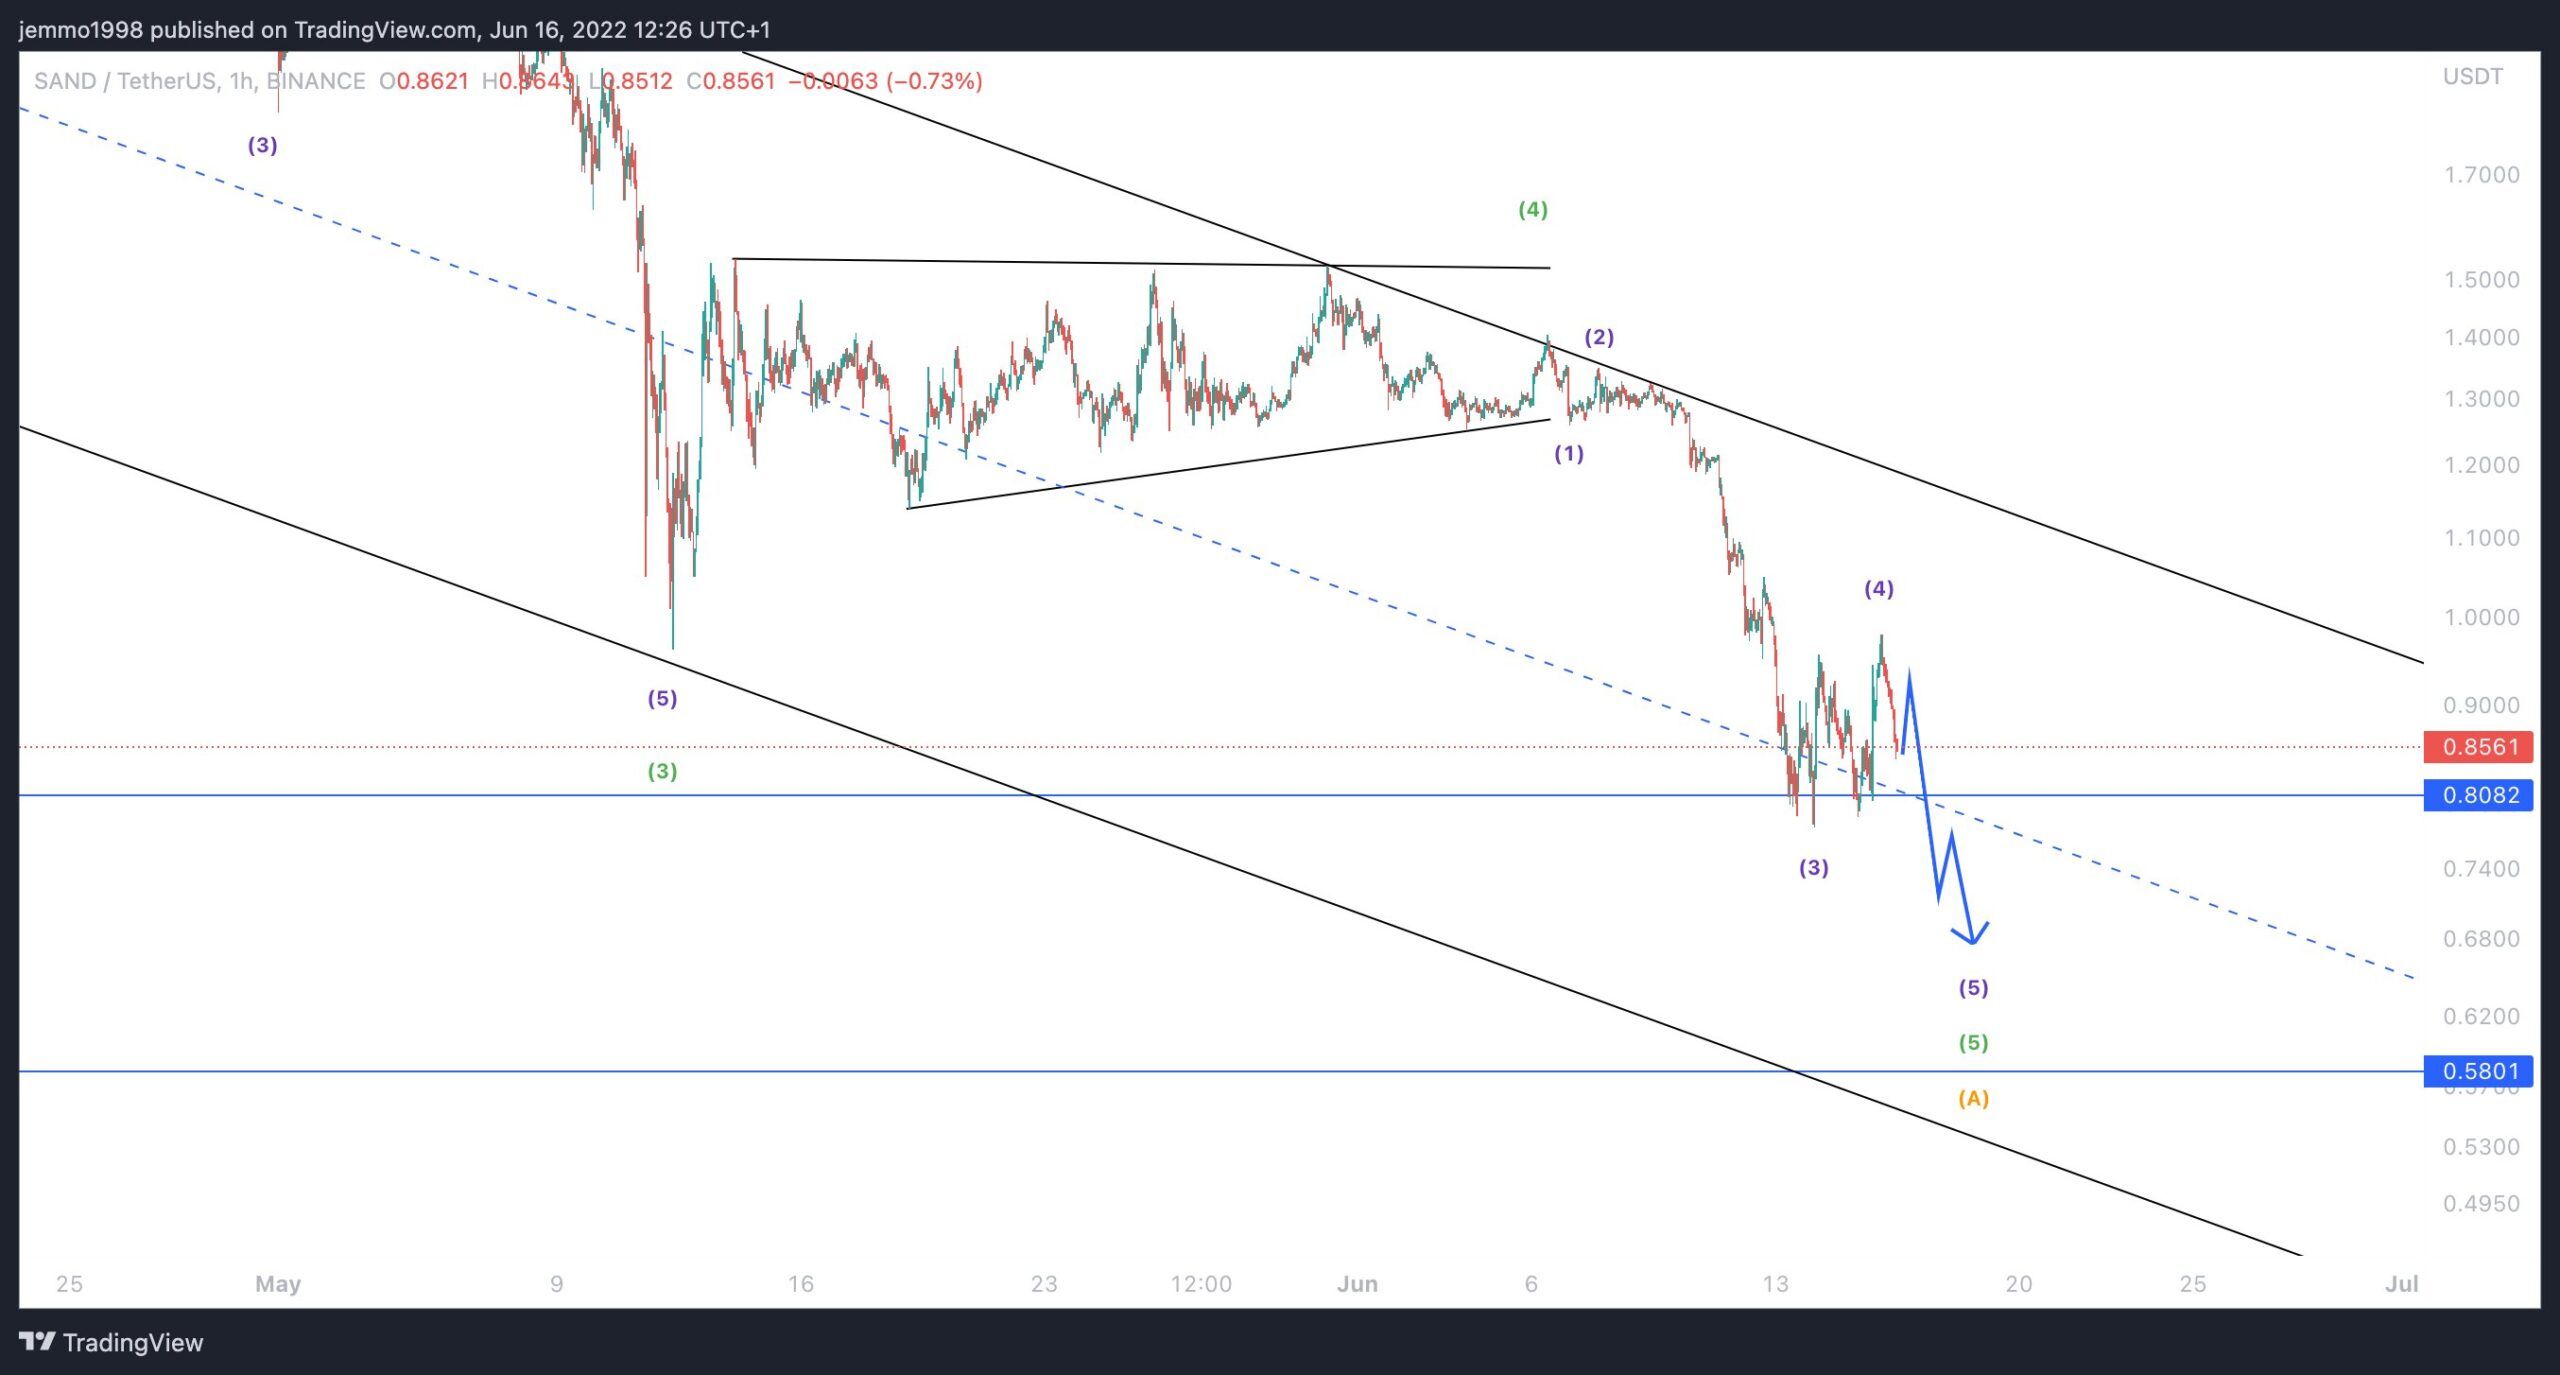
Since the price has broken down from a symmetrical triangle on June 6, this indicates that it completed wave four of a five wave downward movement at that time.
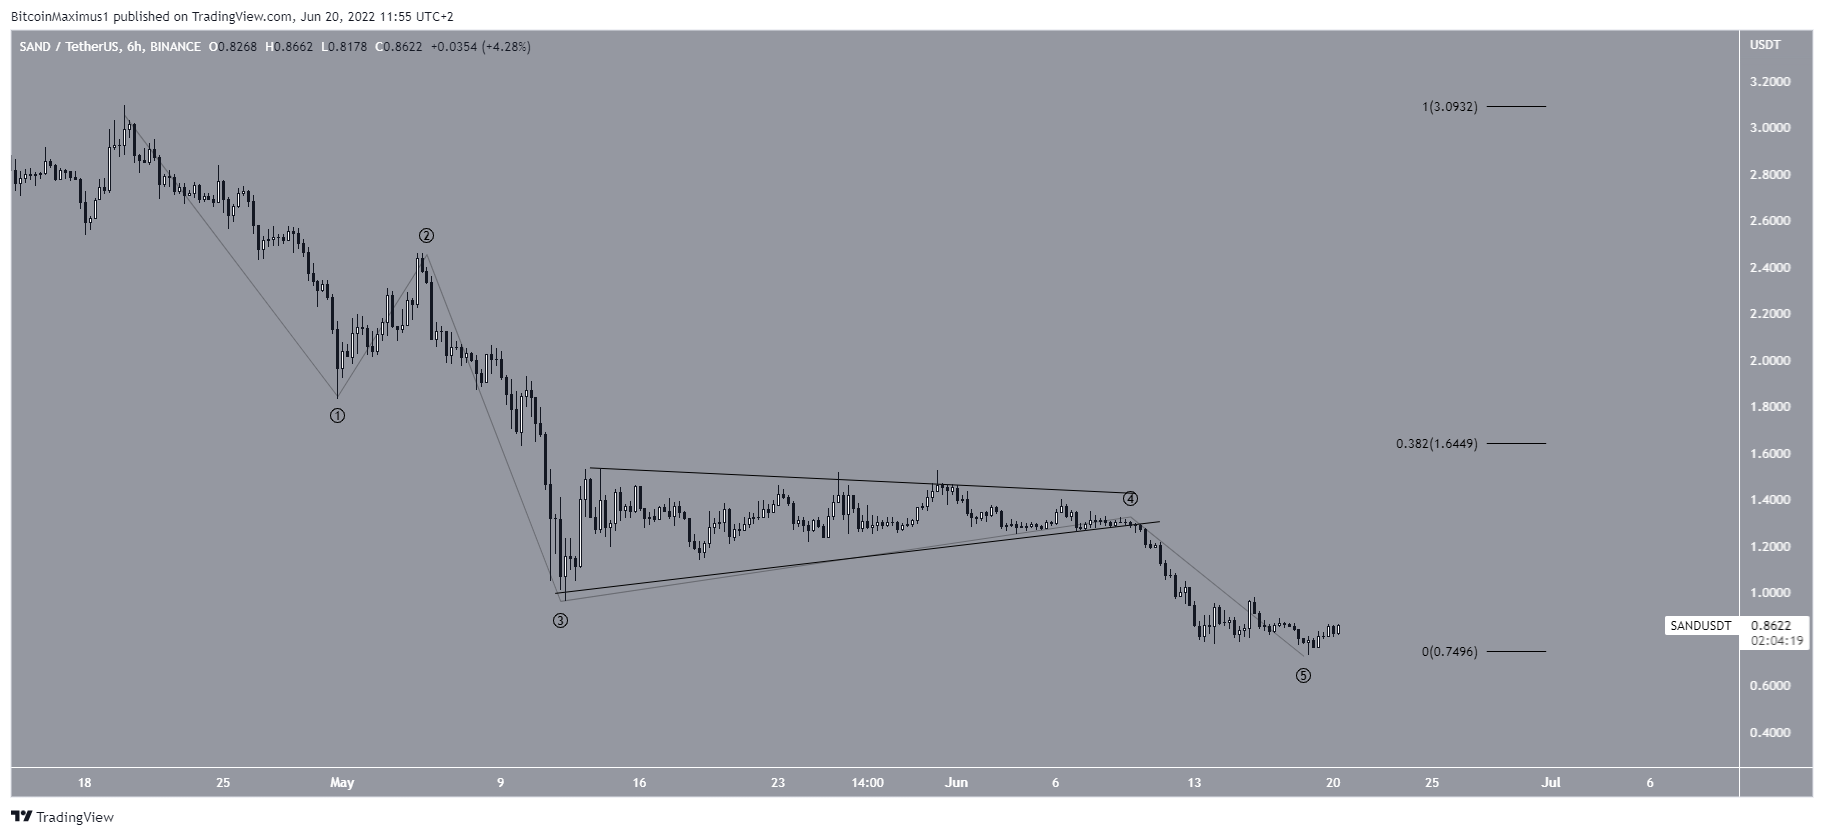
So, it is possible that SAND also completed the fifth wave with its low of $0.73. If so, a considerable bounce would be expected. The closest resistance area when measuring the decrease of this five wave movement would be at $1.65, between the two previously outlined resistance levels.
Therefore, the wave count supports the possibility that a significant bounce will transpire.
For Be[in]Crypto’s latest bitcoin (BTC) analysis, click here


