
The Sandbox (SAND) could break out from its short-term bullish pattern, but an eventual decrease below the June lows seems likely.
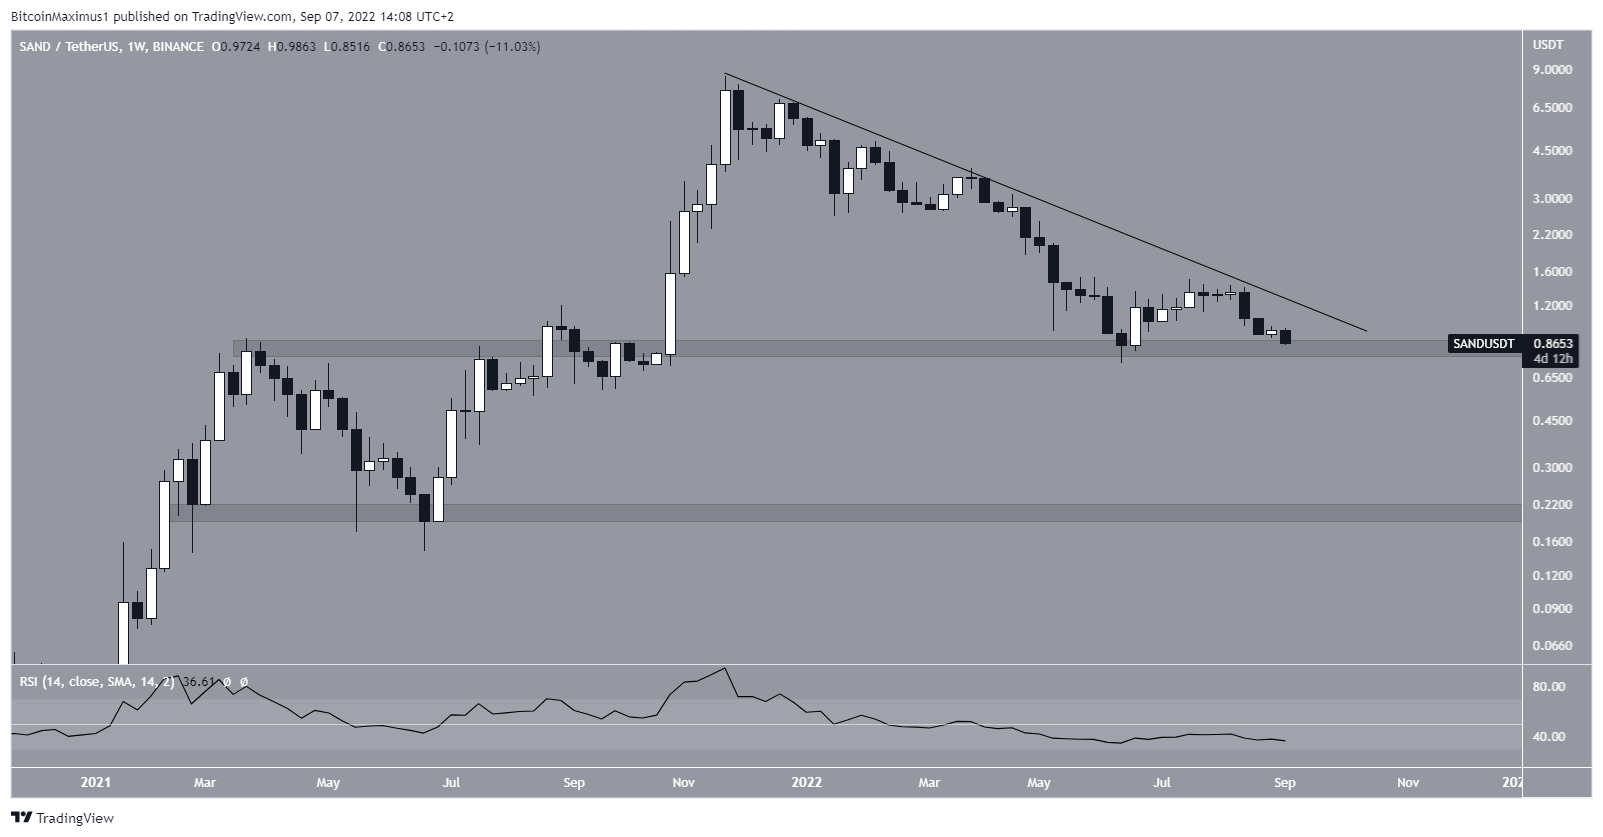
SAND has been falling underneath a descending resistance line since reaching an all-time high price of $8.48 in Nov 2021. The downward movement has so far led to a low of $0.73 in June 2022. The ensuing bounce served to validate the $0.85 area as support.
Afterward, the price made yet another attempt at breaking out from the descending resistance line, but the attempt was unsuccessful. Now, it has nearly returned to the $0.85 area once more.
The weekly RSI is below 50 and has not generated any bullish divergence. Therefore, the indicator suggests that the price will eventually break down. If so, it would likely decrease to the next horizontal support area at $0.20.
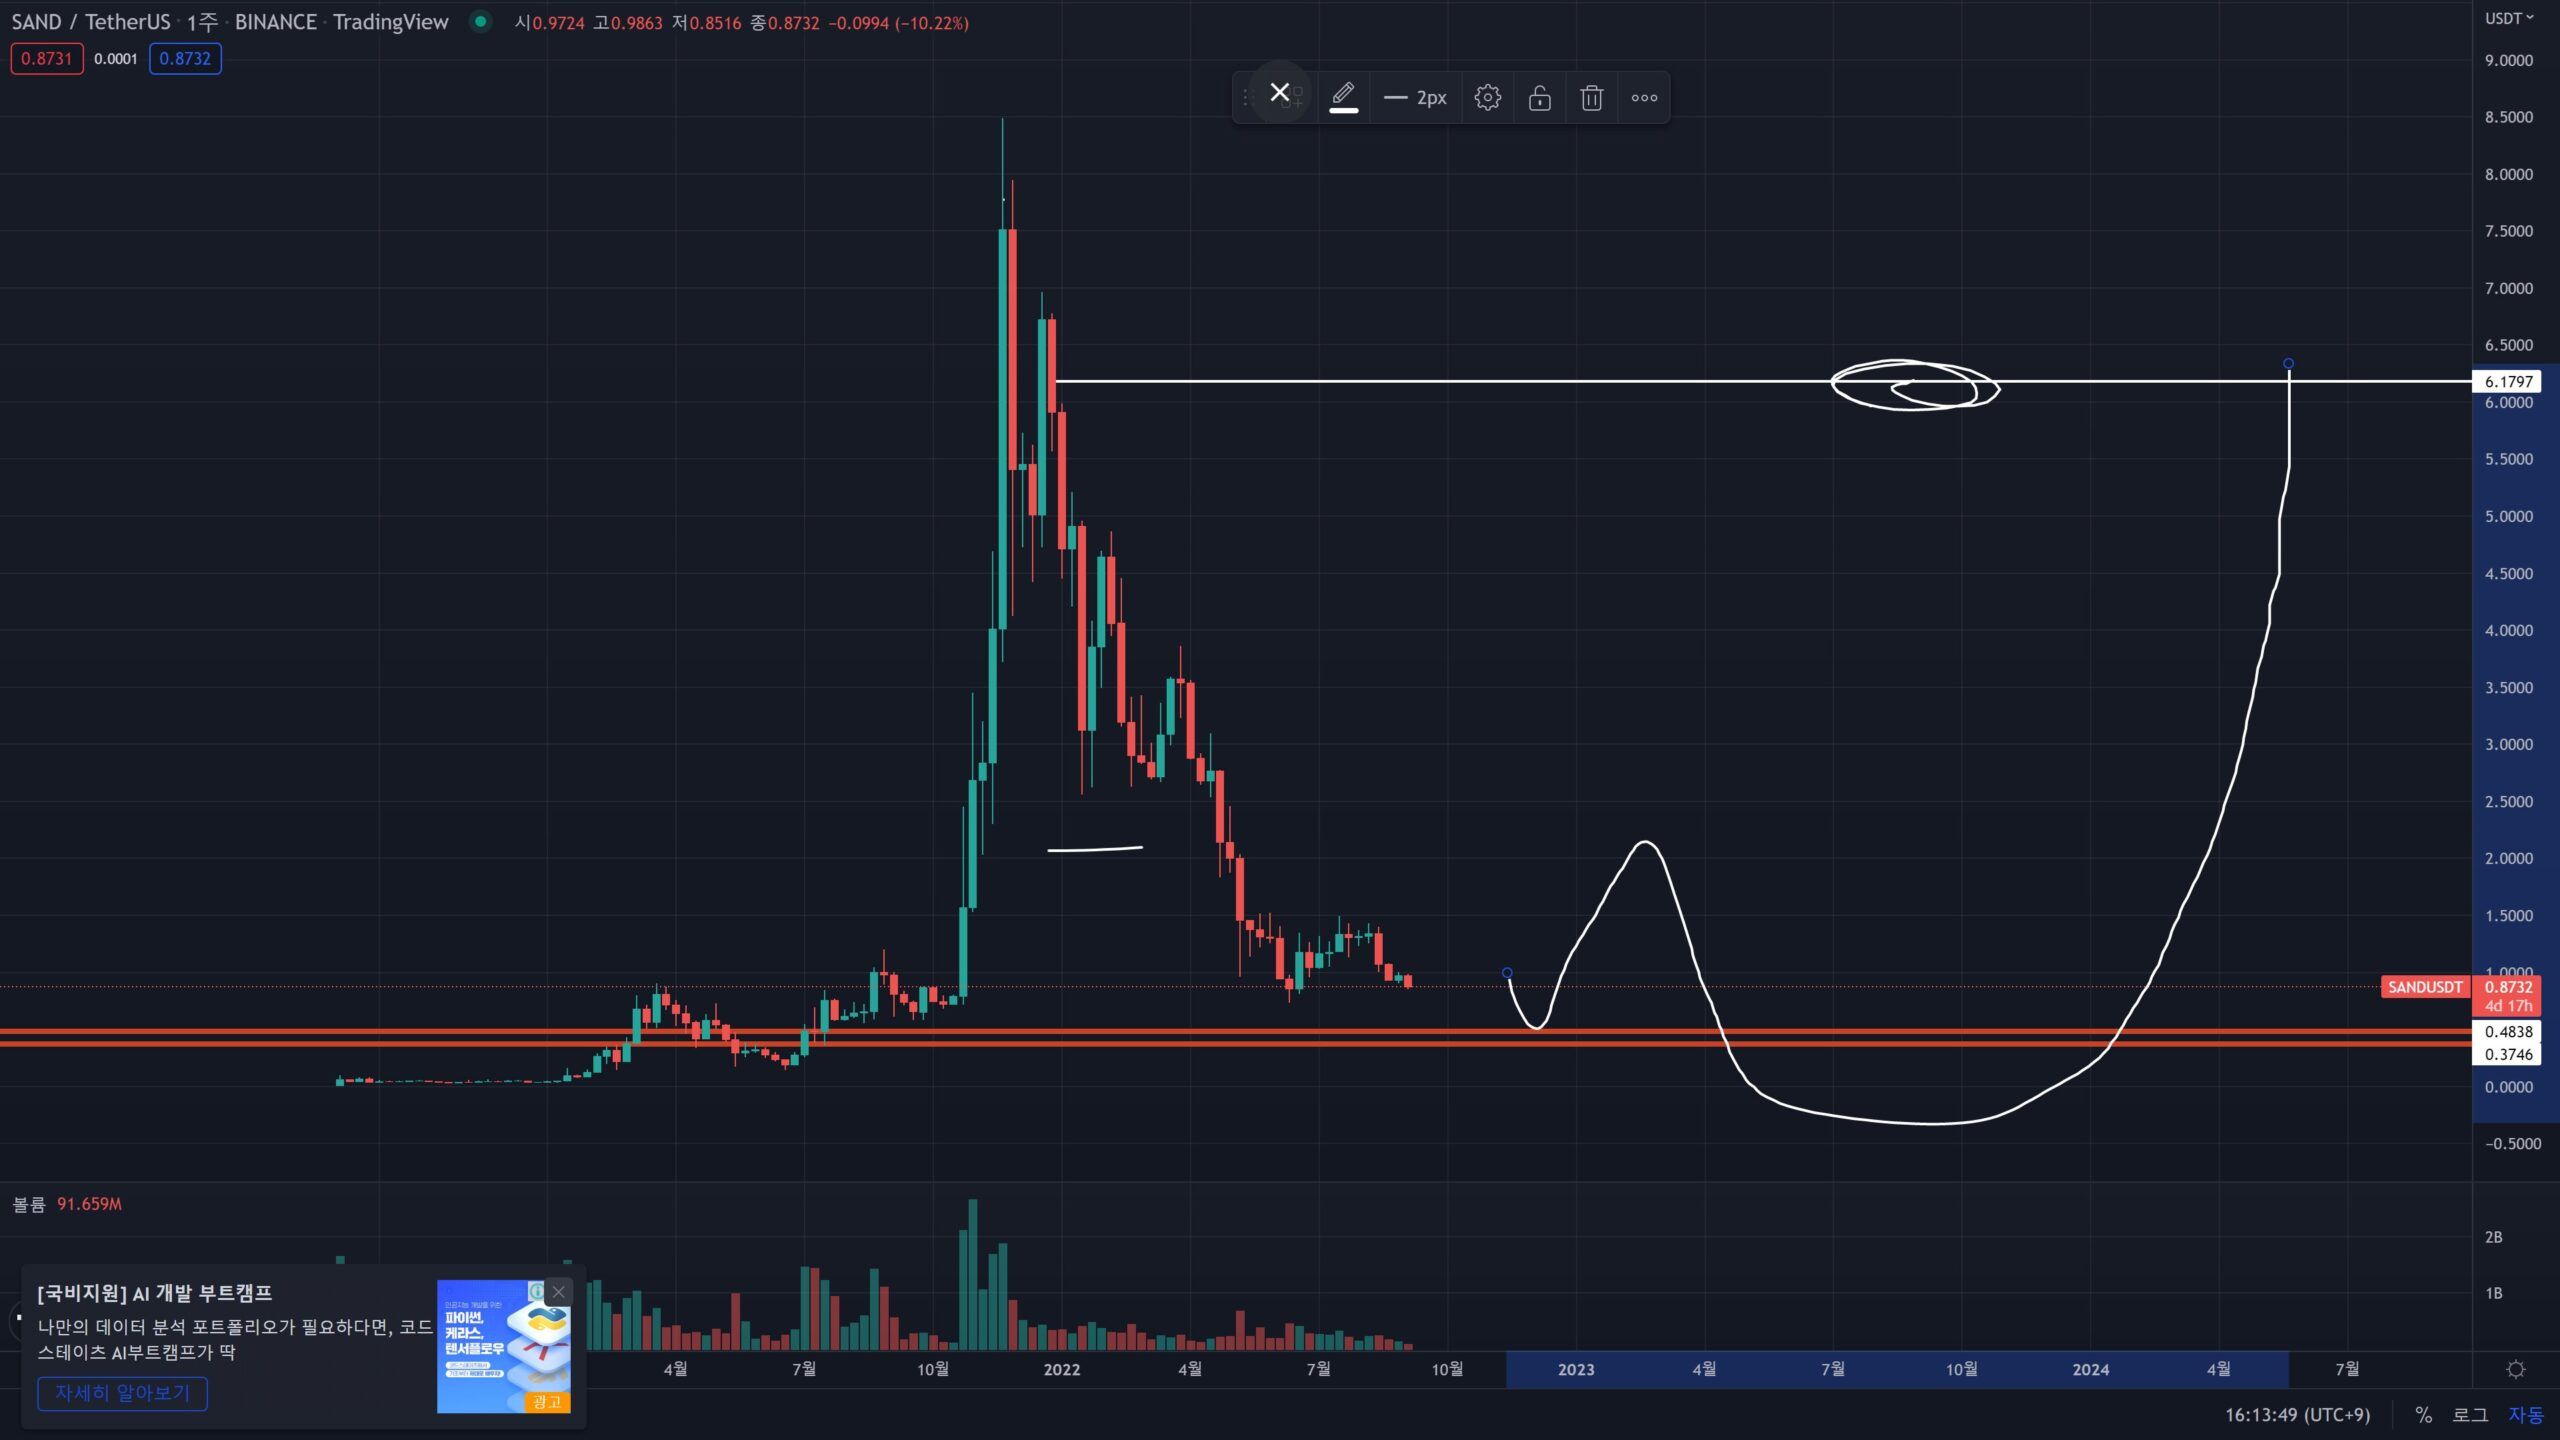
Cryptocurrency trader @madmexman tweeted a chart of SAND, which shows the price decreasing below the $0.45 horizontal support area before eventually initiating another upward movement. This is in alignment with the outlook from the weekly time frame.
SAND breaks down
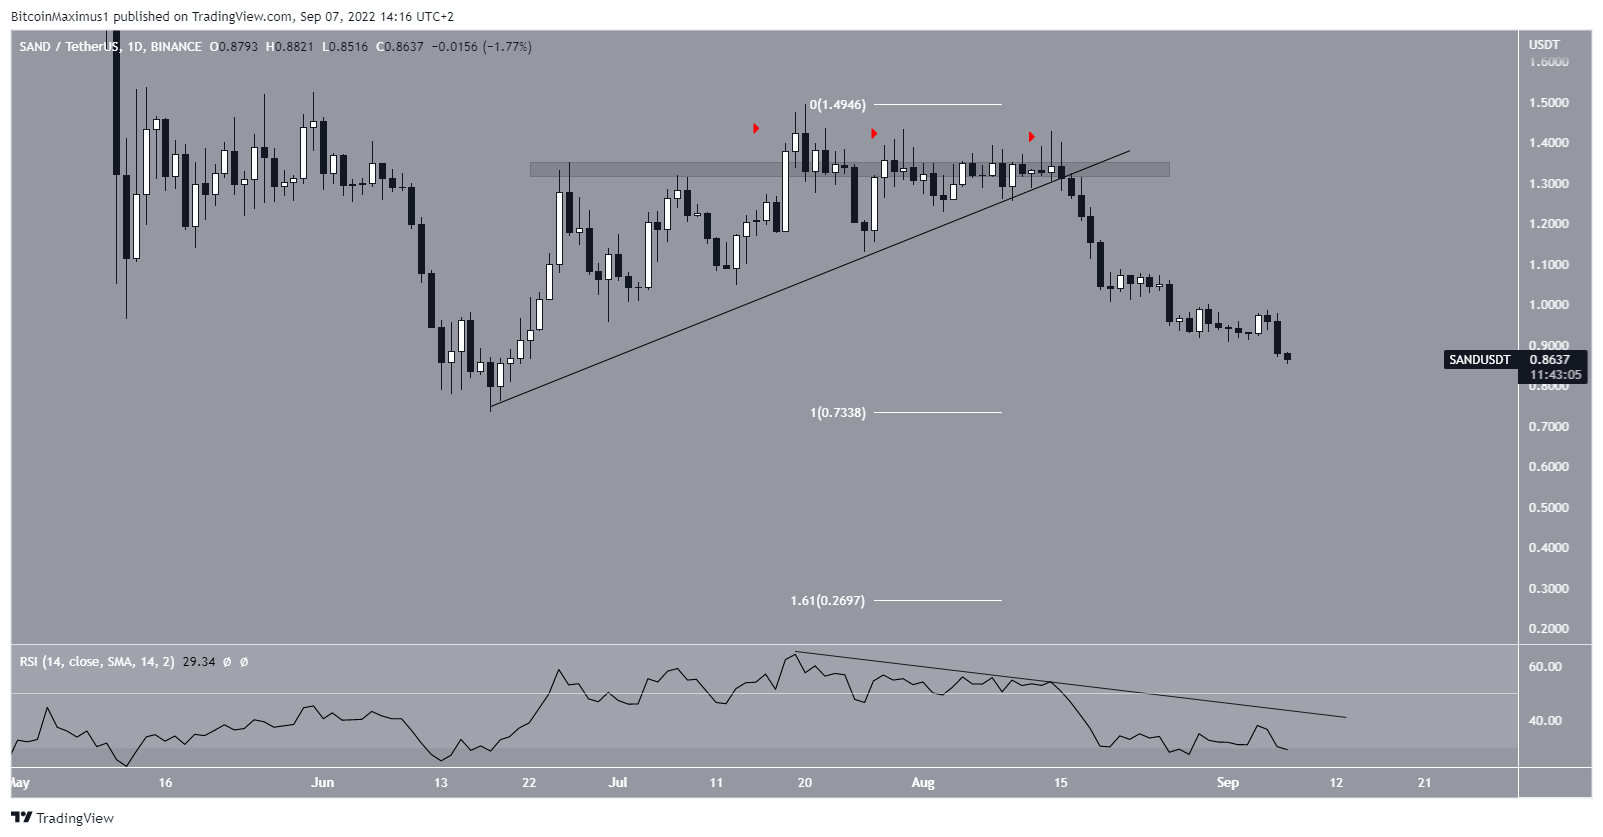
The daily chart shows that SAND broke down from an ascending support line on Aug 15. The breakdown transpired after several deviations above the $1.35 horizontal area. It is possible that the downward movement has occurred as a result of the ongoing Bitcoin (BTC) price drop.
Currently, SAND is only slightly above its June lows of $0.73. So far, there are no bullish reversal signs in place. The RSI is decreasing underneath a descending resistance line, is oversold and has not generated any bullish divergence.
So, it is possible that the price will break down below its June lows. In that case, the next closest support area would be at $0.27, created by the 1.61 external Fib retracement of the most recent upward movement.
Short-term pattern
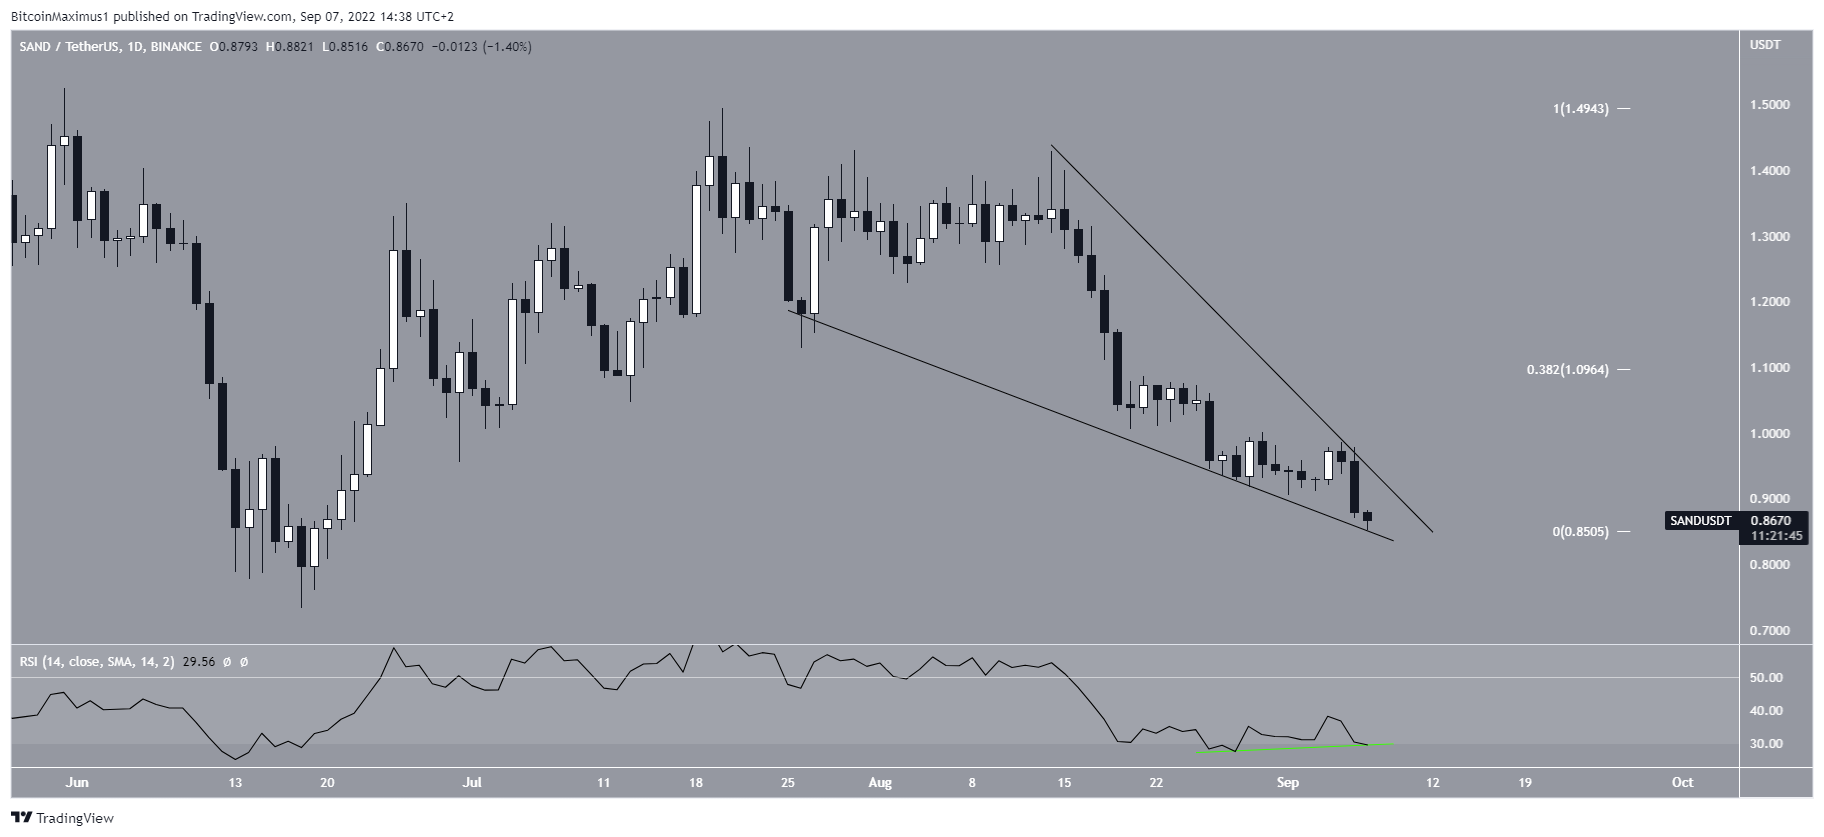
Finally, the six-hour chart shows that SAND could be trading inside a descending wedge. The wedge is considered a bullish pattern, meaning that a breakout from it would be expected.
In addition to this, the six-hour RSI has generated bullish divergence, supporting the possibility of a breakout.
However, due to the bearishness from the higher time frame, the most likely scenario would be that the breakout takes SAND to the $1 to $1.10 resistance area prior to another downward movement.
For Be[in]Crypto’s previous Bitcoin (BTC) analysis, click here
