


In this article, BeInCrypto takes a look at the eight altcoins that decreased the most over the past seven days (April 2-9).
This week’s hateful eight altcoins are:
- Klaytn (KLAY) – 23.22%
- Ankr (ANKR) – 15.06%
- Maker (MKR) – 13.52%
- BTMX (BTMX) – 12.75%
- Theta Fuel (TFUEL) – 12.65%
- Filecoin (FIL) – 11.93%
- Terra (LUNA) – 11.31%
- ICON (ICX) – 9.63%
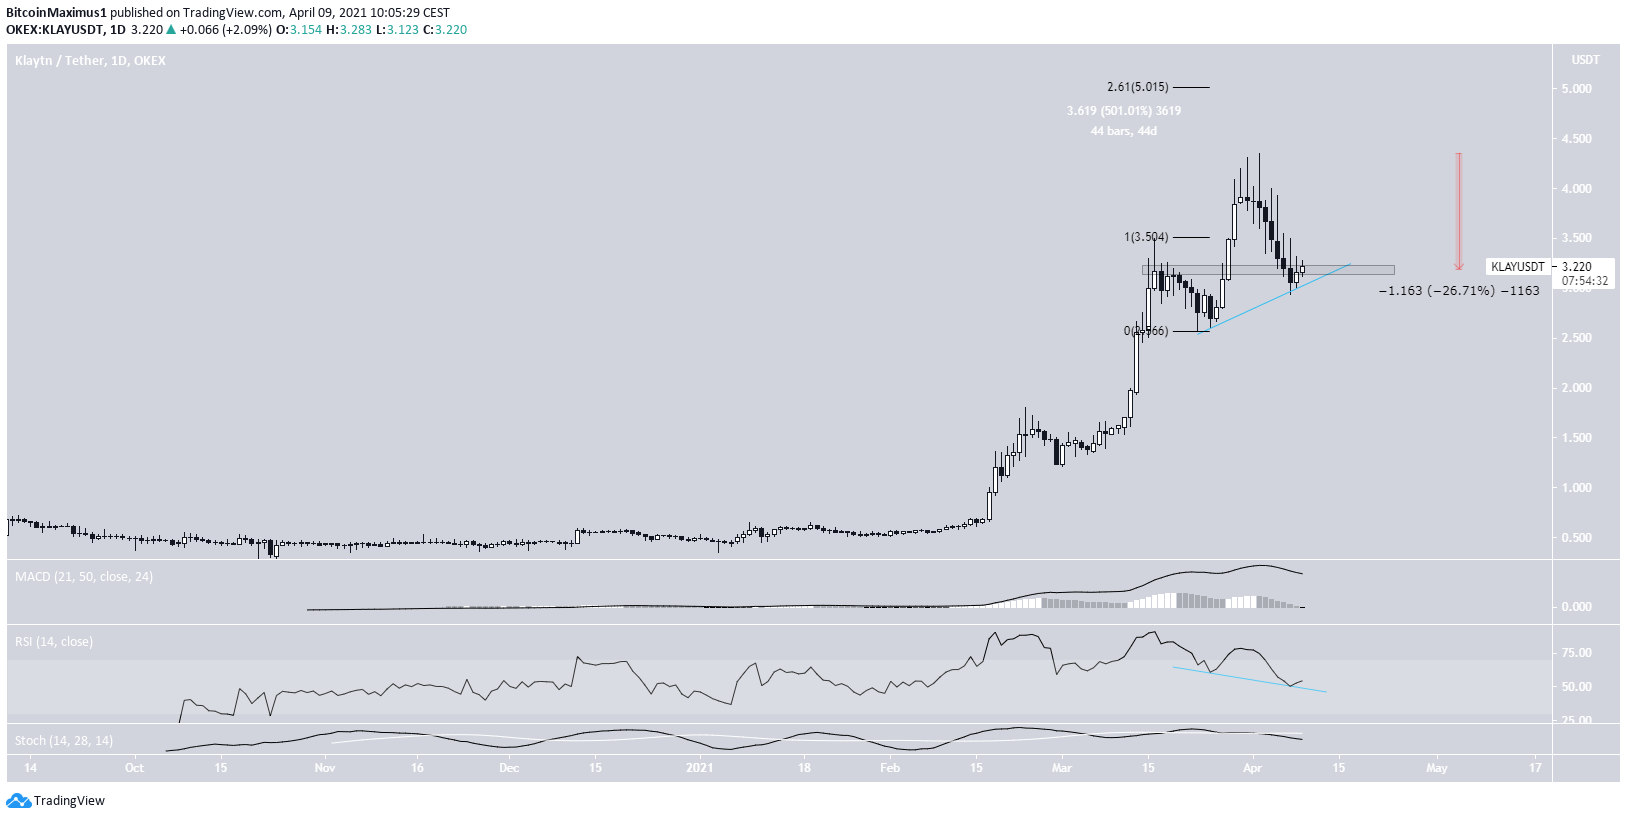
KLAY
KLAY has been moving upwards since Feb. 17, having increased by 500% in only 44 days.
However, it dropped once it reached an all-time high price of $4.35 on April 2. So far, it has decreased by 27% and has just reached the $3.20 support area.
There is a hidden bullish divergence at play, indicating possible trend continuation.
If the support area holds, KLAY could make another attempt at the all-time high. Beyond that, the next resistance level will likely be found at $5.
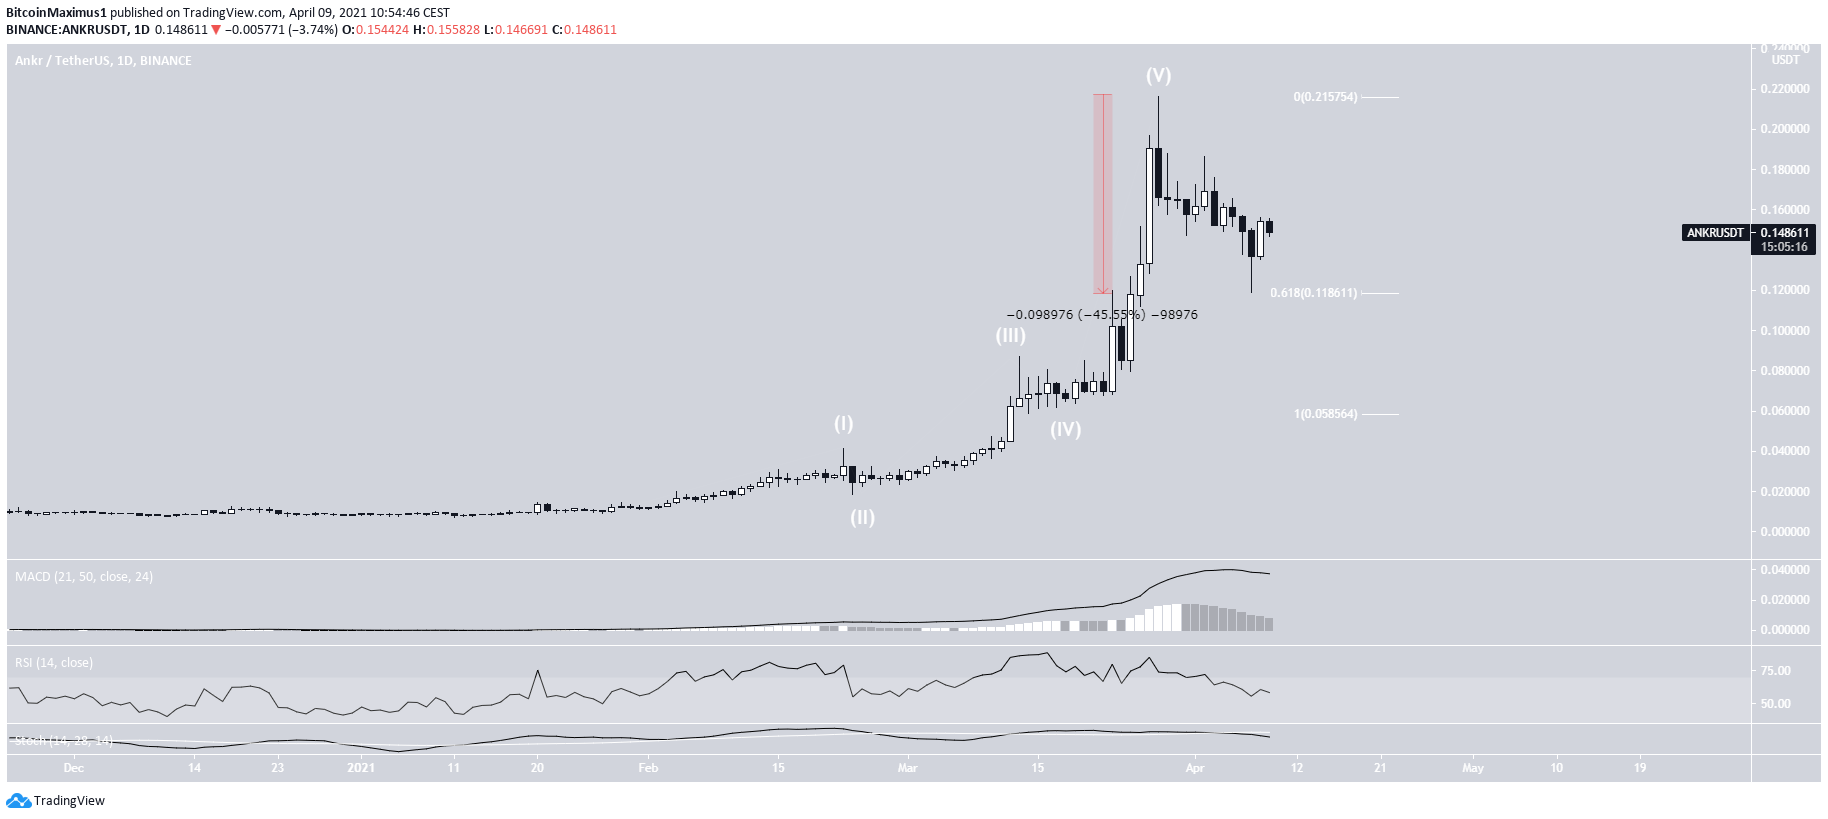
ANKR
ANKR increased rapidly in February/March, culminating with an all-time high price of $0.216 on March 28.
However, it proceeded to decrease for ten days, reaching a low of $0.119 on April 7. This marked a 45% drop from the highs.
ANKR has bounced since. It did so soon as it reached the 0.618 Fib retracement support.
However, technical indicators are bearish. Furthermore, it is possible that ANKR has completed its long-term bullish impulse and now appears to be in a corrective phase.
On a positive note, ANKR is releasing its first NFT on April 2.
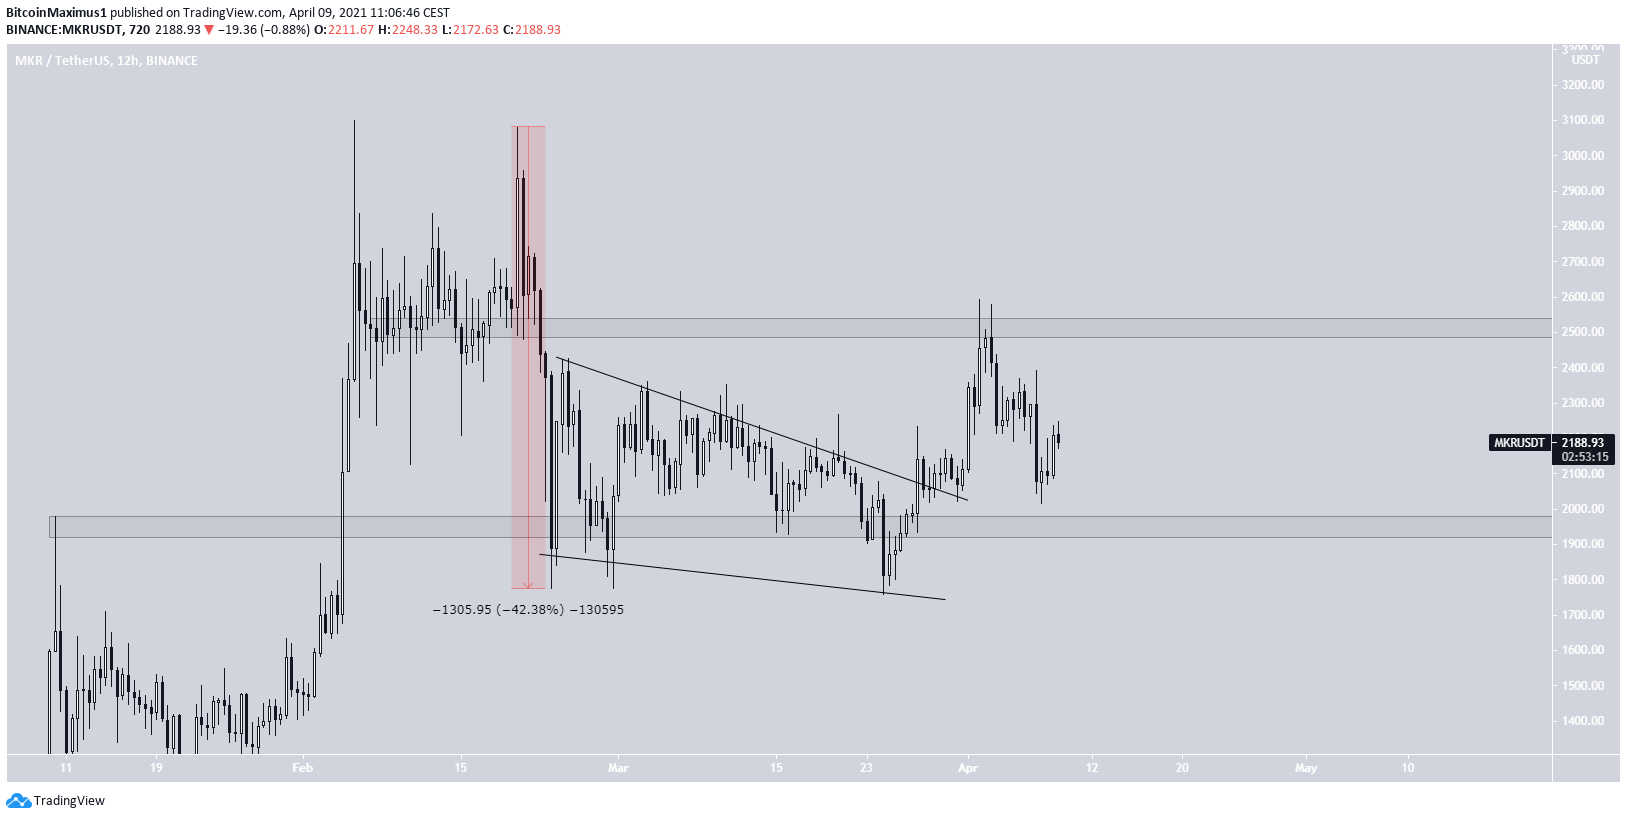
MKR
MKR has been moving downwards since Feb. 20. The initial drop measured 42%.
Afterward, it began trading inside a descending wedge. I broke out from this pattern on March 28.
Since then, it’s been trading inside a range between $1,900-$2,500.
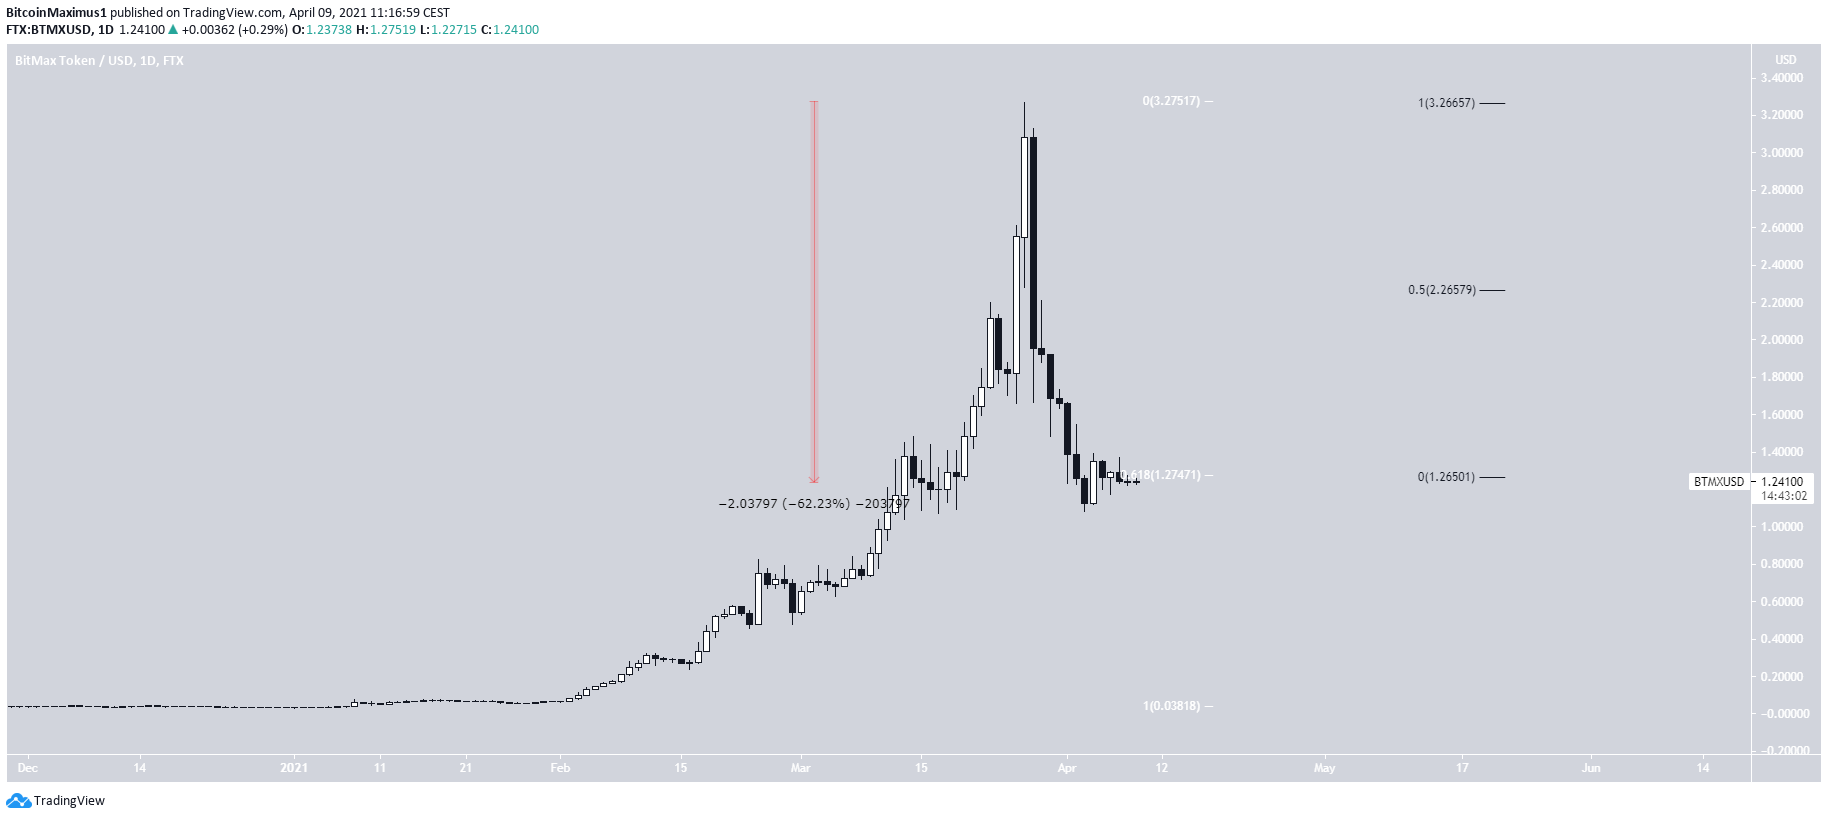
BTMX
BTMX increased by more than 400% in March, culminating with an all-time high price of $3.27 on March 27.
However, the drop that followed was just as swift. It measured 60% and took BTMX to the 0.618 Fib retracement level at $1.26.
Despite being at crucial horizontal and Fib supports, BTMX is now showing bullish reversal signs.
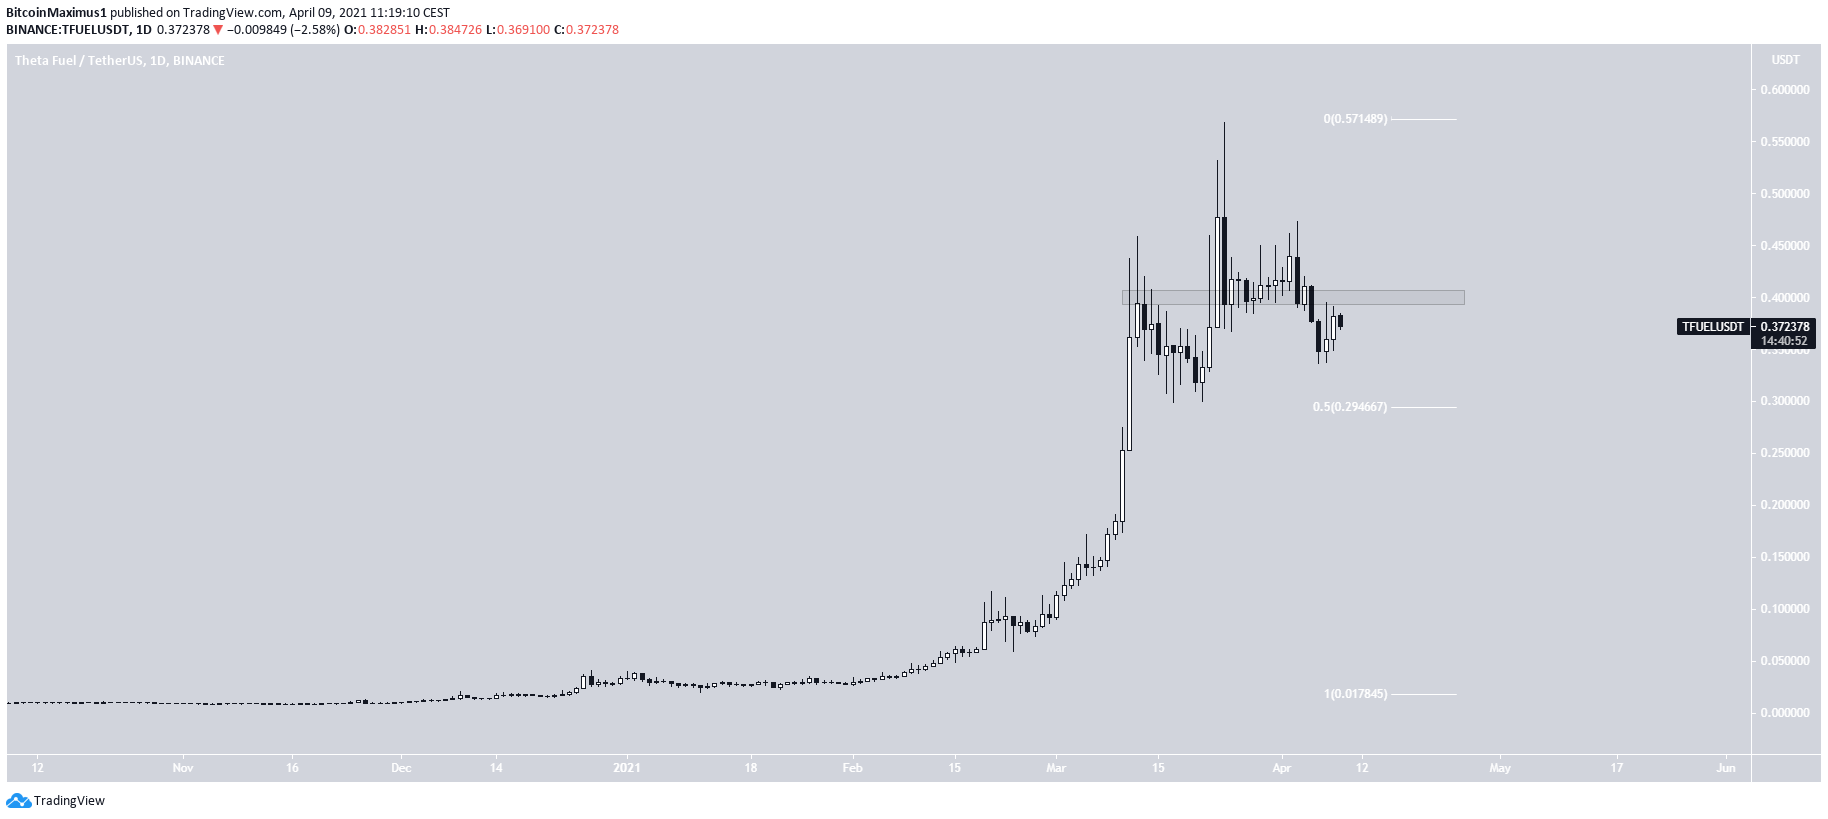
TFUEL
TFUEL has been decreasing since March 24, when it reached a high of $0.568. While it initially bounced, it has fallen below the $0.40 area since.
Until it reclaims this level, the trend cannot be considered bullish.
The closest support area is found at $0.295.
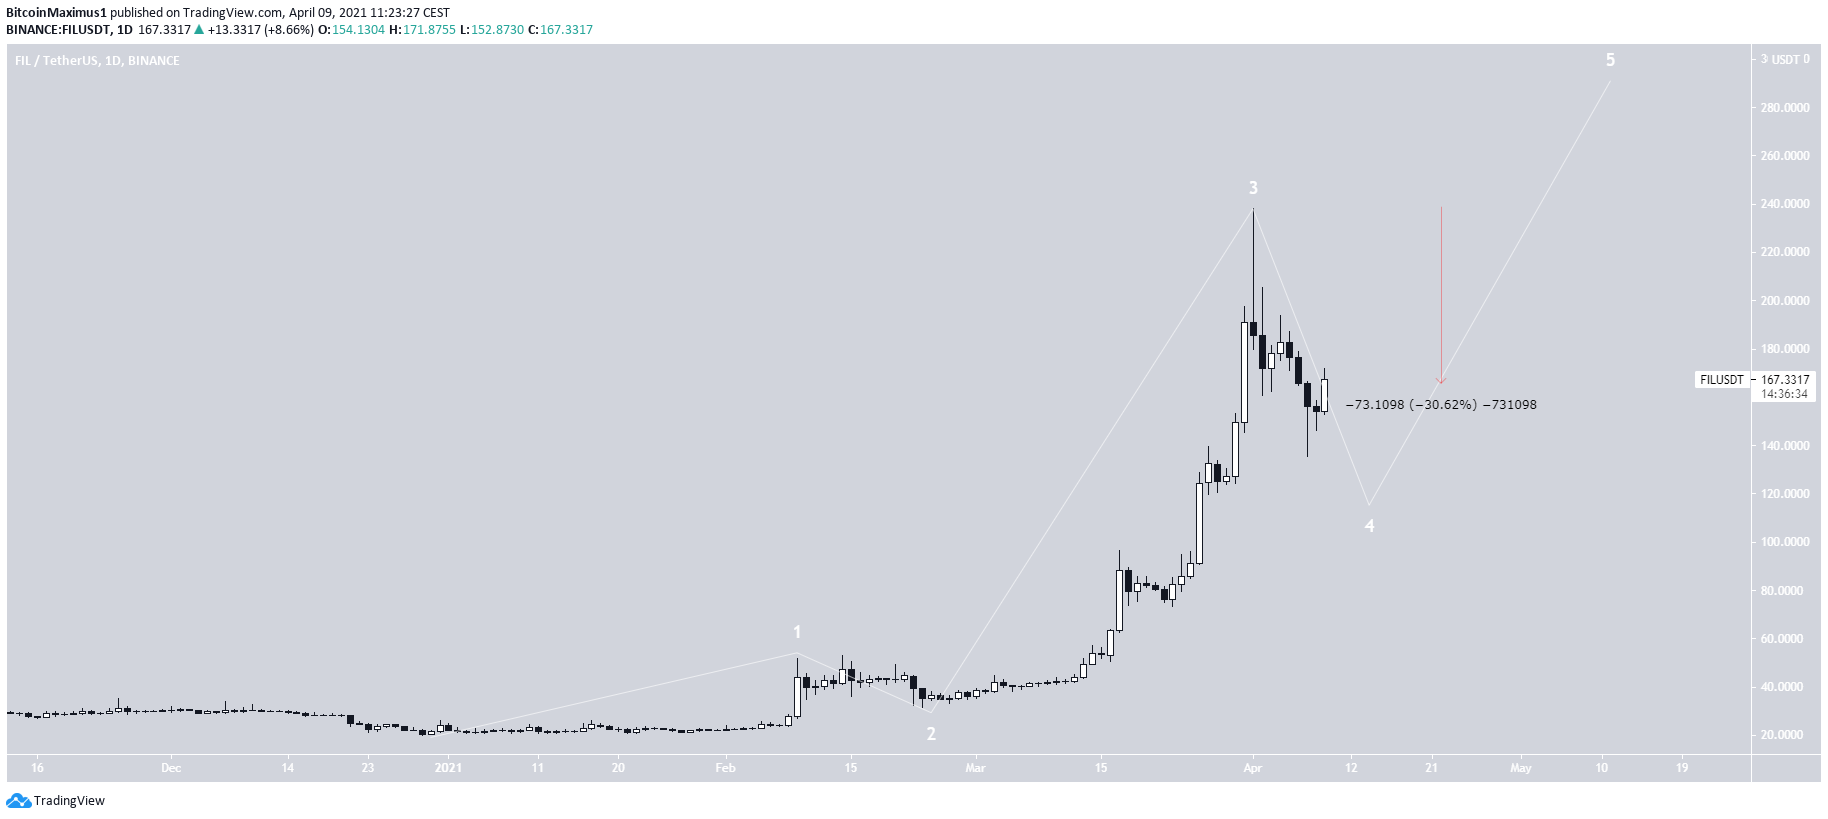
FIL
FIL has been moving downwards since April 1. On this day it reached an all-time high price of $238.20 and created a shooting star candlestick.
Despite the ongoing decrease, which has so far measured 30%, FIL seems to be in wave four of a bullish impulse.
Therefore, another upward move seems likely. In addition to this, FIL was listed on the NAMI exchange on April 5. This could have had a positive effect on its price.
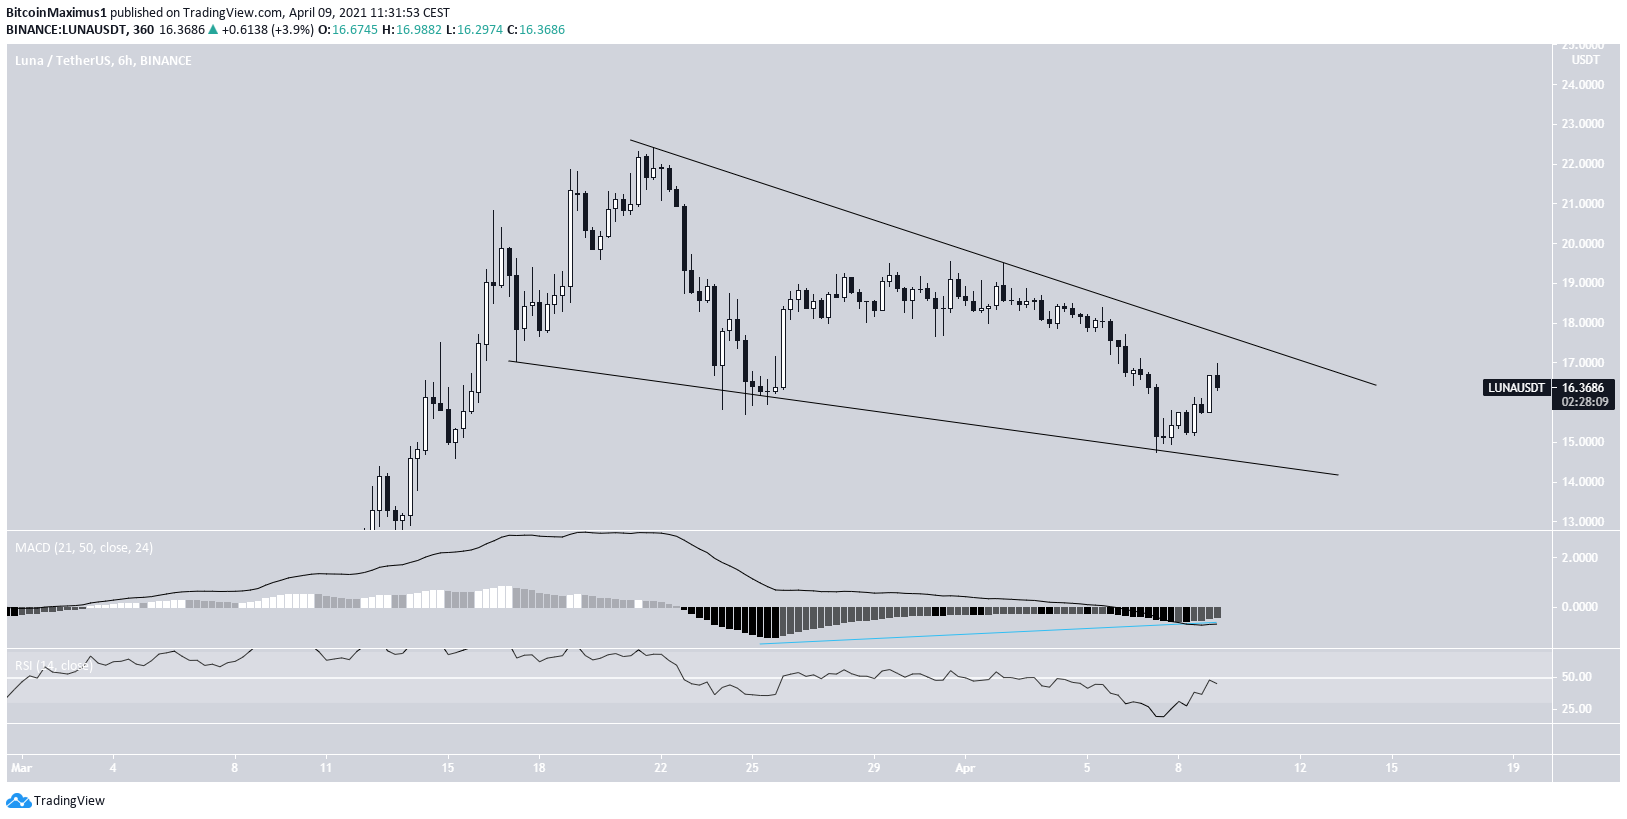
LUNA
LUNA has been decreasing since reaching a high of $22.40 on March 21.
The decrease has taken the shape of a descending wedge, which is normally considered a bullish reversal pattern.
In addition, there is a bullish divergence developing in the MACD, indicating a potential reversal.
If so, LUNA could make another attempt at its all-time highs.
On April 1, it launched Kash, a mobile banking application.
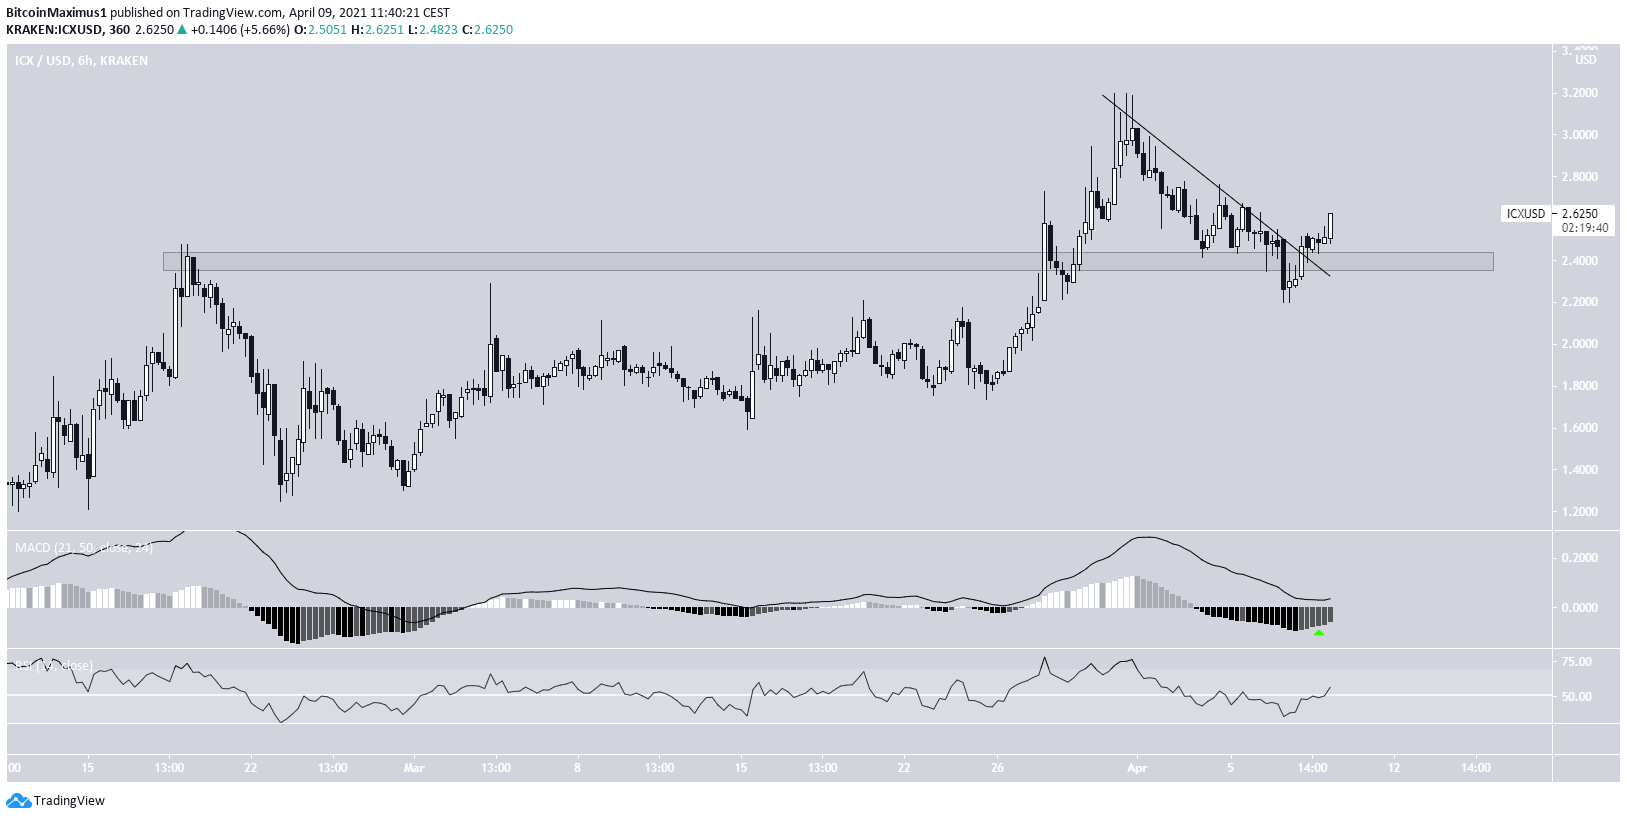
ICX
ICX has been moving downwards since March 31, when it reached a high of $3.20.
However, it bounced once it reached the $2.40 support area and broke out from a descending resistance line after.
Technical indicators are bullish, and the token seems to be making another attempt at moving towards the $3.20 highs.
For BeInCrypto’s latest bitcoin (BTC) analysis, click here.


