
In this article, BeInCrypto takes a look at eight altcoins that decreased the most over the past seven days (March 19 – March 26).
This week’s Hateful 8 altcoins are:
- Avalanche (AVAX) – 21.50%
- Cosmos (ATOM) – 20.13%
- SushiSwap (SUSHI) – 19.01%
- Polygon (MATIC) – 18.93%
- Fantom (FTM) – 18.45%
- Chiliz (CHZ) – 18.30%
- Near Protocol (NEAR) – 17.87%
- UMA (UMA) – 17.73%
AVAX
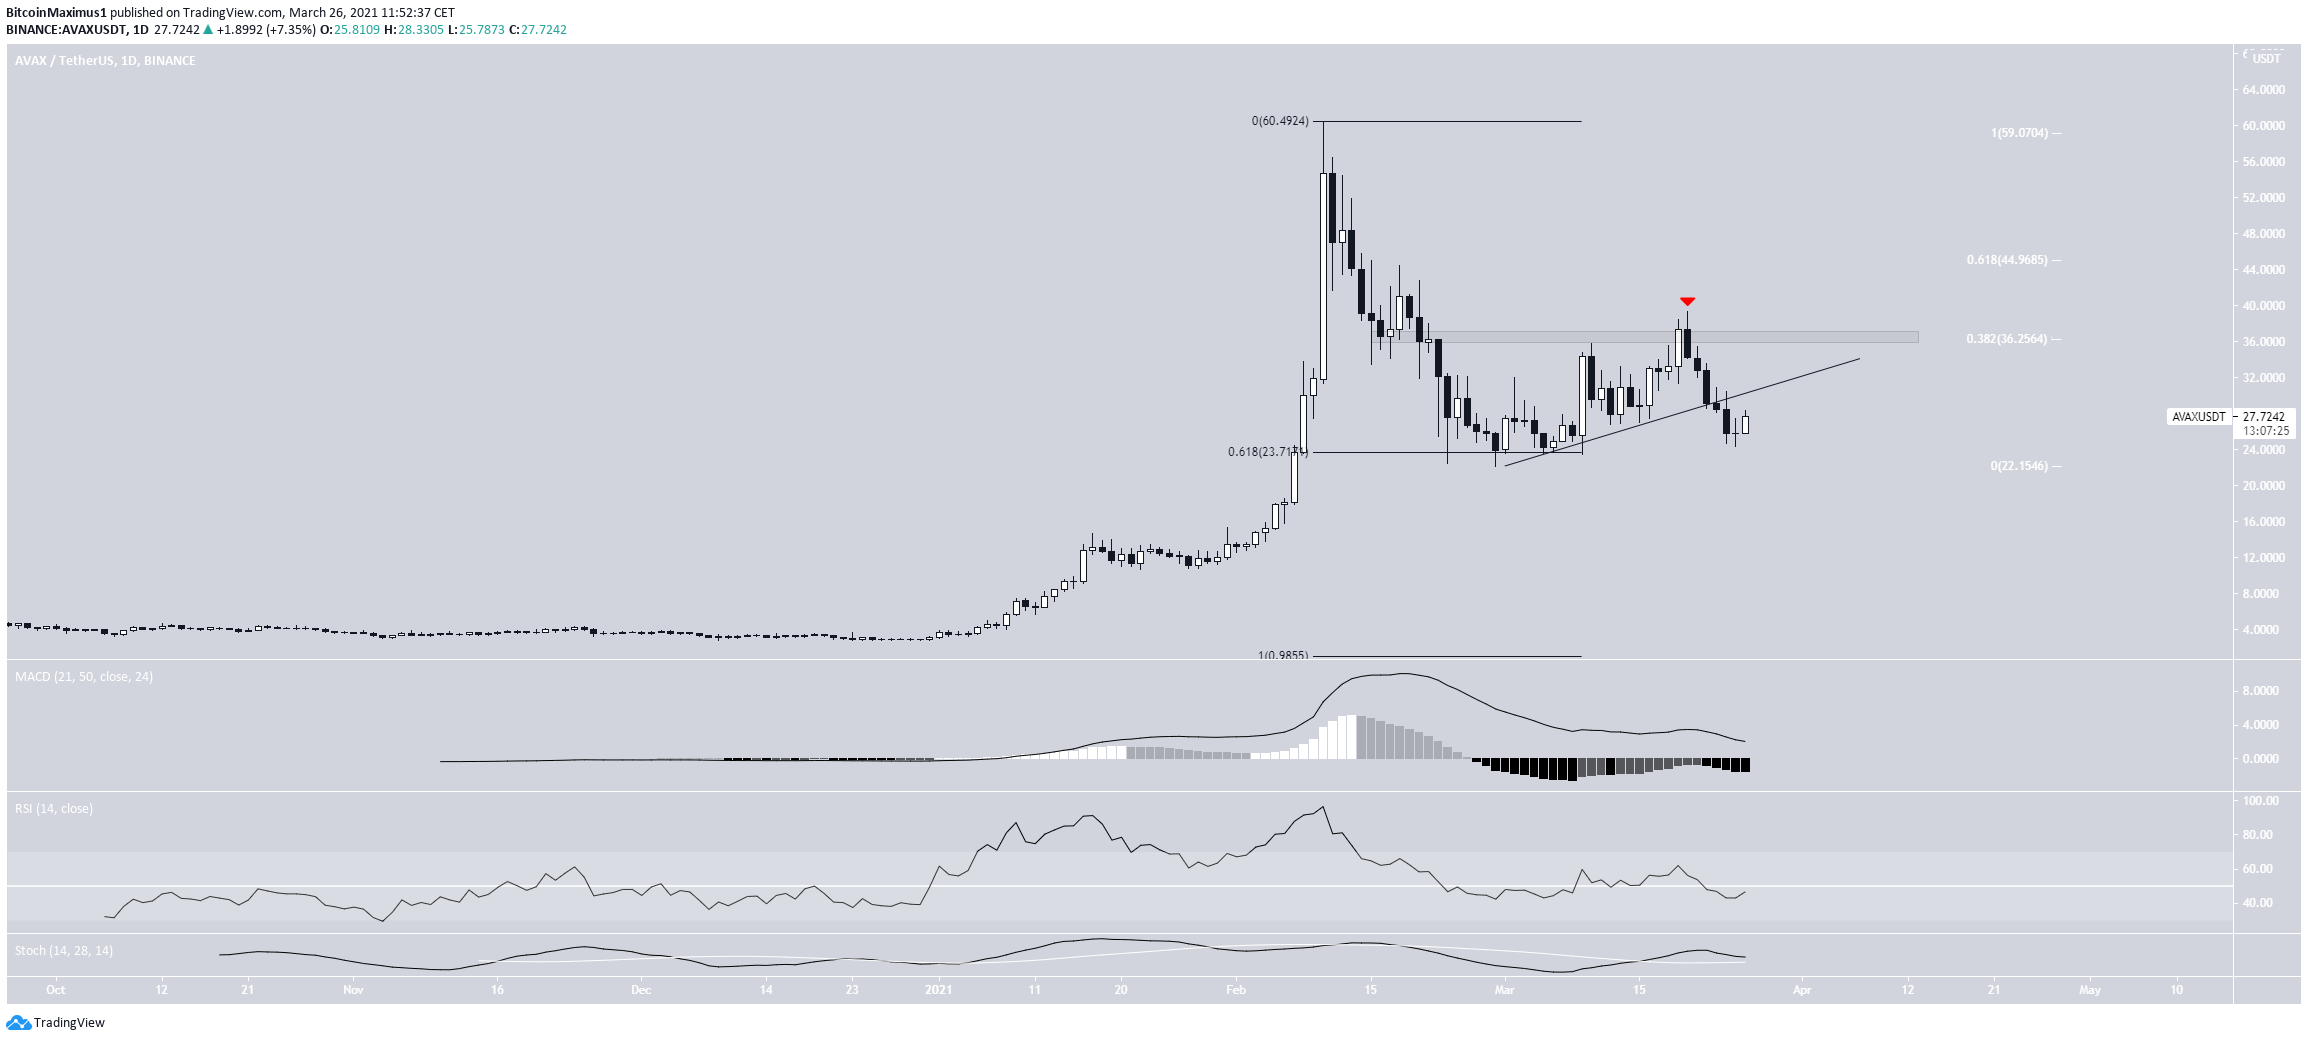
AVAX has been decreasing since an all-time high price of $60.30 was reached on Feb. 10.
So far, it has managed to reach a low of $22.12, doing so on Feb. 28. The token reached the low close to the 0.618 Fib retracement level. While AVAX bounced since, it was rejected by the $36.50 resistance area, which is the 0.382 Fib retracement of the previous downward movement.
Afterward, it broke down from an ascending support line and has returned to the $23.70 support area once more.
While AVAX could bounce in the short-term, the trend cannot be considered bullish until the $36.50 area is reclaimed. Technical indicators in the daily time-frame are relatively neutral.
ATOM
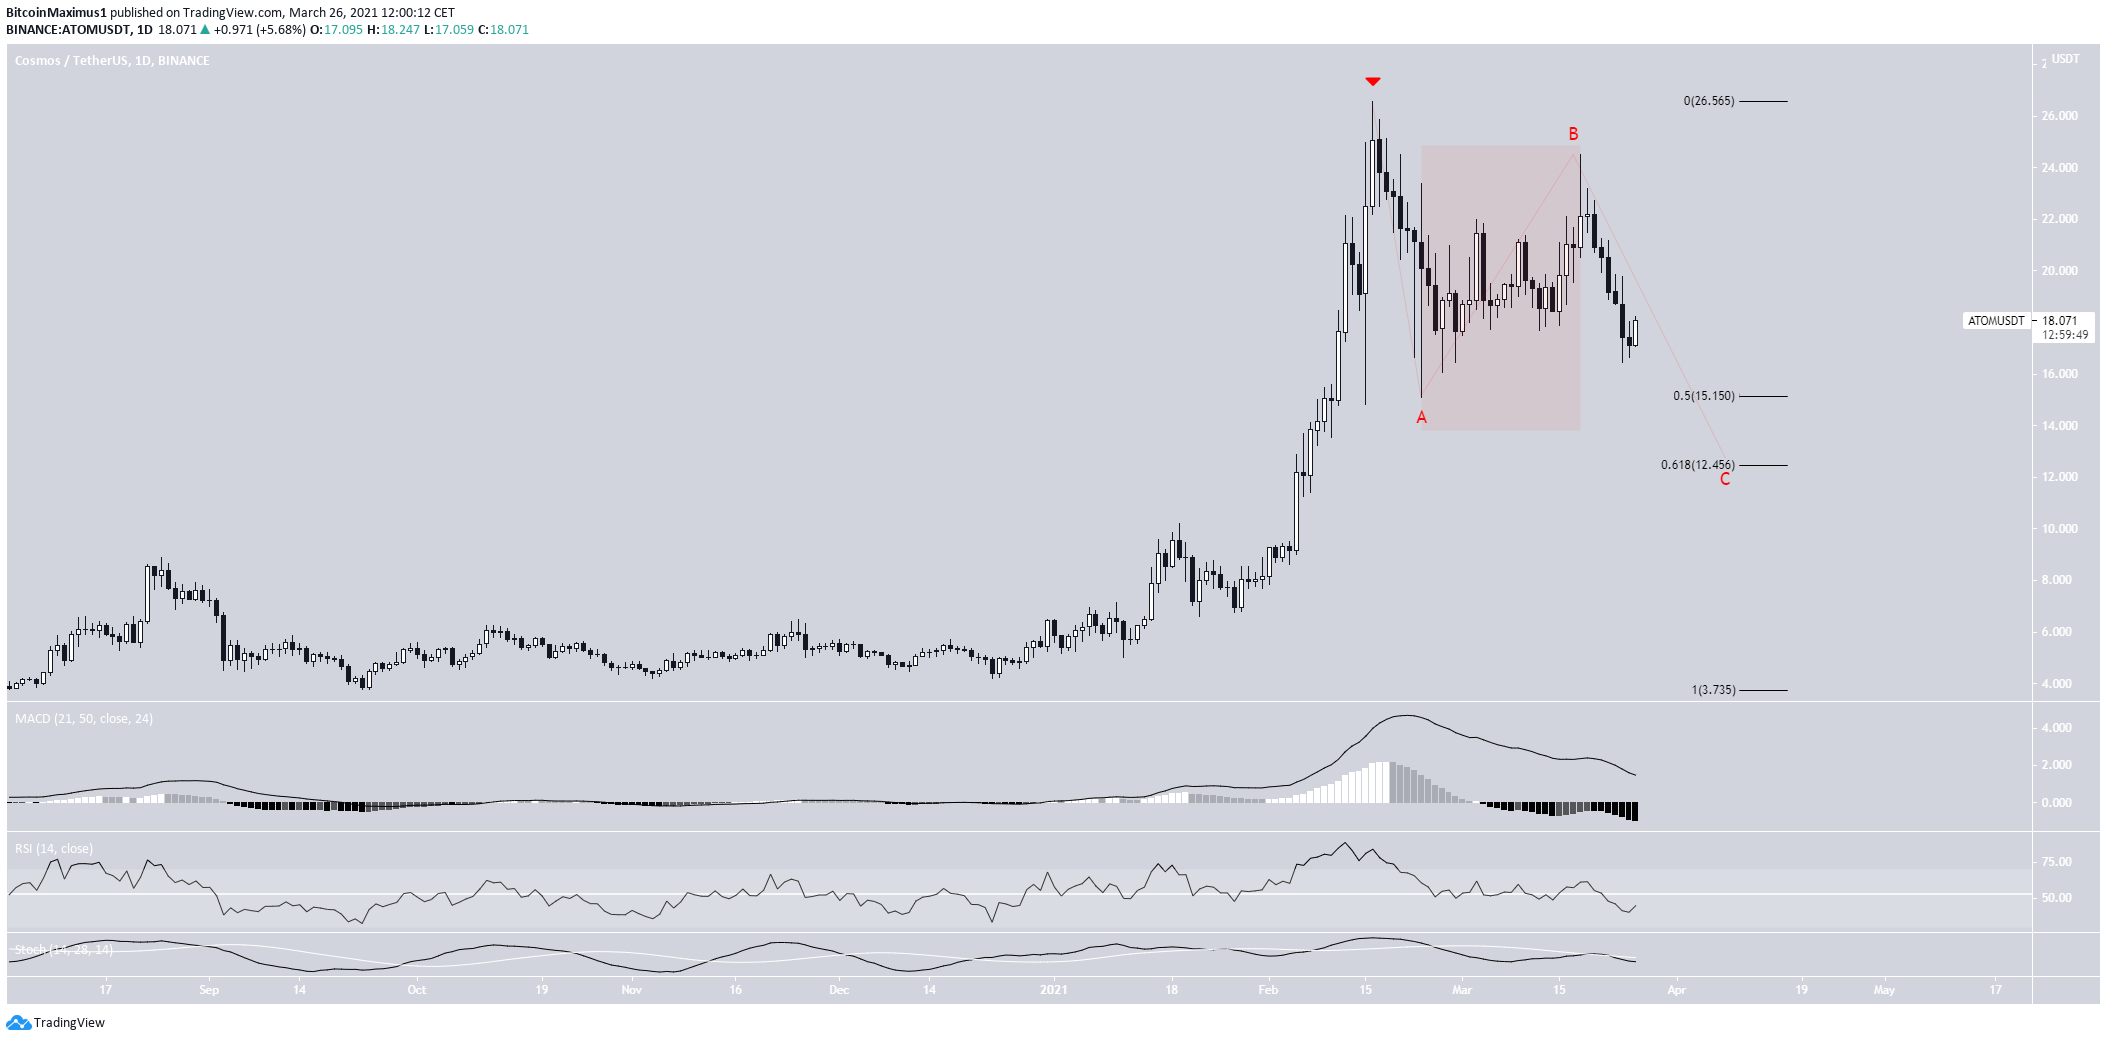
ATOM has been decreasing since reaching an all-time high price of $26.55 on Feb. 16. Seven days later, it reached a low of $15.11. This was done right at the 0.5 Fib retracement support level and initiated a significant bounce.
However, the ensuing upward movement looked corrective. Furthermore, technical indicators in the daily time-frame are bearish.
Therefore, it is likely that ATOM is in the C wave of an A-B-C corrective structure. If so, it could decrease to the 0.618 Fib retracement support level at $12.58.
SUSHI
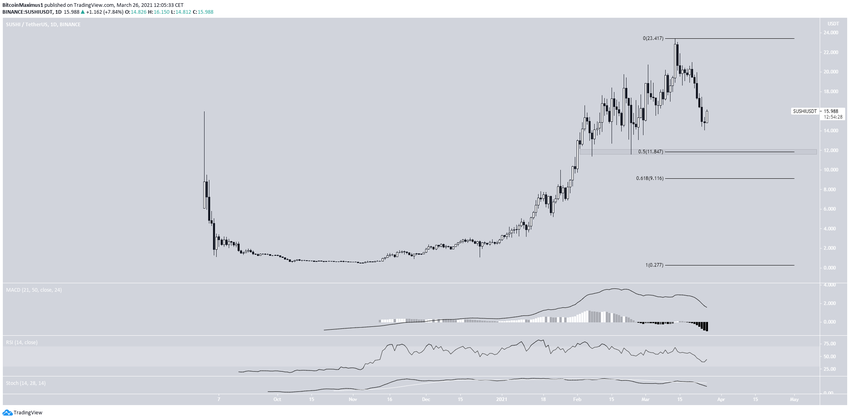
SUSHI has been decreasing since March 13, when it reached an all-time high price of $23.41.
So far, it has dropped by 33%.
Technical indicators are bearish, and there are no reversal signs.
Therefore, it is likely that SUSHI drops towards the $11.85 support level. This is both the 0.5 Fib retracement level of the entire upward movement and a horizontal support area.
The next support is found at $9.11, the 0.618 Fib retracement level.
MATIC
MATIC has been decreasing since March 11, when it reached a high of $0.54. So far, it has dropped by 42%.
Technical indicators in the daily time-frame are bearish.
However, MATIC is approaching the $0.277 support level, the 0.5 Fib retracement of the entire upward movement.
Therefore, despite indicators being bearish, a bounce is expected once MATIC gets there, at least in the short-term.

FTM
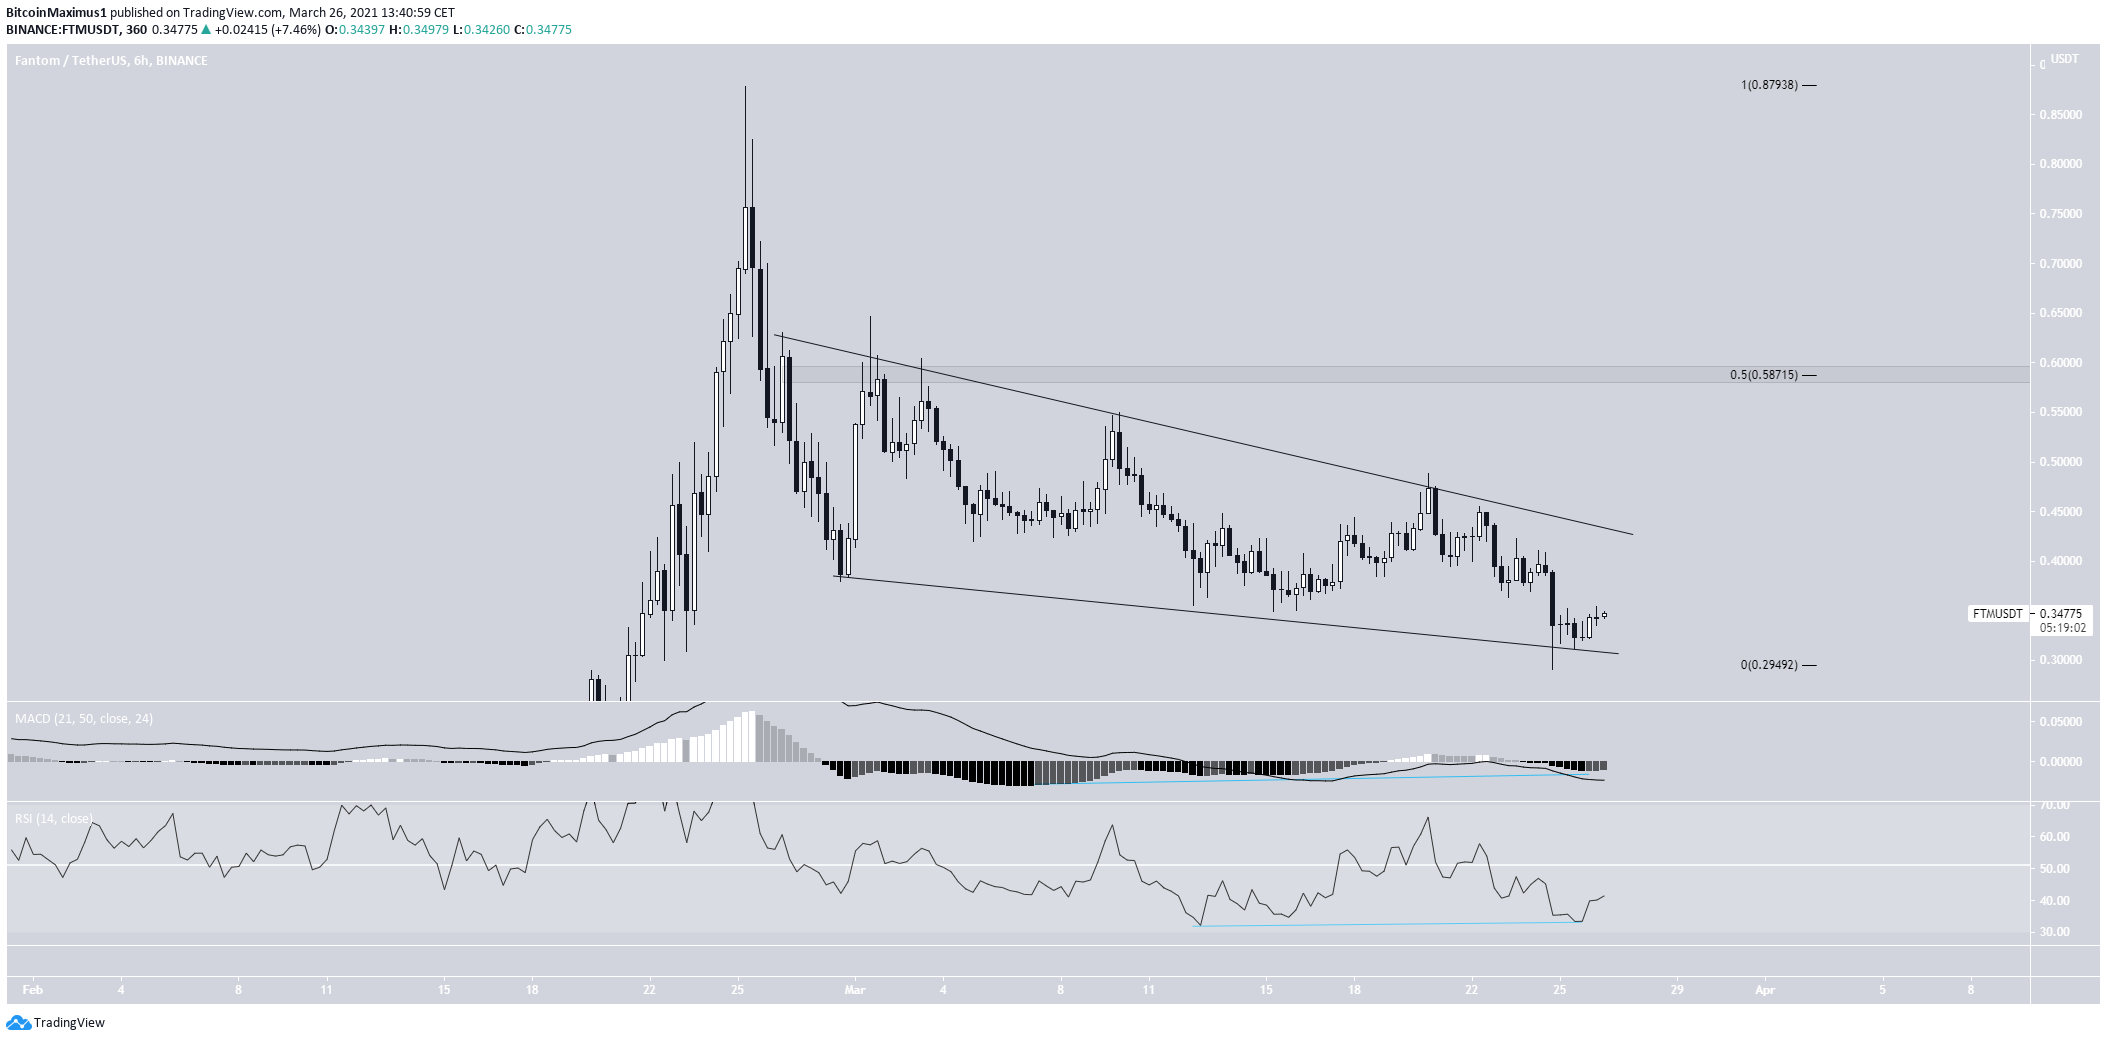
FTM has been moving downwards since reaching a high of $0.87 on Feb. 25. However, the descent stalled on Feb. 28, and FTM has been trading inside a descending wedge since. This is known as a bullish reversal pattern.
Furthermore, there is bullish divergence developing in both the RSI & MACD.
Therefore, a breakout from this pattern would be expected. If so, the token’s price would find the next resistance at $0.587.
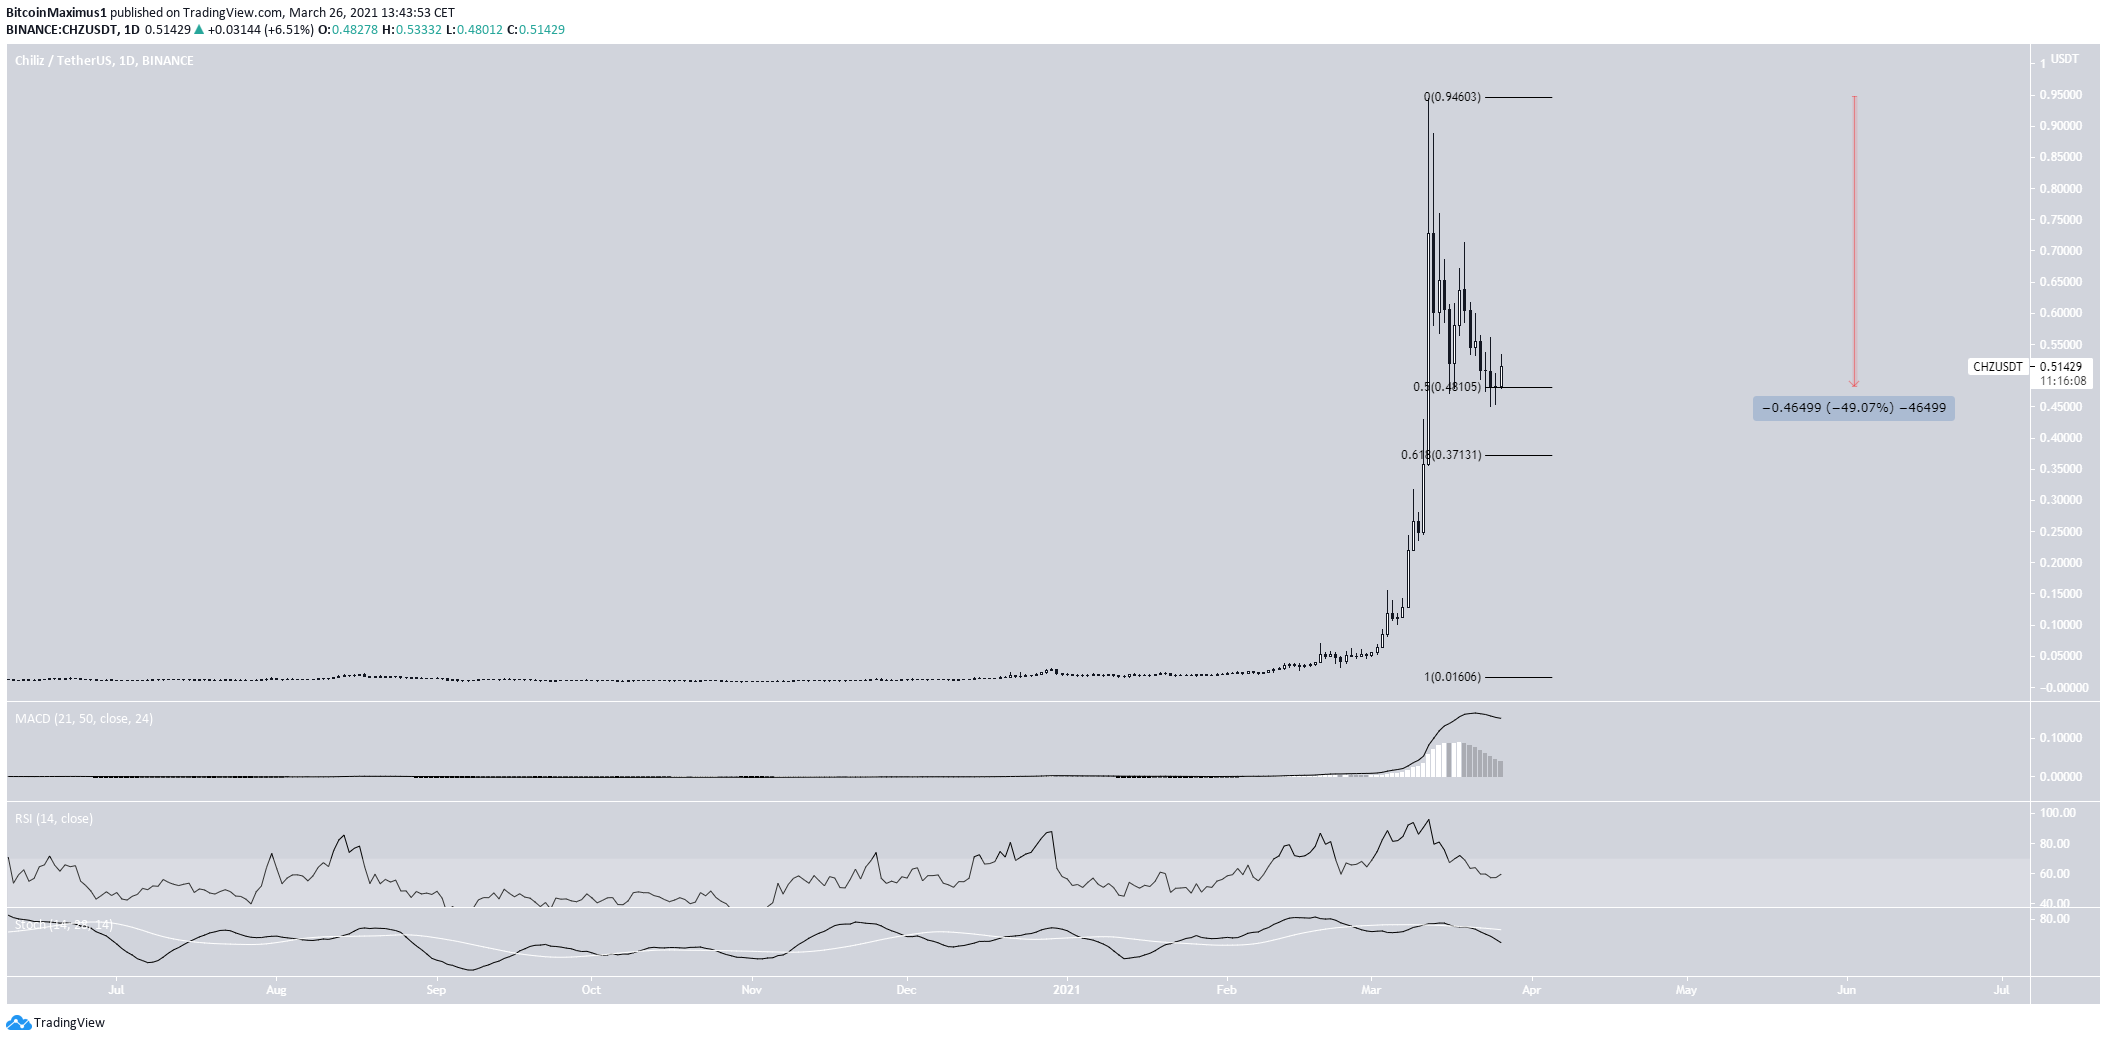
CHZ
CHZ has been moving downwards since reaching an all-time high of $0.944 on March 12. So far, it has dropped by nearly 50% and is trading at the 0.5 Fib retracement level.
While a short-term bounce is expected to occur, technical indicators are bearish. Therefore, it is likely that CHZ eventually drops to the 0.618 Fib retracement support at $0.37.
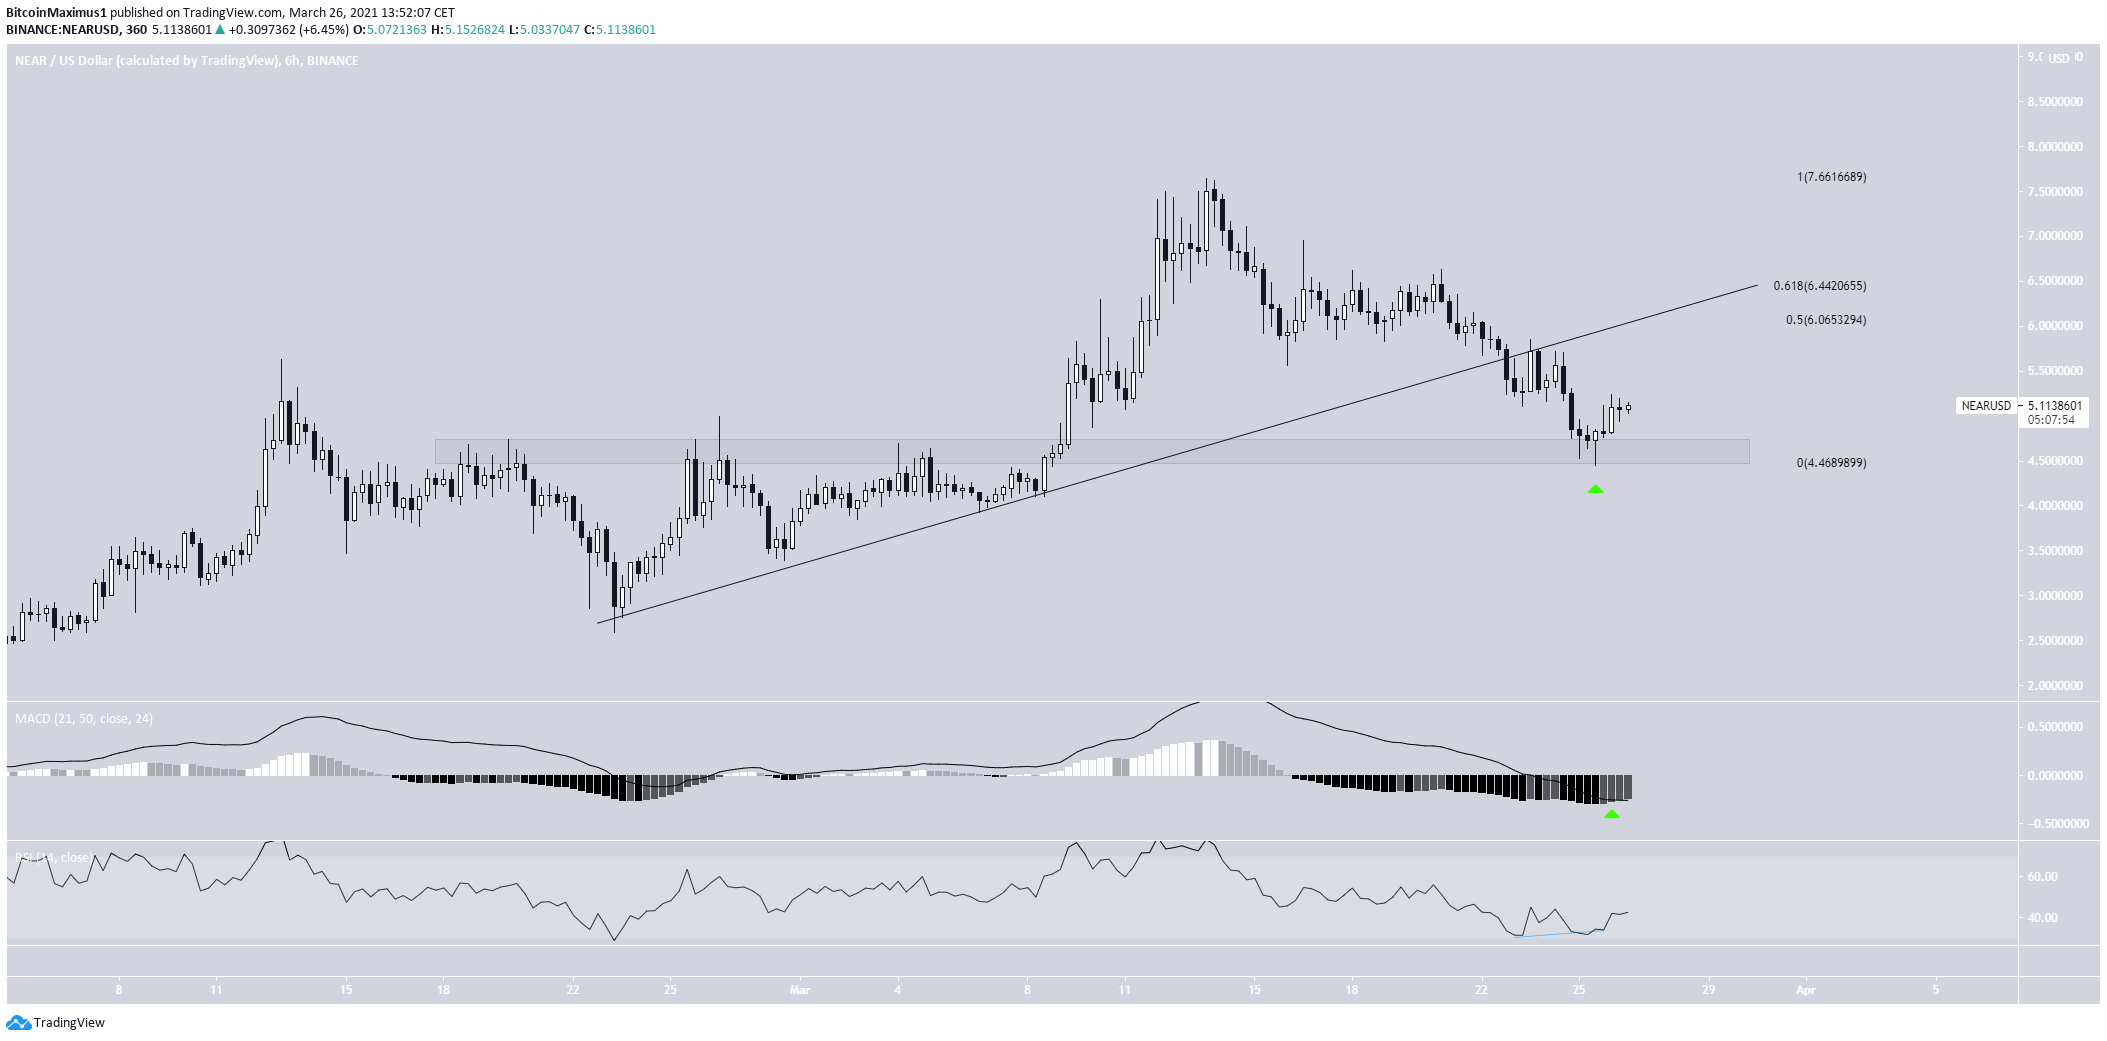
NEAR
NEAR has been decreasing since March 13, when it reached a high of $7.34. On March 21, it broke down from an ascending support line. This movement took it to the $4.50 support area.
There is some bullish divergence in the RSI, and the MACD has given a bullish reversal sign. Therefore, an upward move towards the $6.0-$6.45 area could occur.
This would also cause a re-test of the support line from which NEAR broke down.
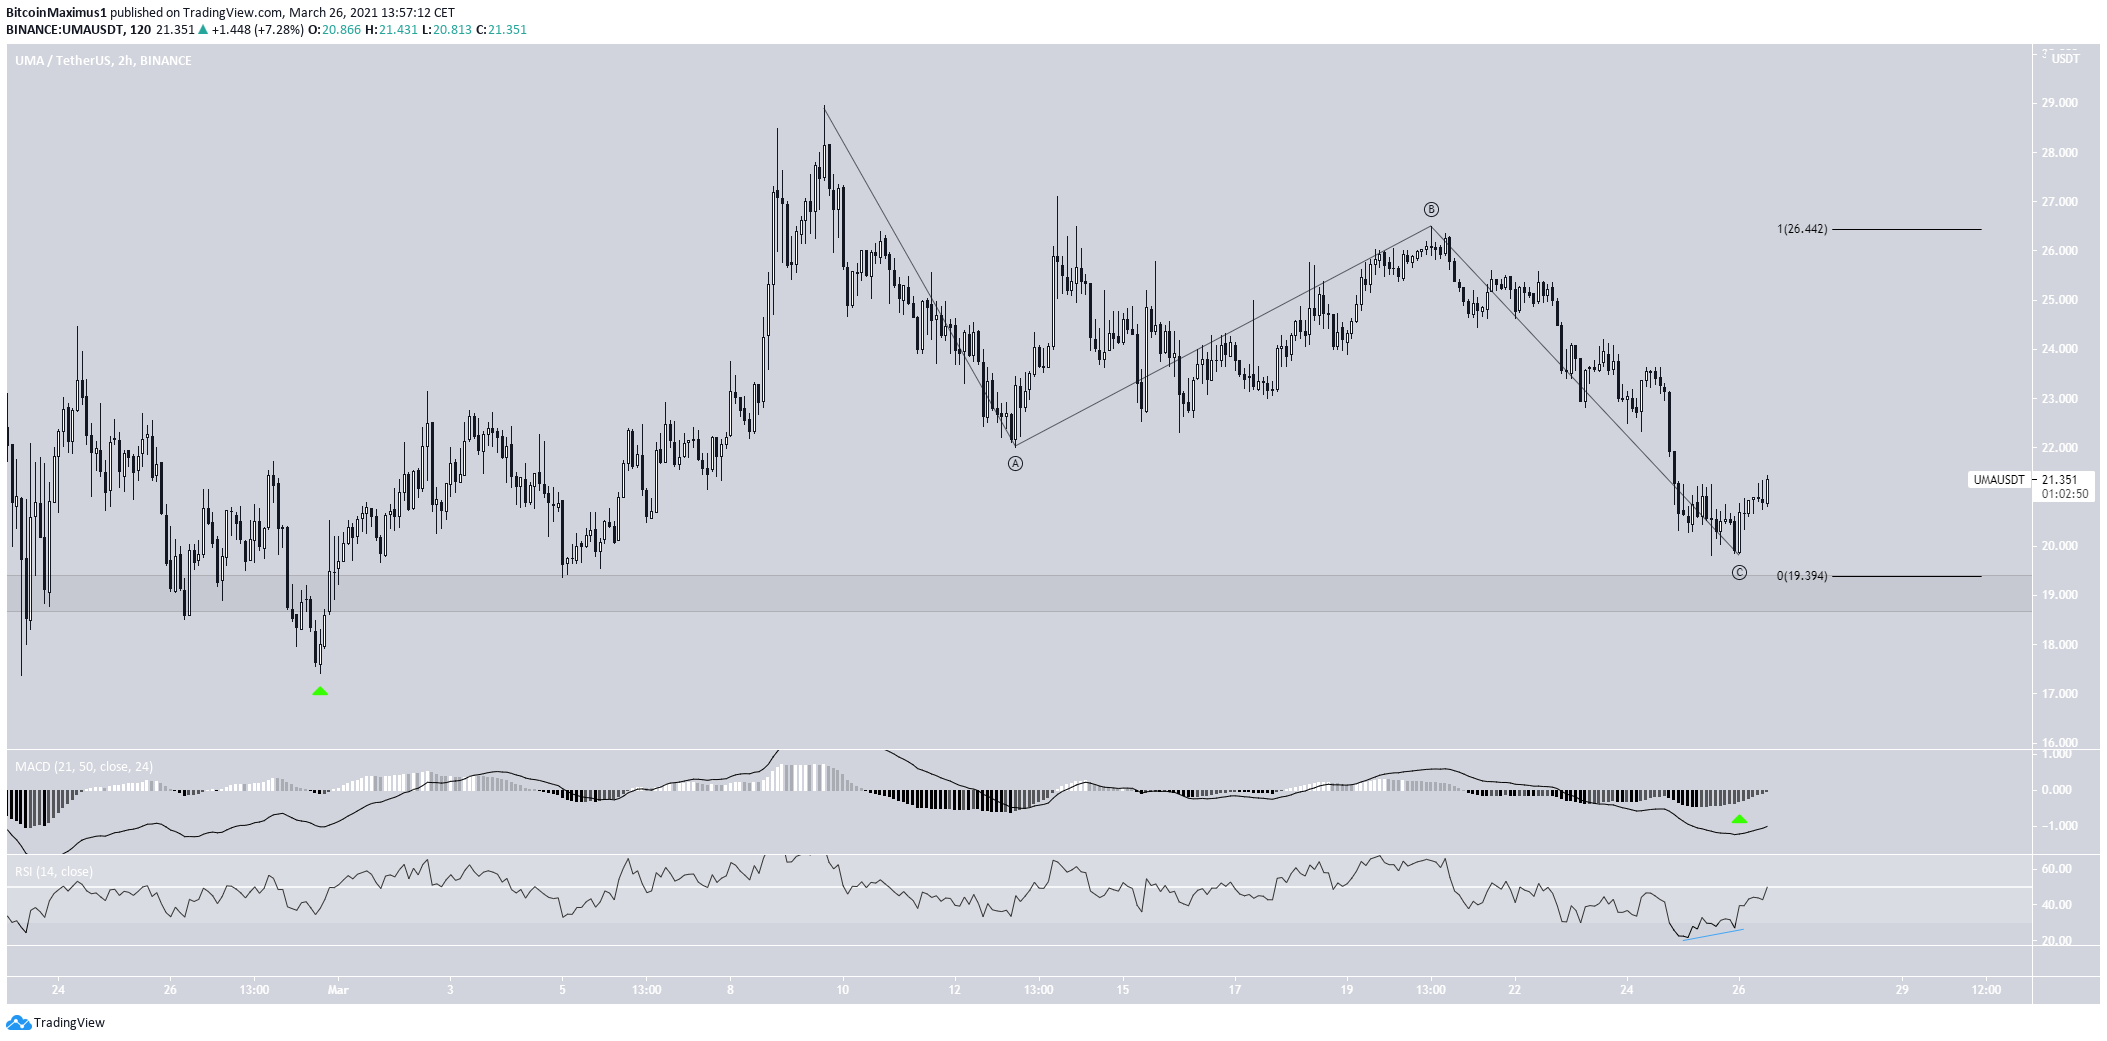
UMA
On Feb. 28, UMA bounced at the $19.20 support area. This increase took it to a high of $28.29, where it was rejected. UMA has been decreasing since.
Currently, it is trading very close to the $19.20 support area.
Short-term indicators are bullish. Furthermore, the decrease looks like a completed A-B-C structure, in which waves A:C had a 1:1 ratio.
Therefore, it is possible that UMA will soon reverse its trend.
For BeInCrypto’s latest bitcoin (BTC) analysis, click here.
