
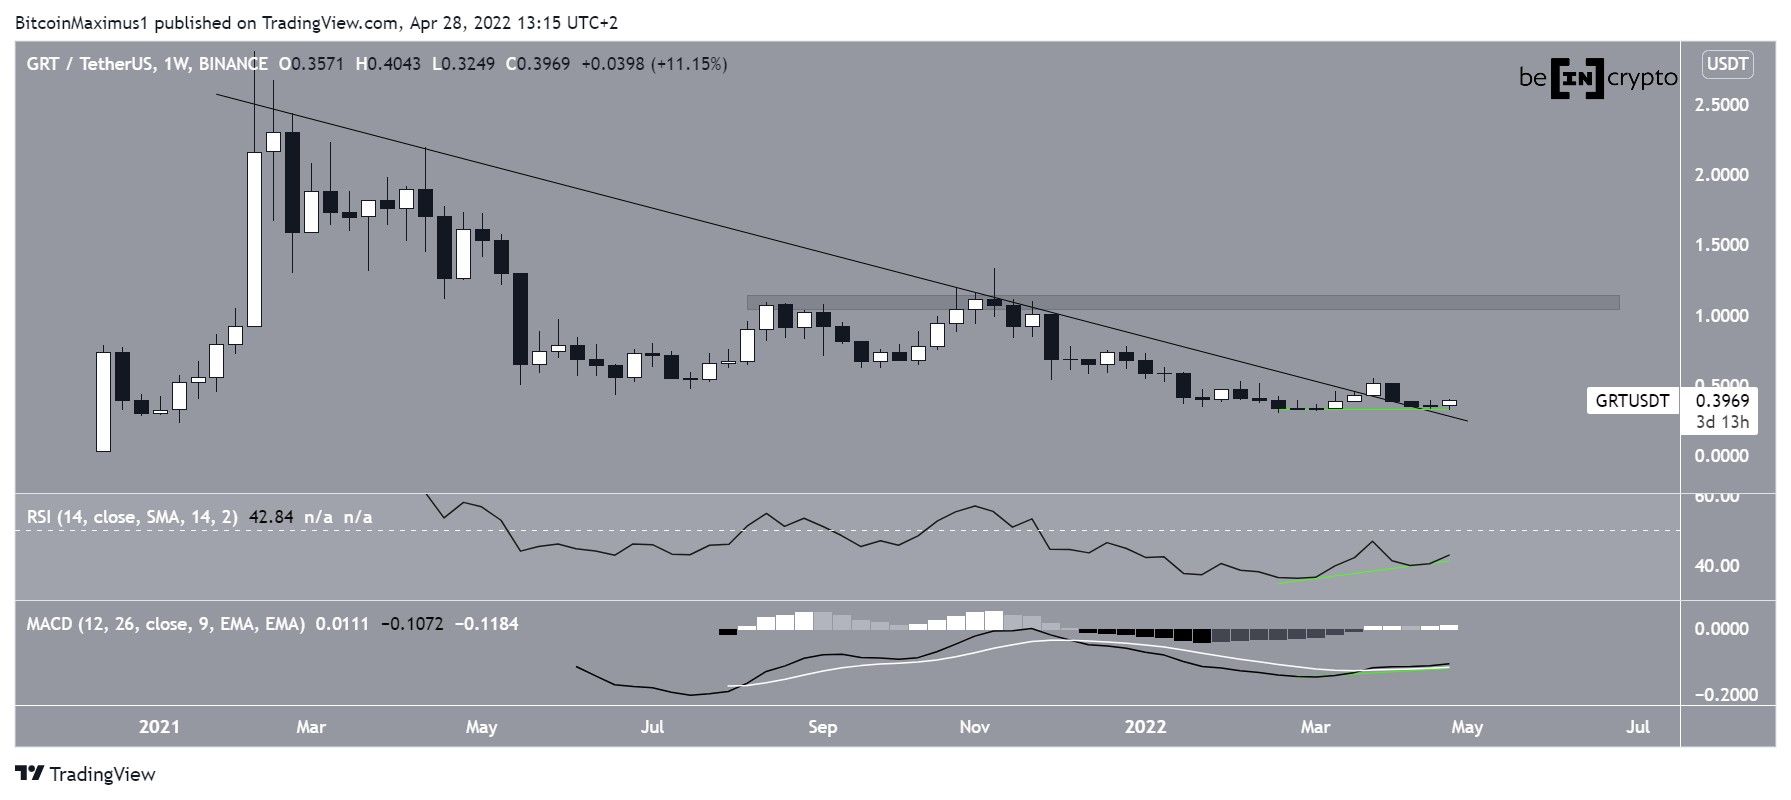
The Graph (GRT) has been trading inside a range between $0.385 and $0.525 since the beginning of the year. It could be in the process of creating a bullish pattern.
GRT had been decreasing alongside a descending resistance line since reaching an all-time high price of $2.88 on Feb 12 last year. The downward movement led to a low of $0.30 on Feb 24 this year. The price has been moving upwards since.
Due to the long upper wicks, it is not certain if GRT has broken out from the resistance line or if it is still following it. However, it seems that the price has broken out, despite not having initiated a significant upward movement yet.
More importantly, both the RSI and MACD have generated significant bullish divergences (green lines). It is worth noting that this is the first divergence that has transpired in the weekly time frame.
If the upward movement continues, the next closest resistance area would be at $1.10.
Bullish pattern
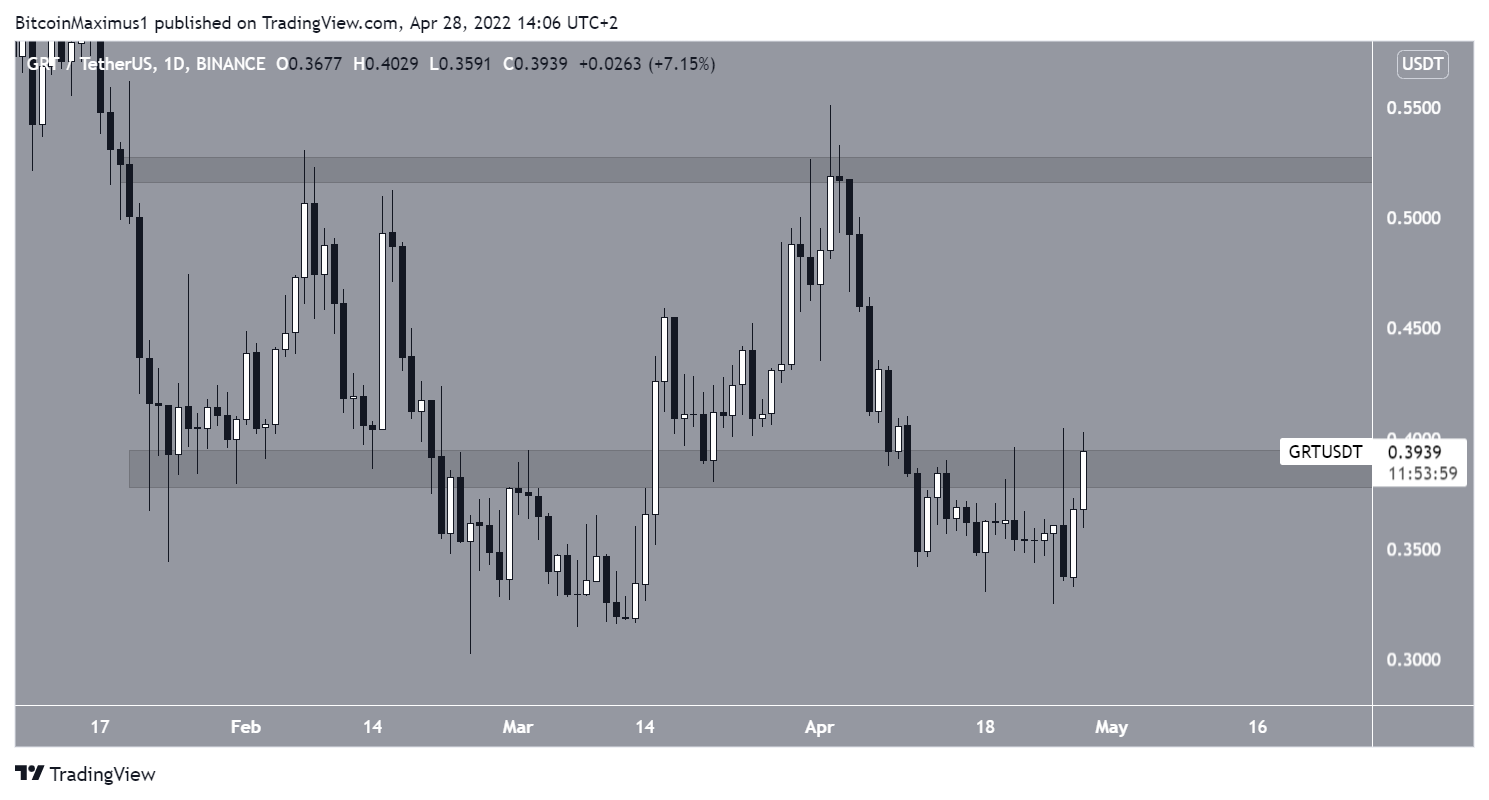
The daily chart shows that GRT is trading inside the $0.385 resistance area. The area had previously acted as support in Feb before the price broke down in March.
If the price is successful in reclaiming it, it could increase all the way to the $0.525 resistance area.
Cryptocurrency trader @CryptoKindie tweeted a chart of GRT, stating that the price is in the process of creating a bullish pattern.
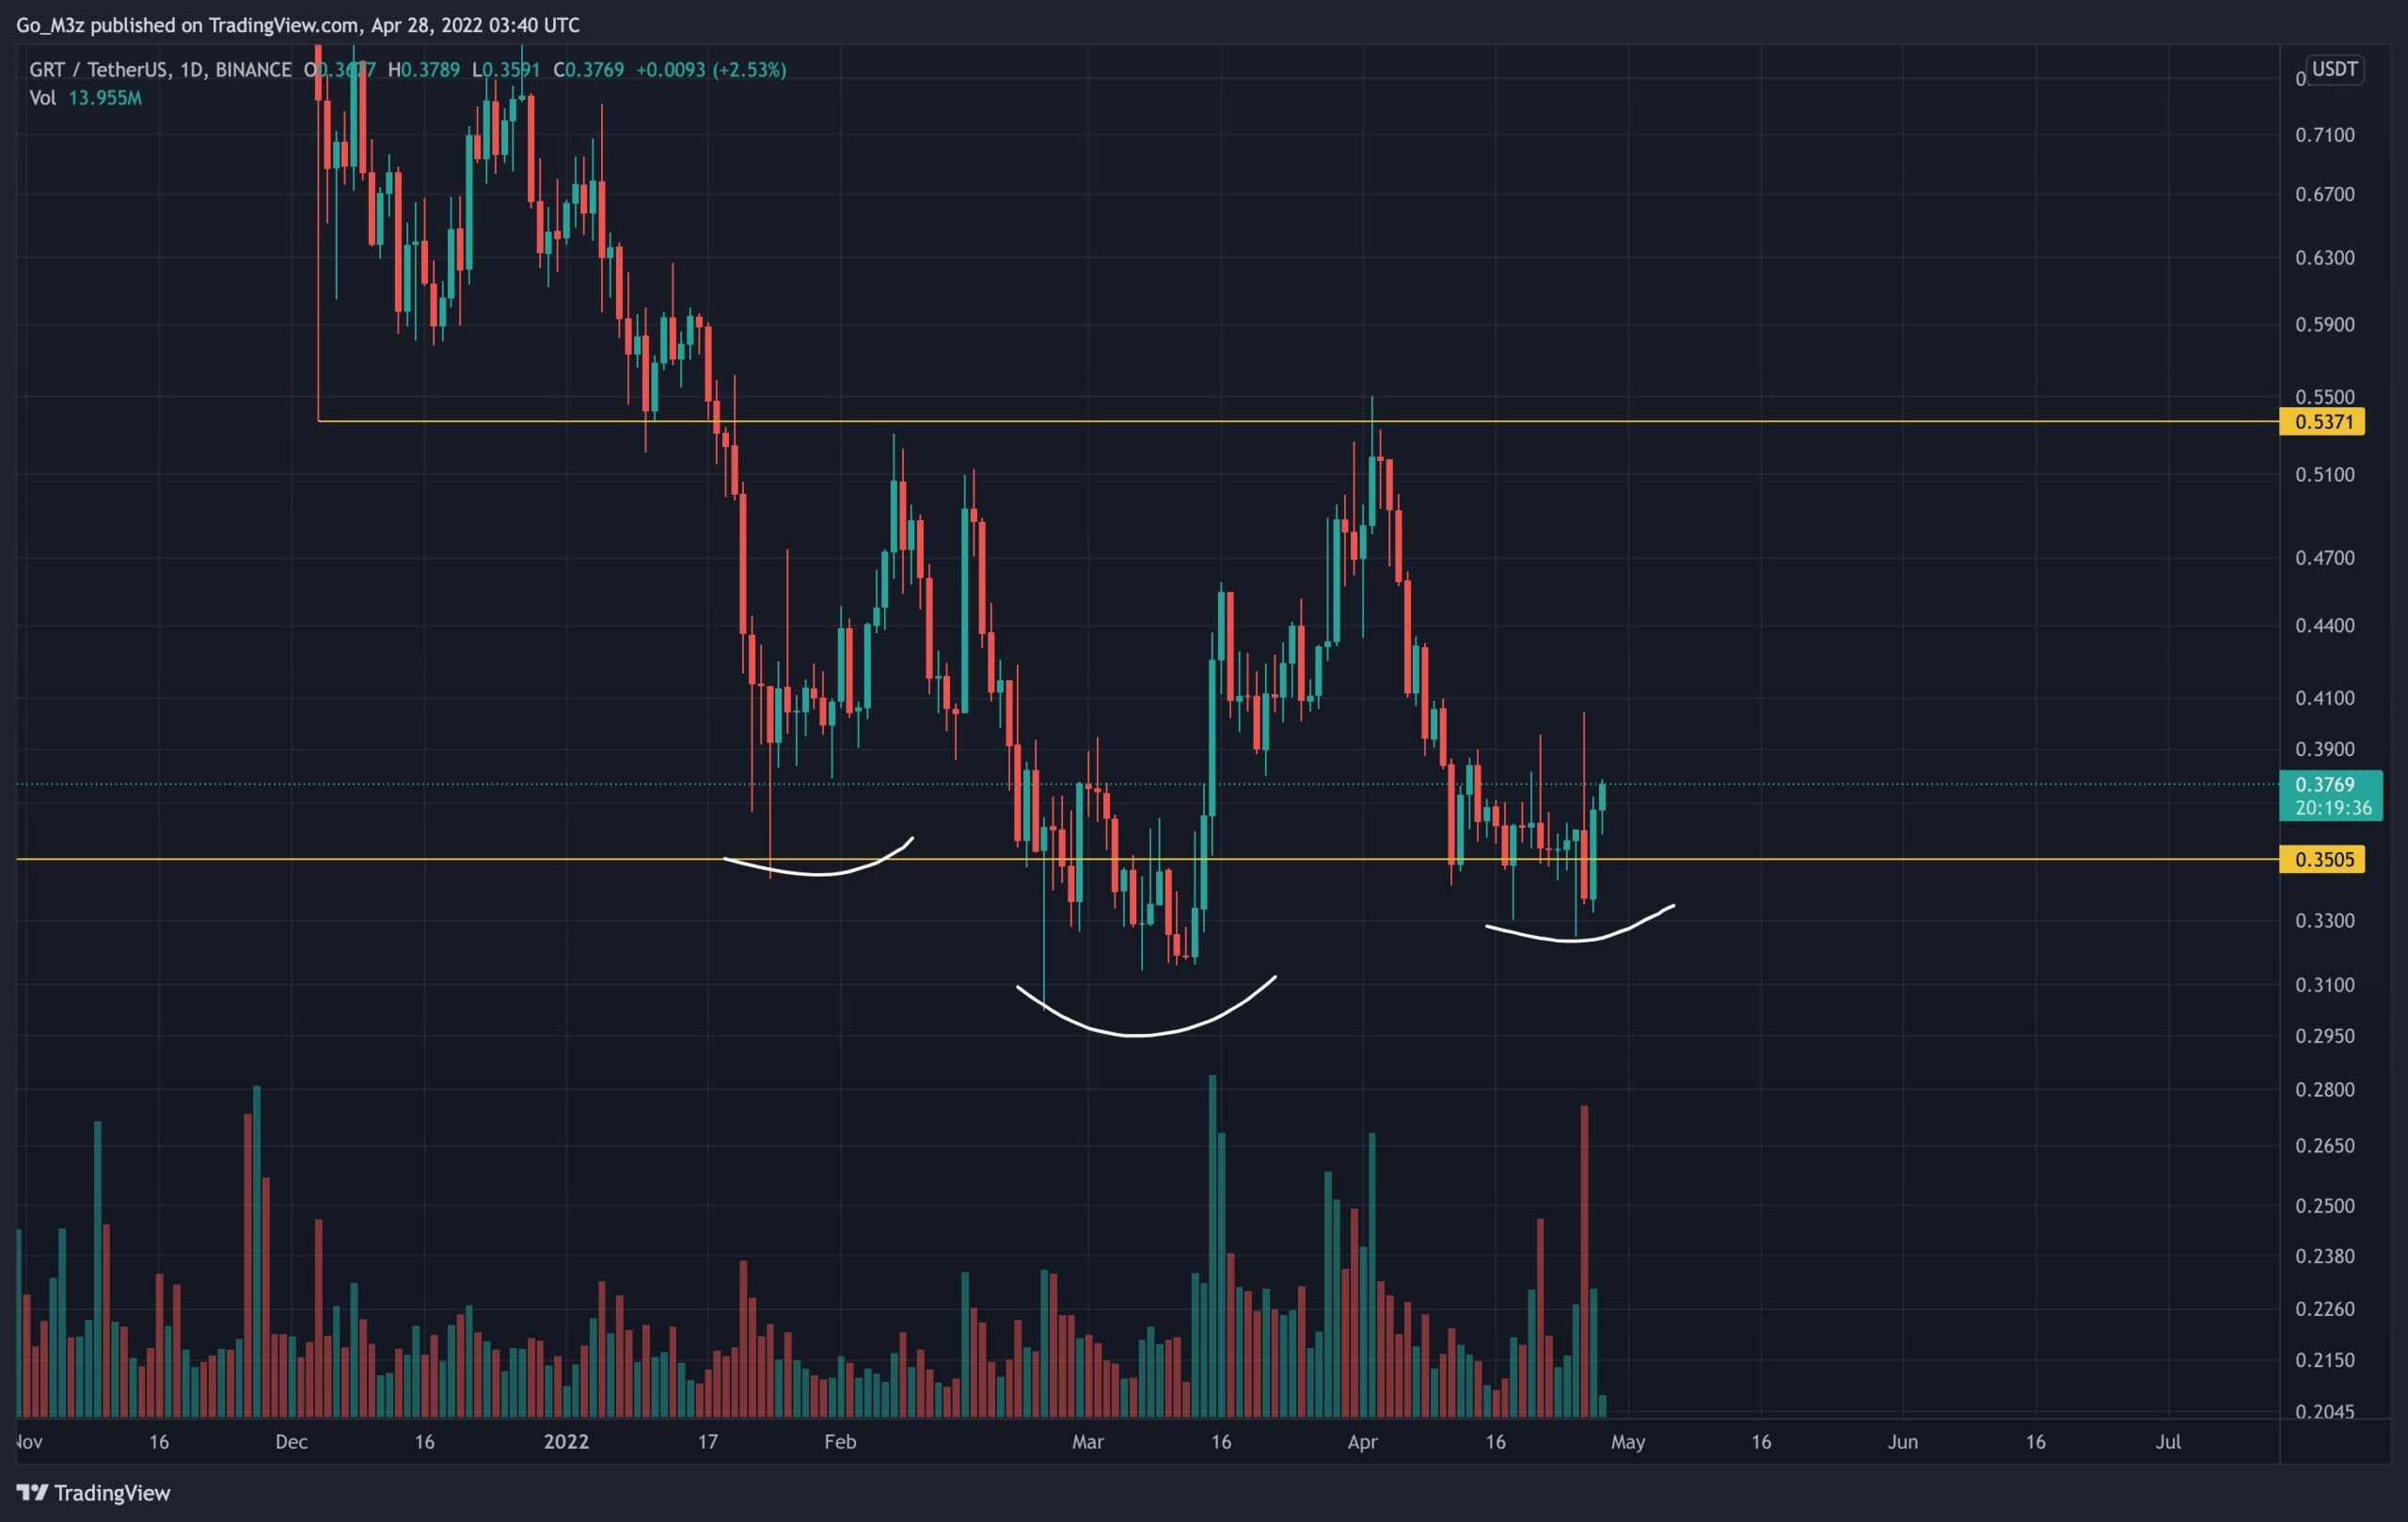
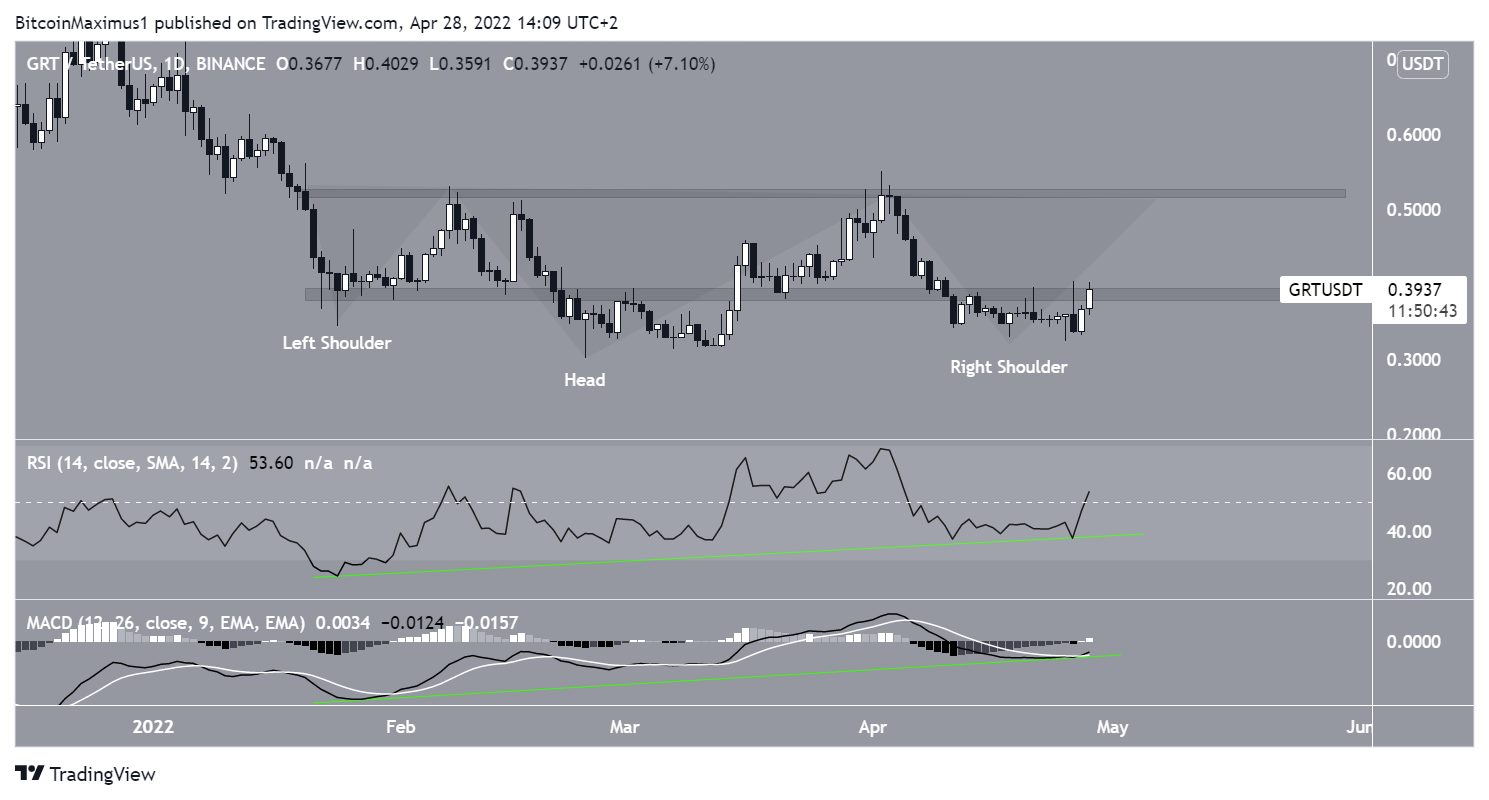
The movement since Jan 25 does resemble an inverse head and shoulders, which is considered a bullish pattern.
Additionally, the pattern has been combined with bullish divergences in both the RSI and MACD (green lines).
Therefore, the most likely scenario suggests that GRT will break out from the $0.385 resistance area and move towards $0.525.
Short-term GRT movement
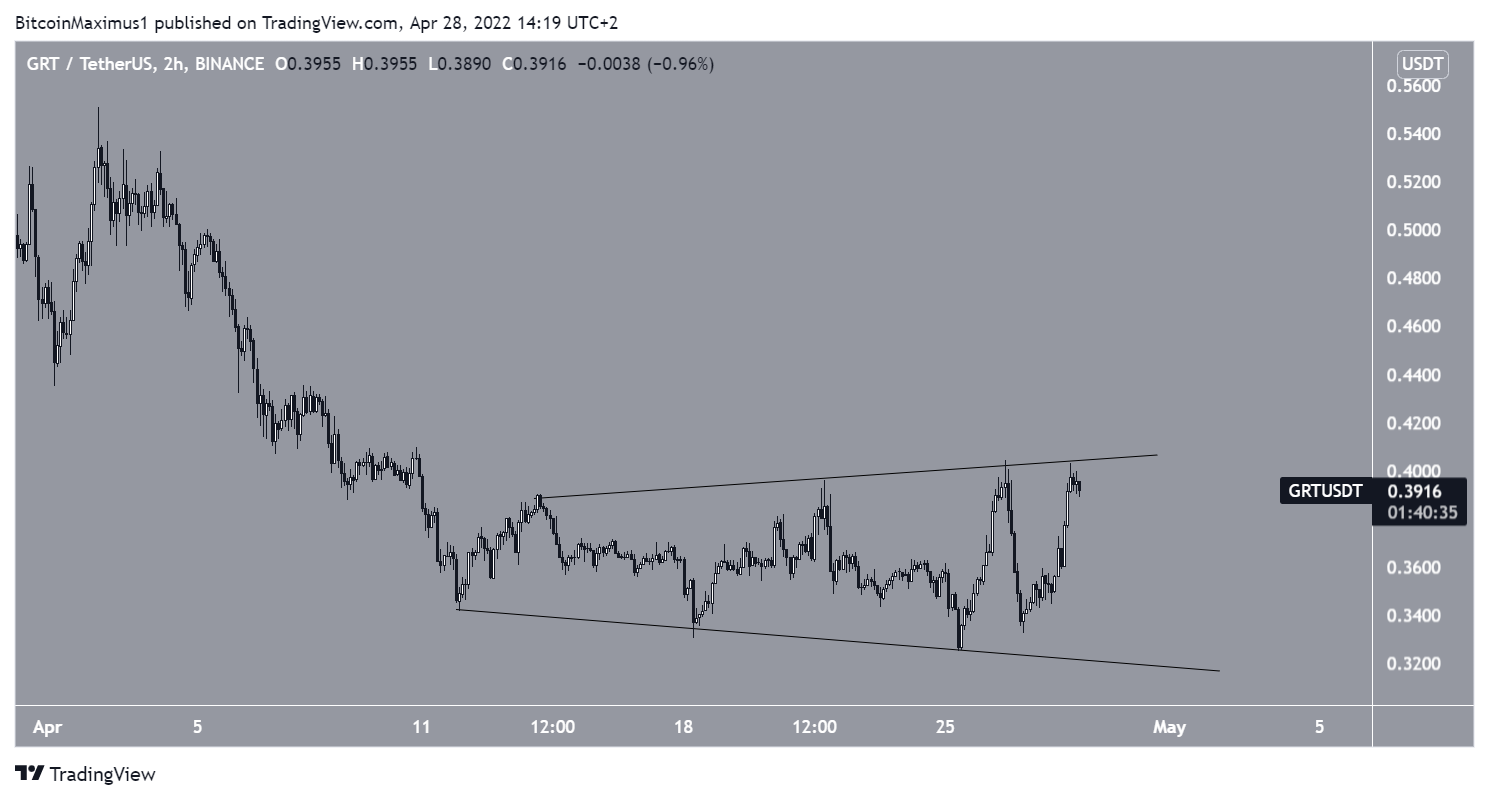
Finally, the two-hour chart shows that GRT has been trading inside a descending, broadening wedge since April 11. This type of wedge is considered a bullish pattern, meaning that a breakout from it would be expected the majority of the time.
This is in alignment with the readings from the daily and weekly time frames.
For Be[in]Crypto’s latest Bitcoin (BTC) analysis, click here
