


Be[In]Crypto takes a look at the five cryptocurrencies that decreased the most from June 24 to July 1, including The Graph (GRT), which has created a bullish pattern.
These cryptocurrencies are:
- Waves (WAVES): -21.33%
- Polygon (MATIC): -18.63%
- Ziliqa (ZIL): -18.41%
- Zcash (ZEC): -16.95%
- The Graph (GRT): -16.88%
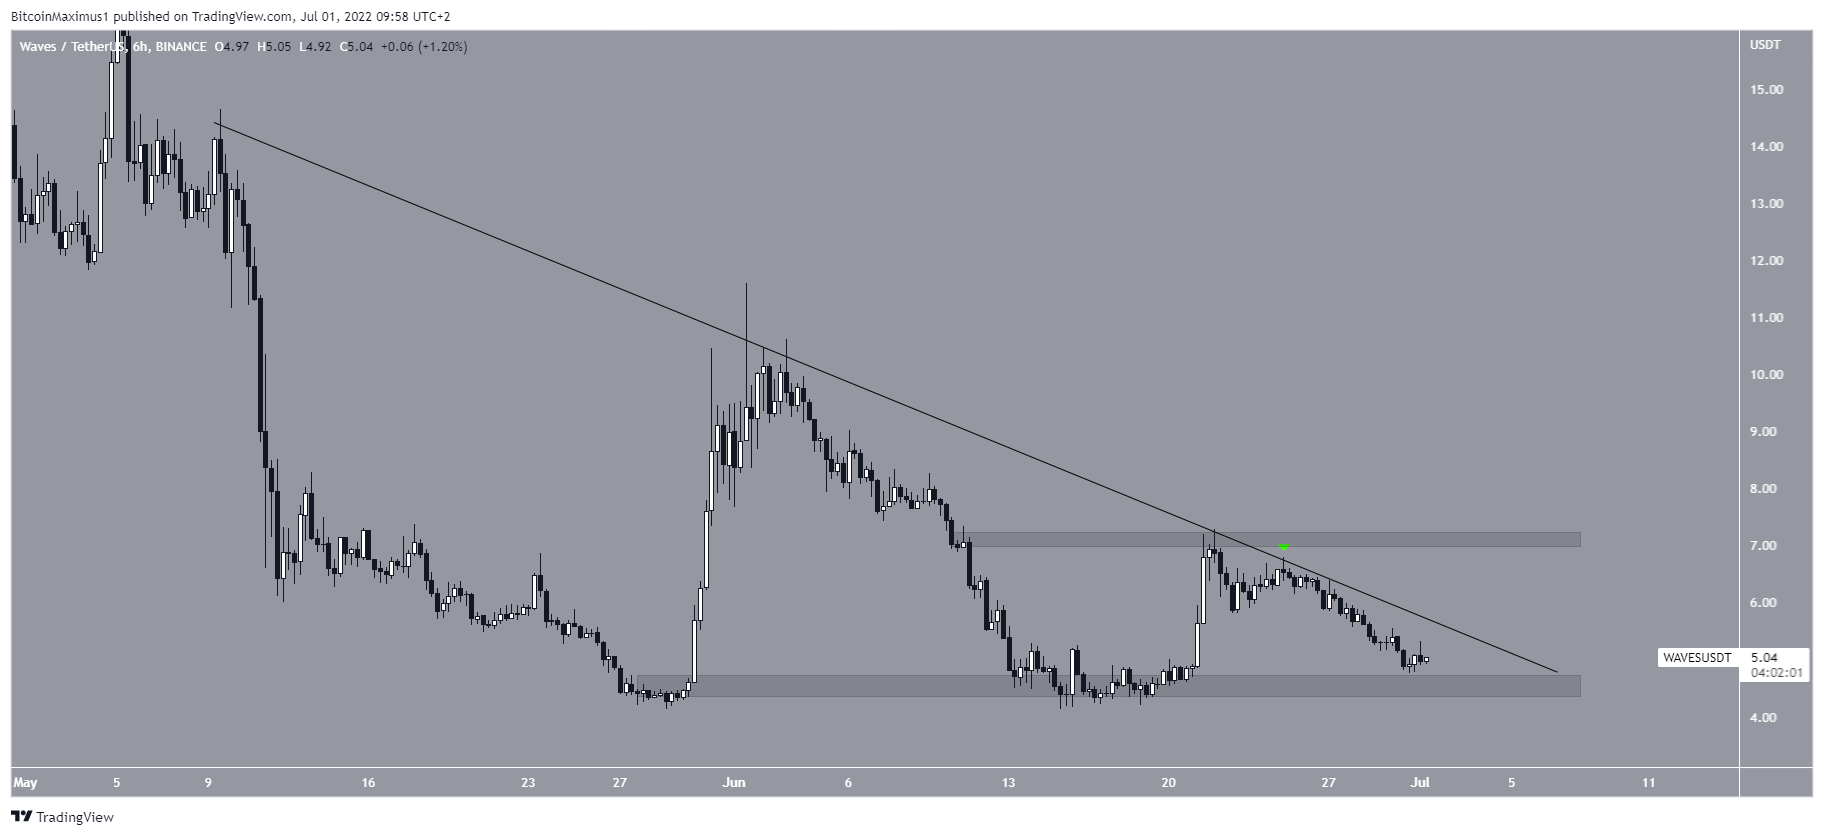
WAVES
WAVES has been decreasing underneath a descending resistance line since May 19. So far, the line has rejected the price four times, most recently on June 23 (red icon).
The closest support area is at $4.60.
If WAVES manages to break out from the line, the closest resistance area would be at $7.
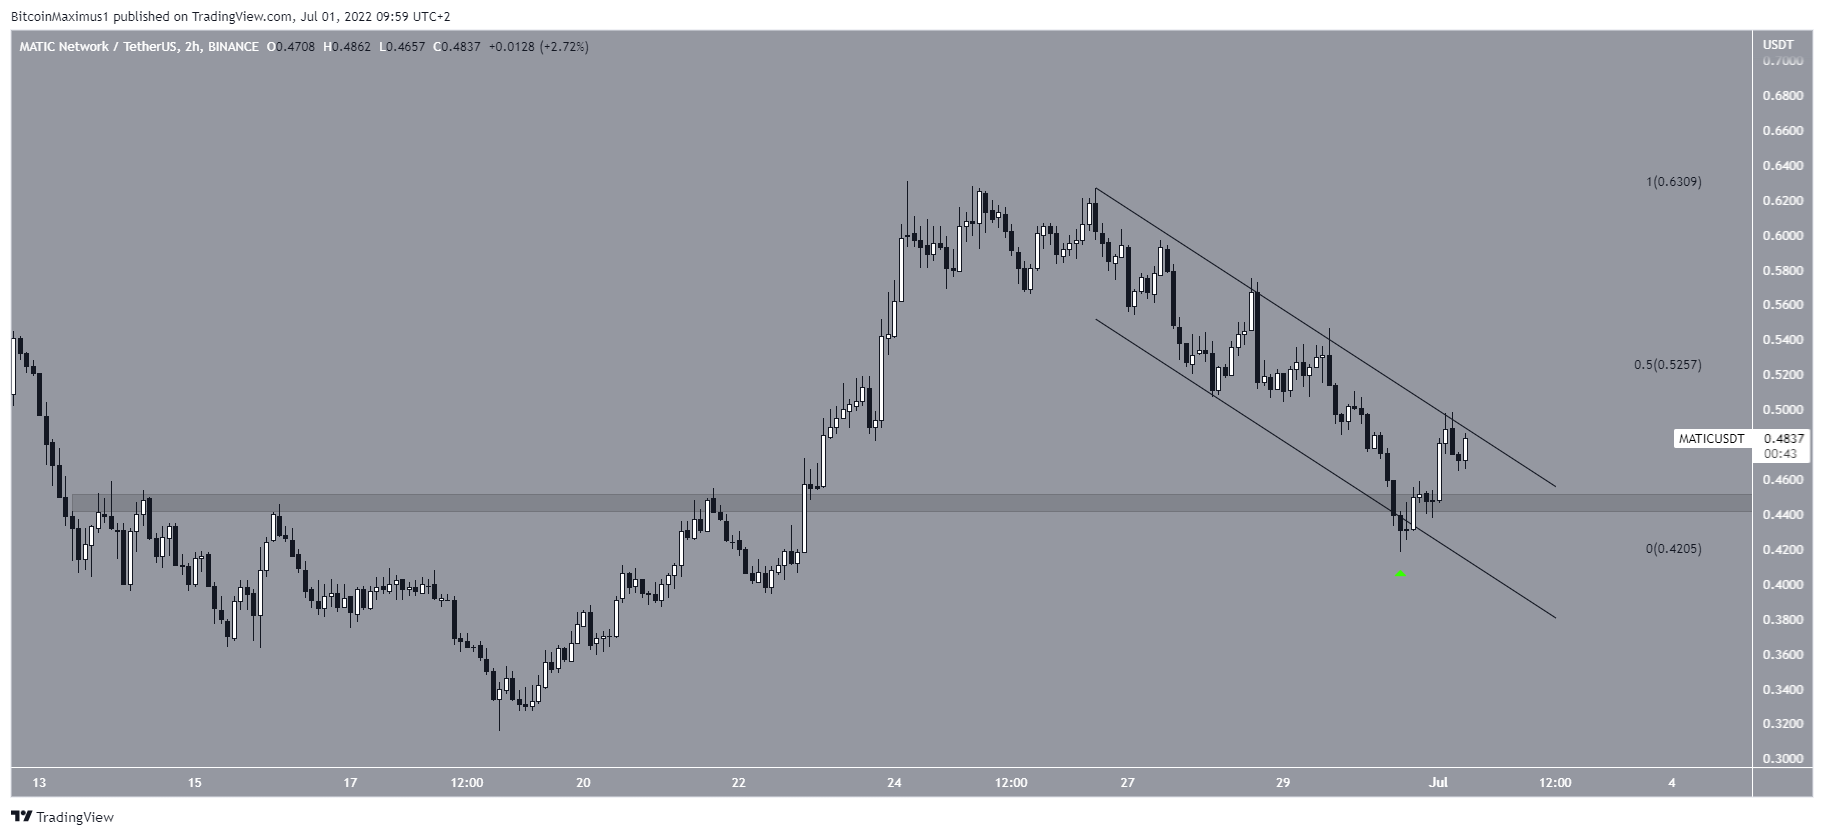
MATIC
MATIC has been decreasing inside a descending parallel channel since June 26. The downward movement led to a low of $0.418 on June 30. The low validated the support line of the channel.
Afterward, the ensuing bounce validated the $0.45 horizontal area as support.
Currently, MATIC is in the process of breaking out from the descending parallel channel.
If it is successful, the next closest resistance area would be at $0.525, created by the 0.5 Fib retracement resistance level.
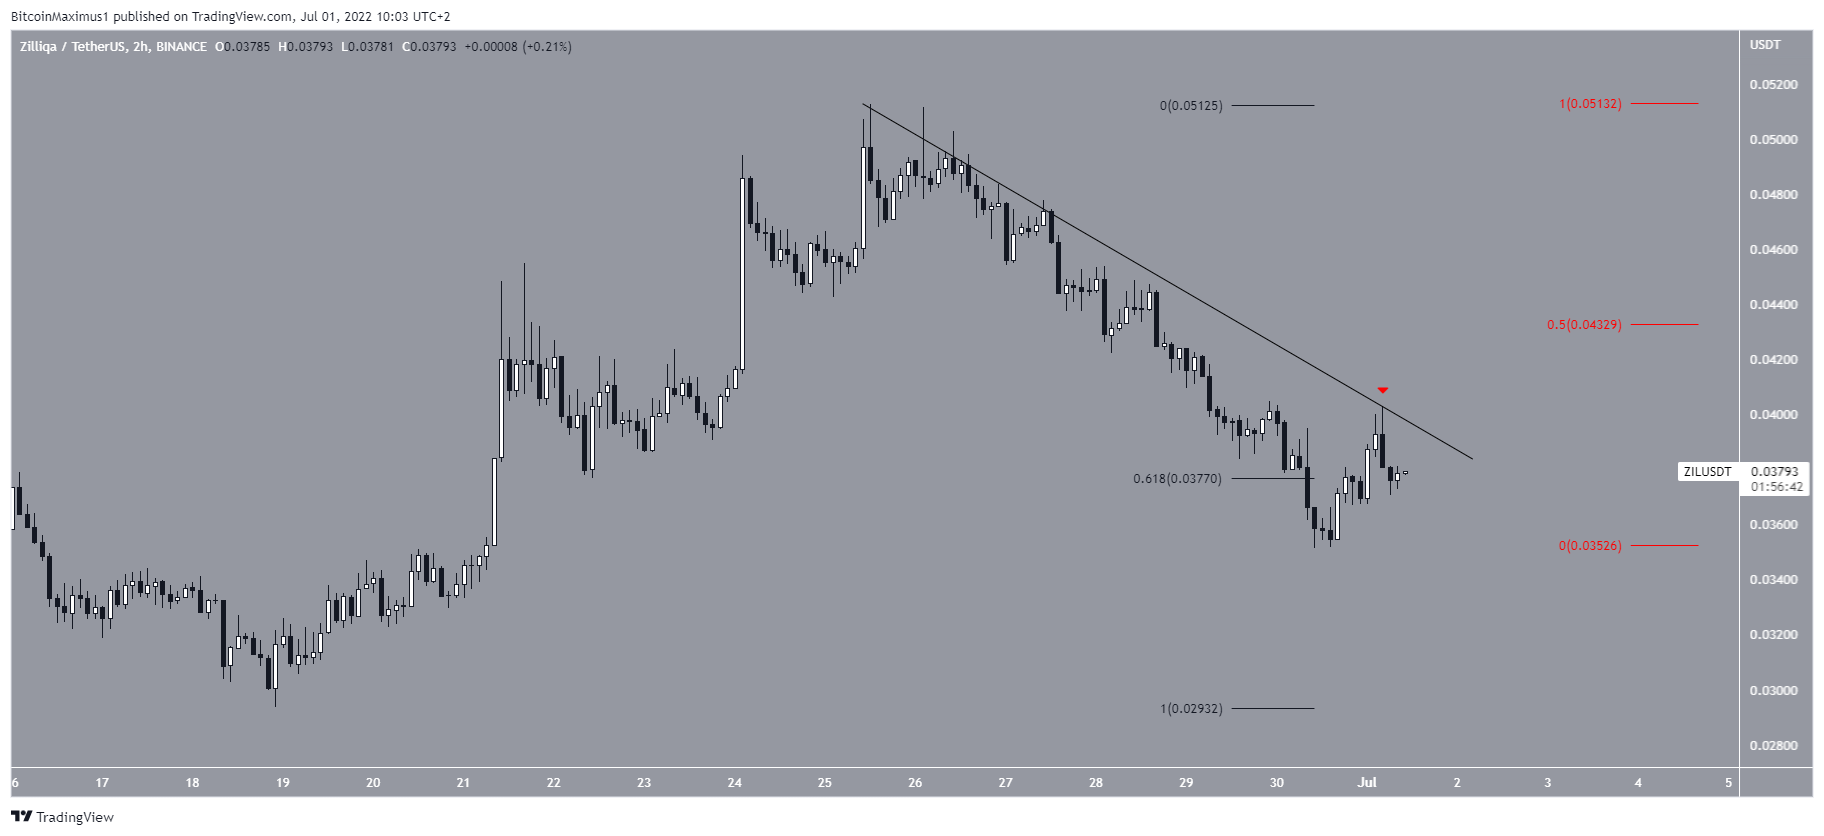
ZIL
ZIL had been decreasing underneath a descending resistance line since June 26. This downward movement led to a low of $0.035 on June 30.
Afterward, the price bounced and validated the descending resistance line once more (red icon).
If it is successful in breaking out, the next closest resistance area would be at $0.43, created by the 0.5 Fib retracement resistance level.
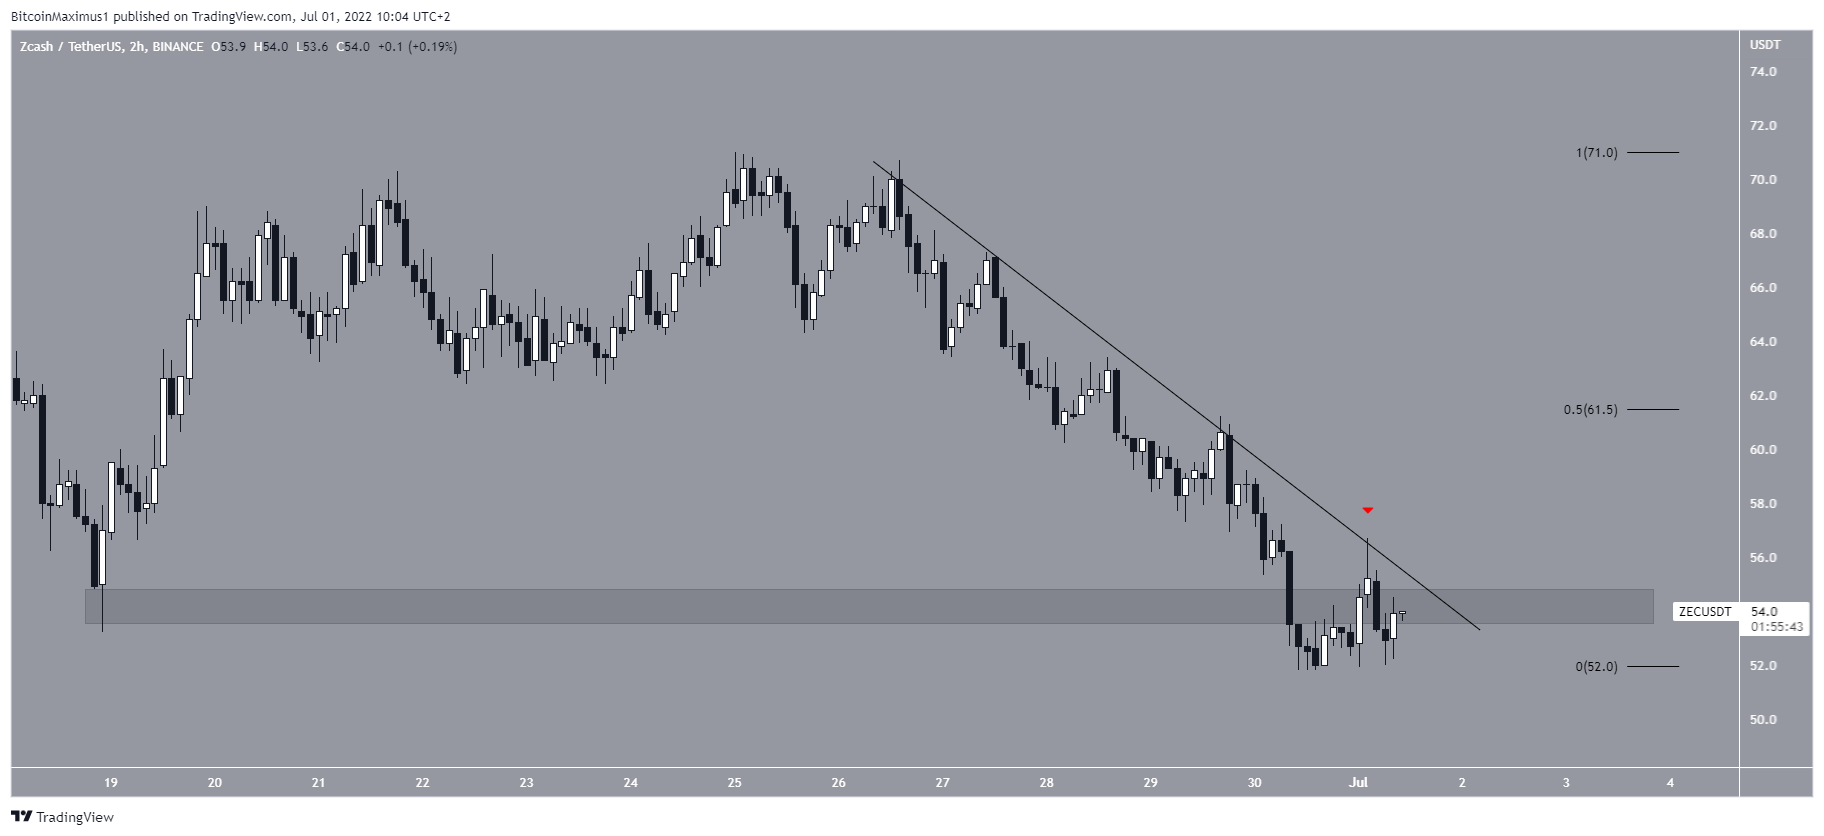
ZEC
ZEC has been decreasing underneath a descending resistance line since June 26. The downward movement led to a low of $51.8 on June 30. This was a new yearly low.
While the price has bounced afterward, it has not yet reclaimed the $54 horizontal area, which has now turned to resistance. The area also coincides with the aforementioned descending resistance line.
A potential breakout above it could take ZEC all the way to $61.5. Currently, there are no reversal signs that would suggest this is likely.
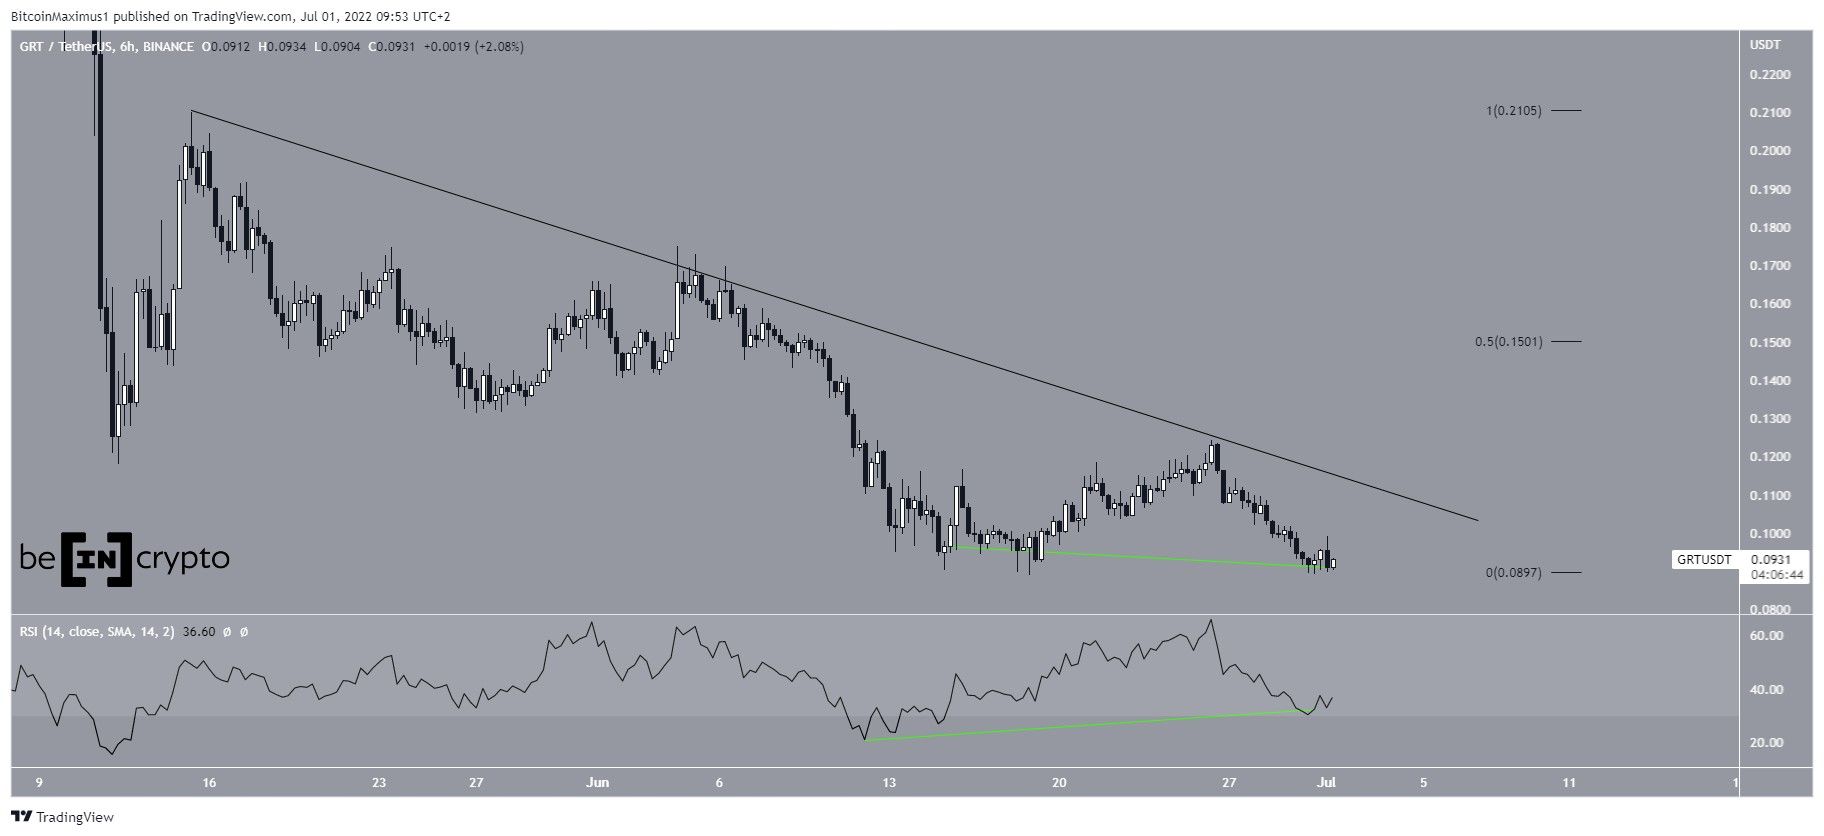
GRT
GRT has been decreasing underneath a descending resistance line since May 15. The downward movement led to a new all-time low price of $0.089 on June 30.
Despite this decrease, the price has created a double bottom pattern between June 13 and June 30. The double bottom is considered a bullish pattern, meaning that it leads to breakouts the majority of the time.
If GRT manages to break out from the descending resistance line, the next resistance would be at $0.15.
For Be[in]Crypto’s latest bitcoin (BTC) analysis, click here


