Both 0x (ZRX) and ICON (ICX) have been correcting after rapid upward movements. However, while ICX seems to be close to reversing its trend, ZRX might fall further before doing so.
0x (ZRX)
Beginning on May 7, 0x initiated a strong upward movement and had increased by 130 percent after two days. However, the price has been decreasing since.
Well-known trader @TheEWGuy outlined a ZRX/USD chart, which suggests that the price is not yet done decreasing — rather, it may soon begin a rapid downward move that takes it way below its May 7 price, when it initiated an upward move.
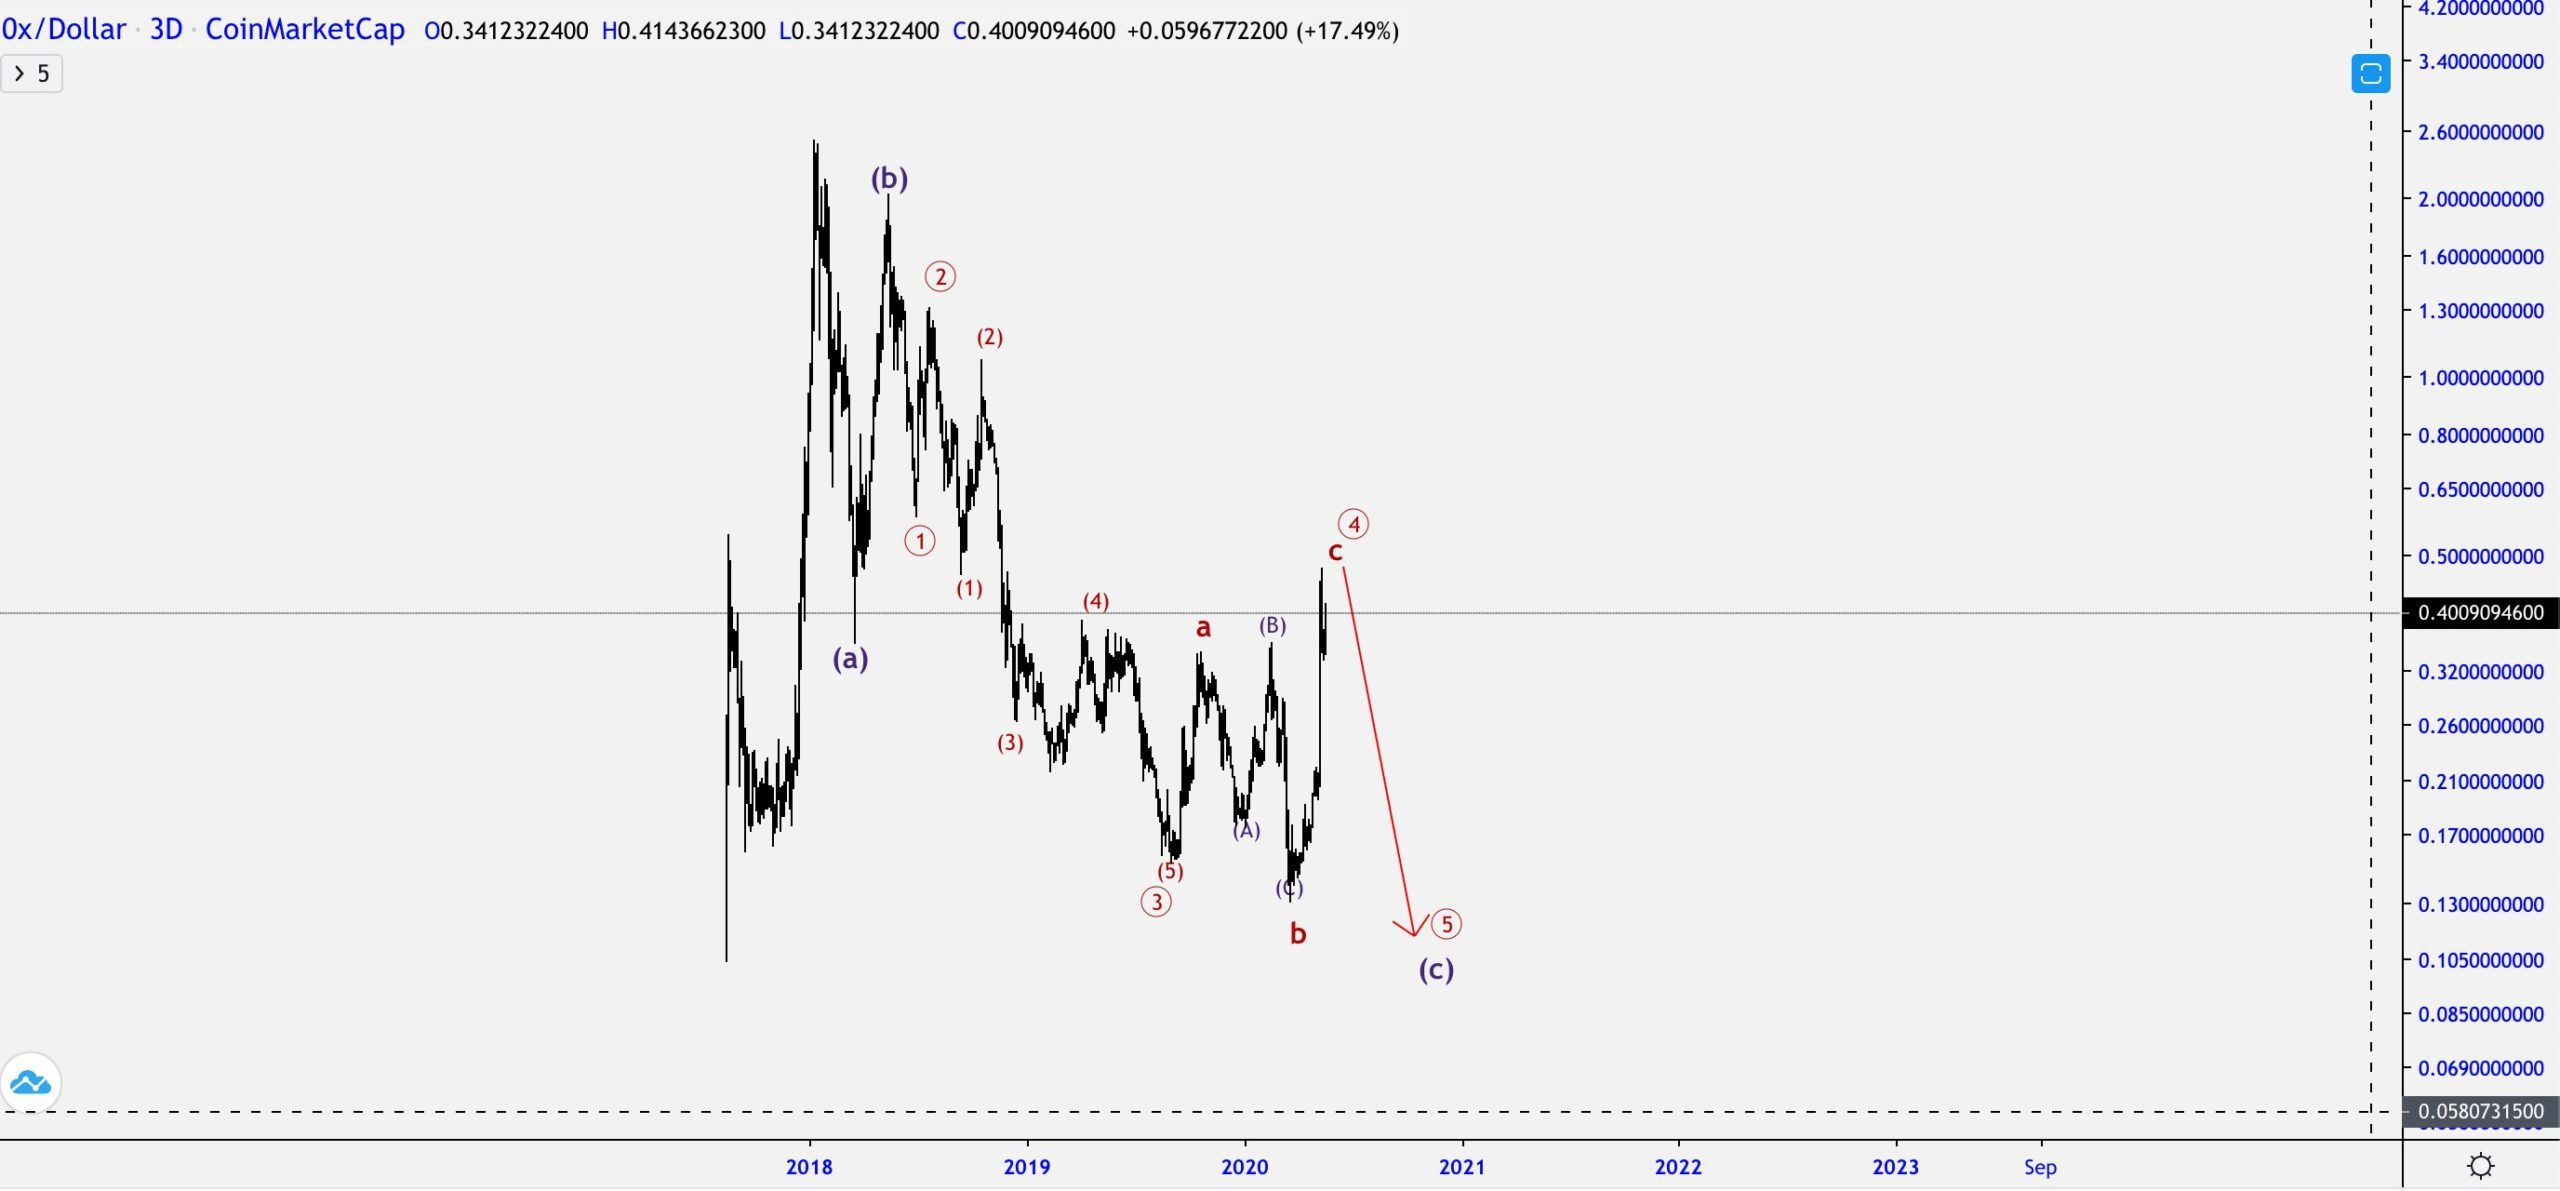
Even though the movement outlined deals with the ZRX/USD pair, we will use the BTC pair — since, if the outlined decrease occurs, it will likely have a similar effect in this pair also.
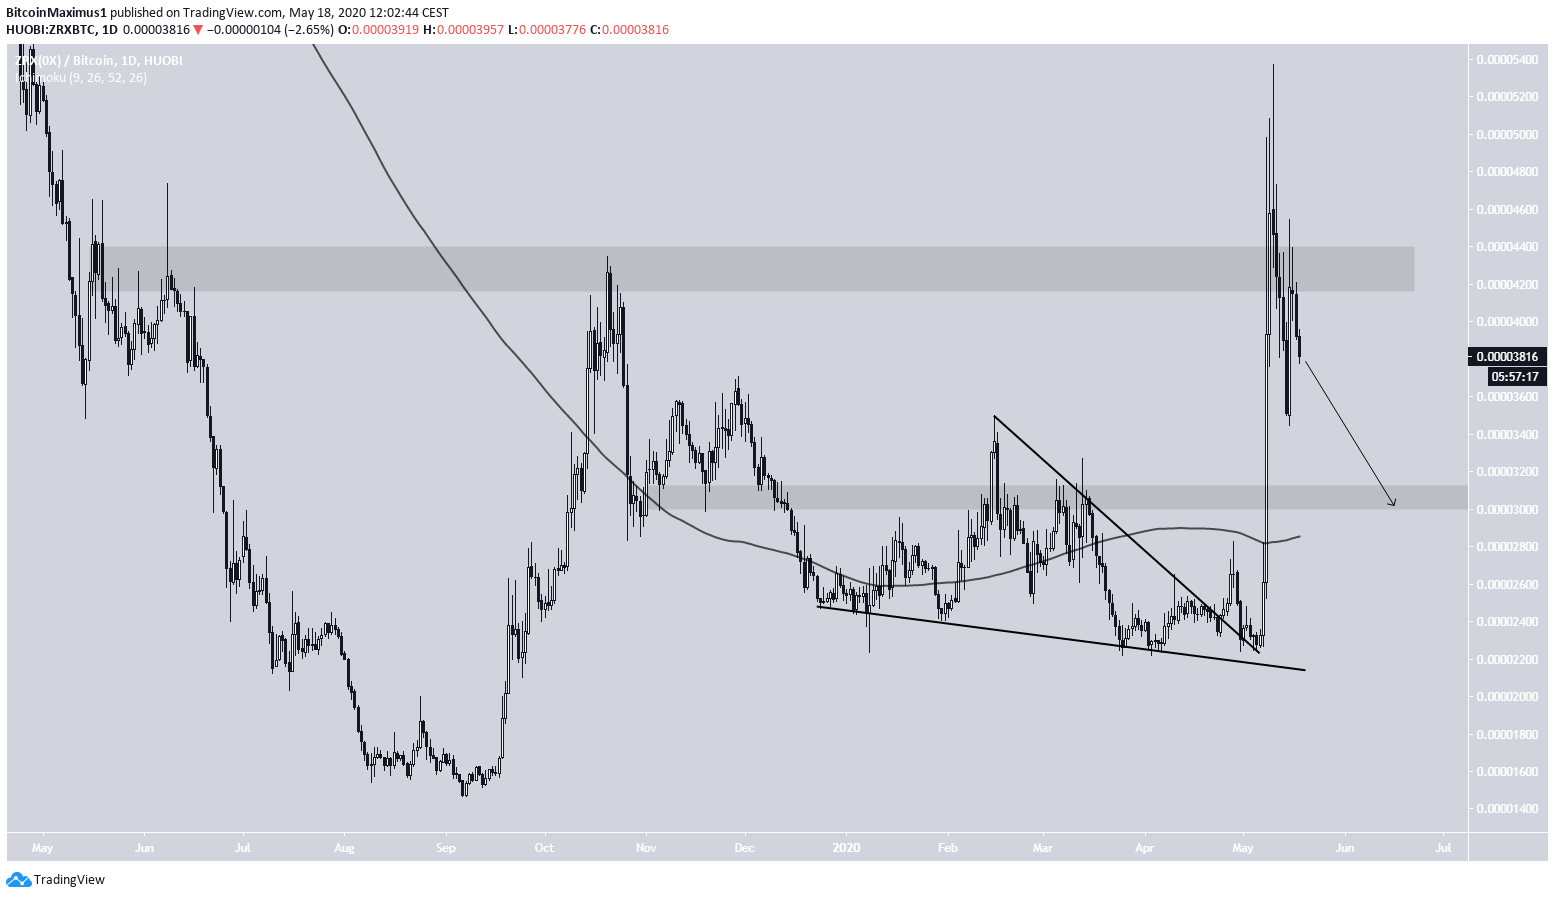
Slightly prior to the May 7 increase, ZRX broke out from a descending wedge. The breakout took it to a high of 5372 satoshis before the price fell back below the aforementioned 4300 satoshi resistance area.
The closest support area is found at 3100 satoshis, strengthened by the presence of the 200-day moving average (MA). Since the price has broken out and failed to sustain its higher prices, it is likely to fall back and validate this area as support.
ICON (ICX)
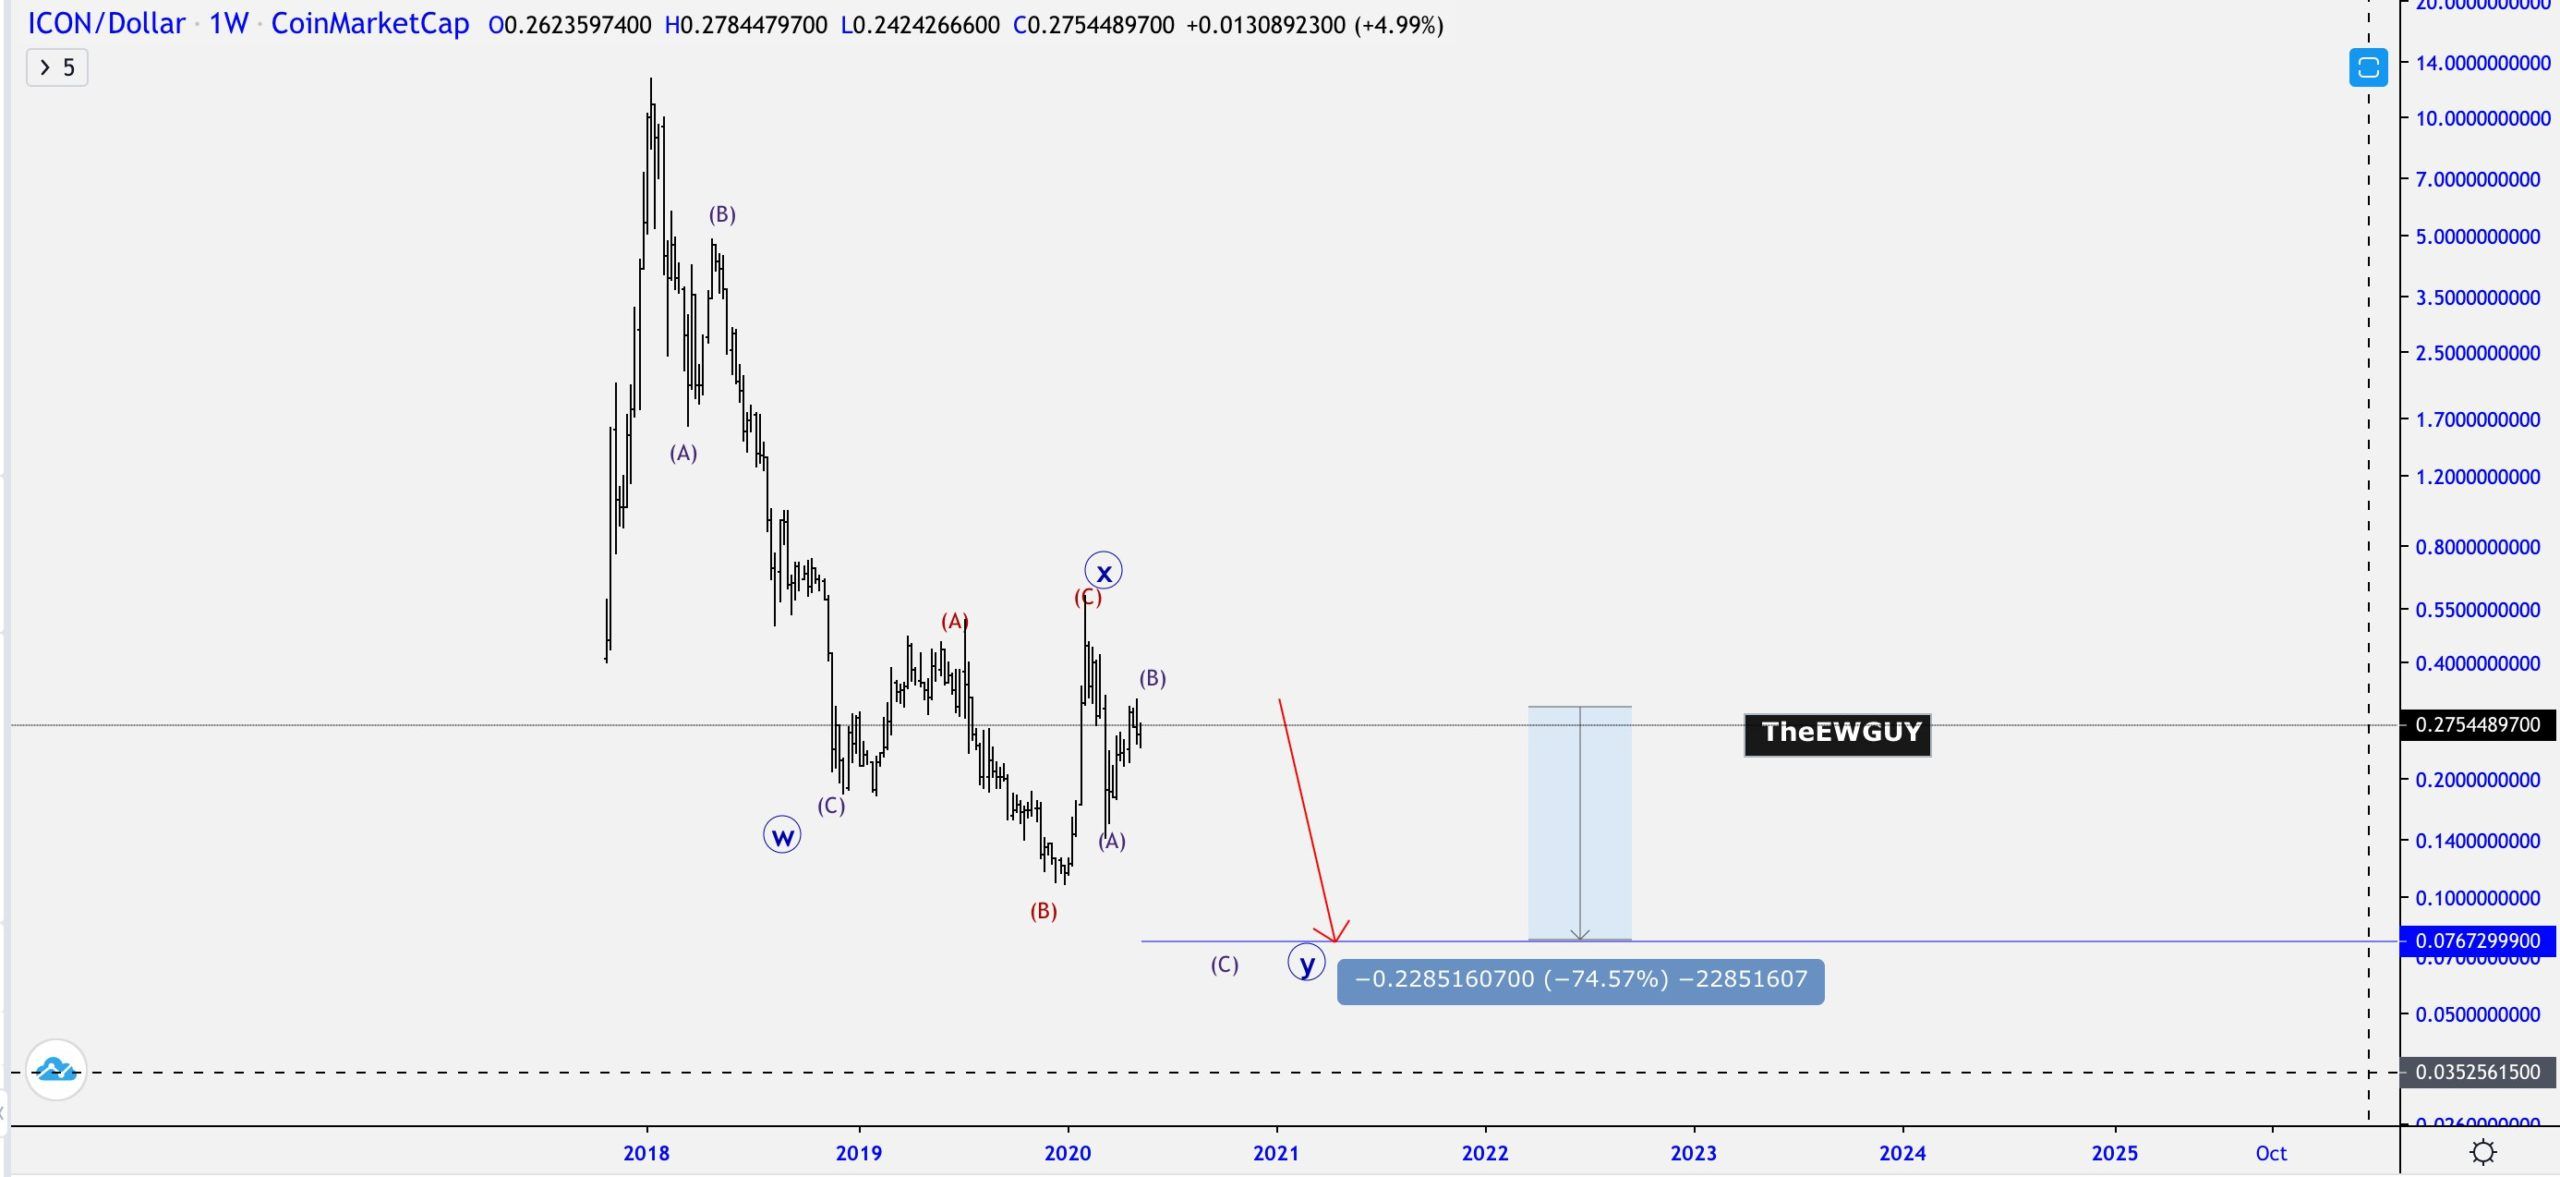
Similar to ZRX, ICX also initiated an upward move on May 7. However, it was much weaker, since the price only increased by 20 percent before falling to its pre-breakout levels. Well-known trader @TheEWGuy outlined an ICX chart, in which he has shown a decrease similar to that outlined for ZRX.
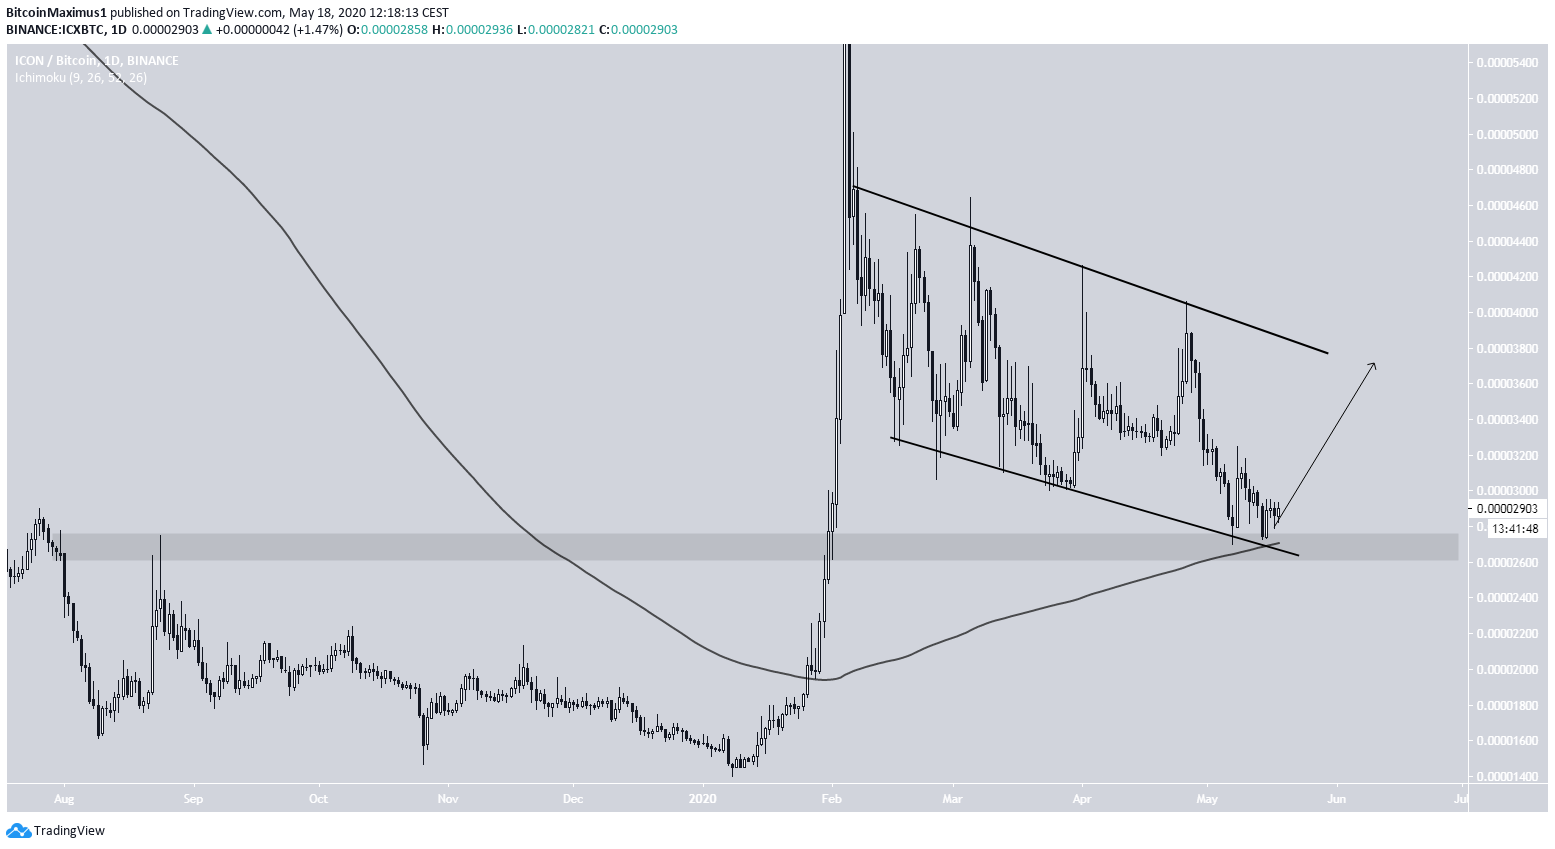
After initiating a strong upward move at the beginning of the year, ICX has been decreasing, trading inside a descending channel. At the time of writing, the price was trading right at the support line of this channel. In addition, it is sitting at a confluence of support levels, such as the 2700 satoshi support area and the 200-day MA.
Therefore, the ICON price is expected to move upwards and possibly reach the resistance line of the channel — which is currently at 3800 satoshis.