
On May 6, the Bitcoin dominance rate increase above the 68% area for the first time since Jan 14.
The flip of such an important level is a bullish sign that suggests that the price will be positively influenced by this.
Well-known cryptocurrency trader @Damskotrades outlined a Bitcoin dominance rate chart (BTCD) that shows this important resistance level that has been flipped as support.
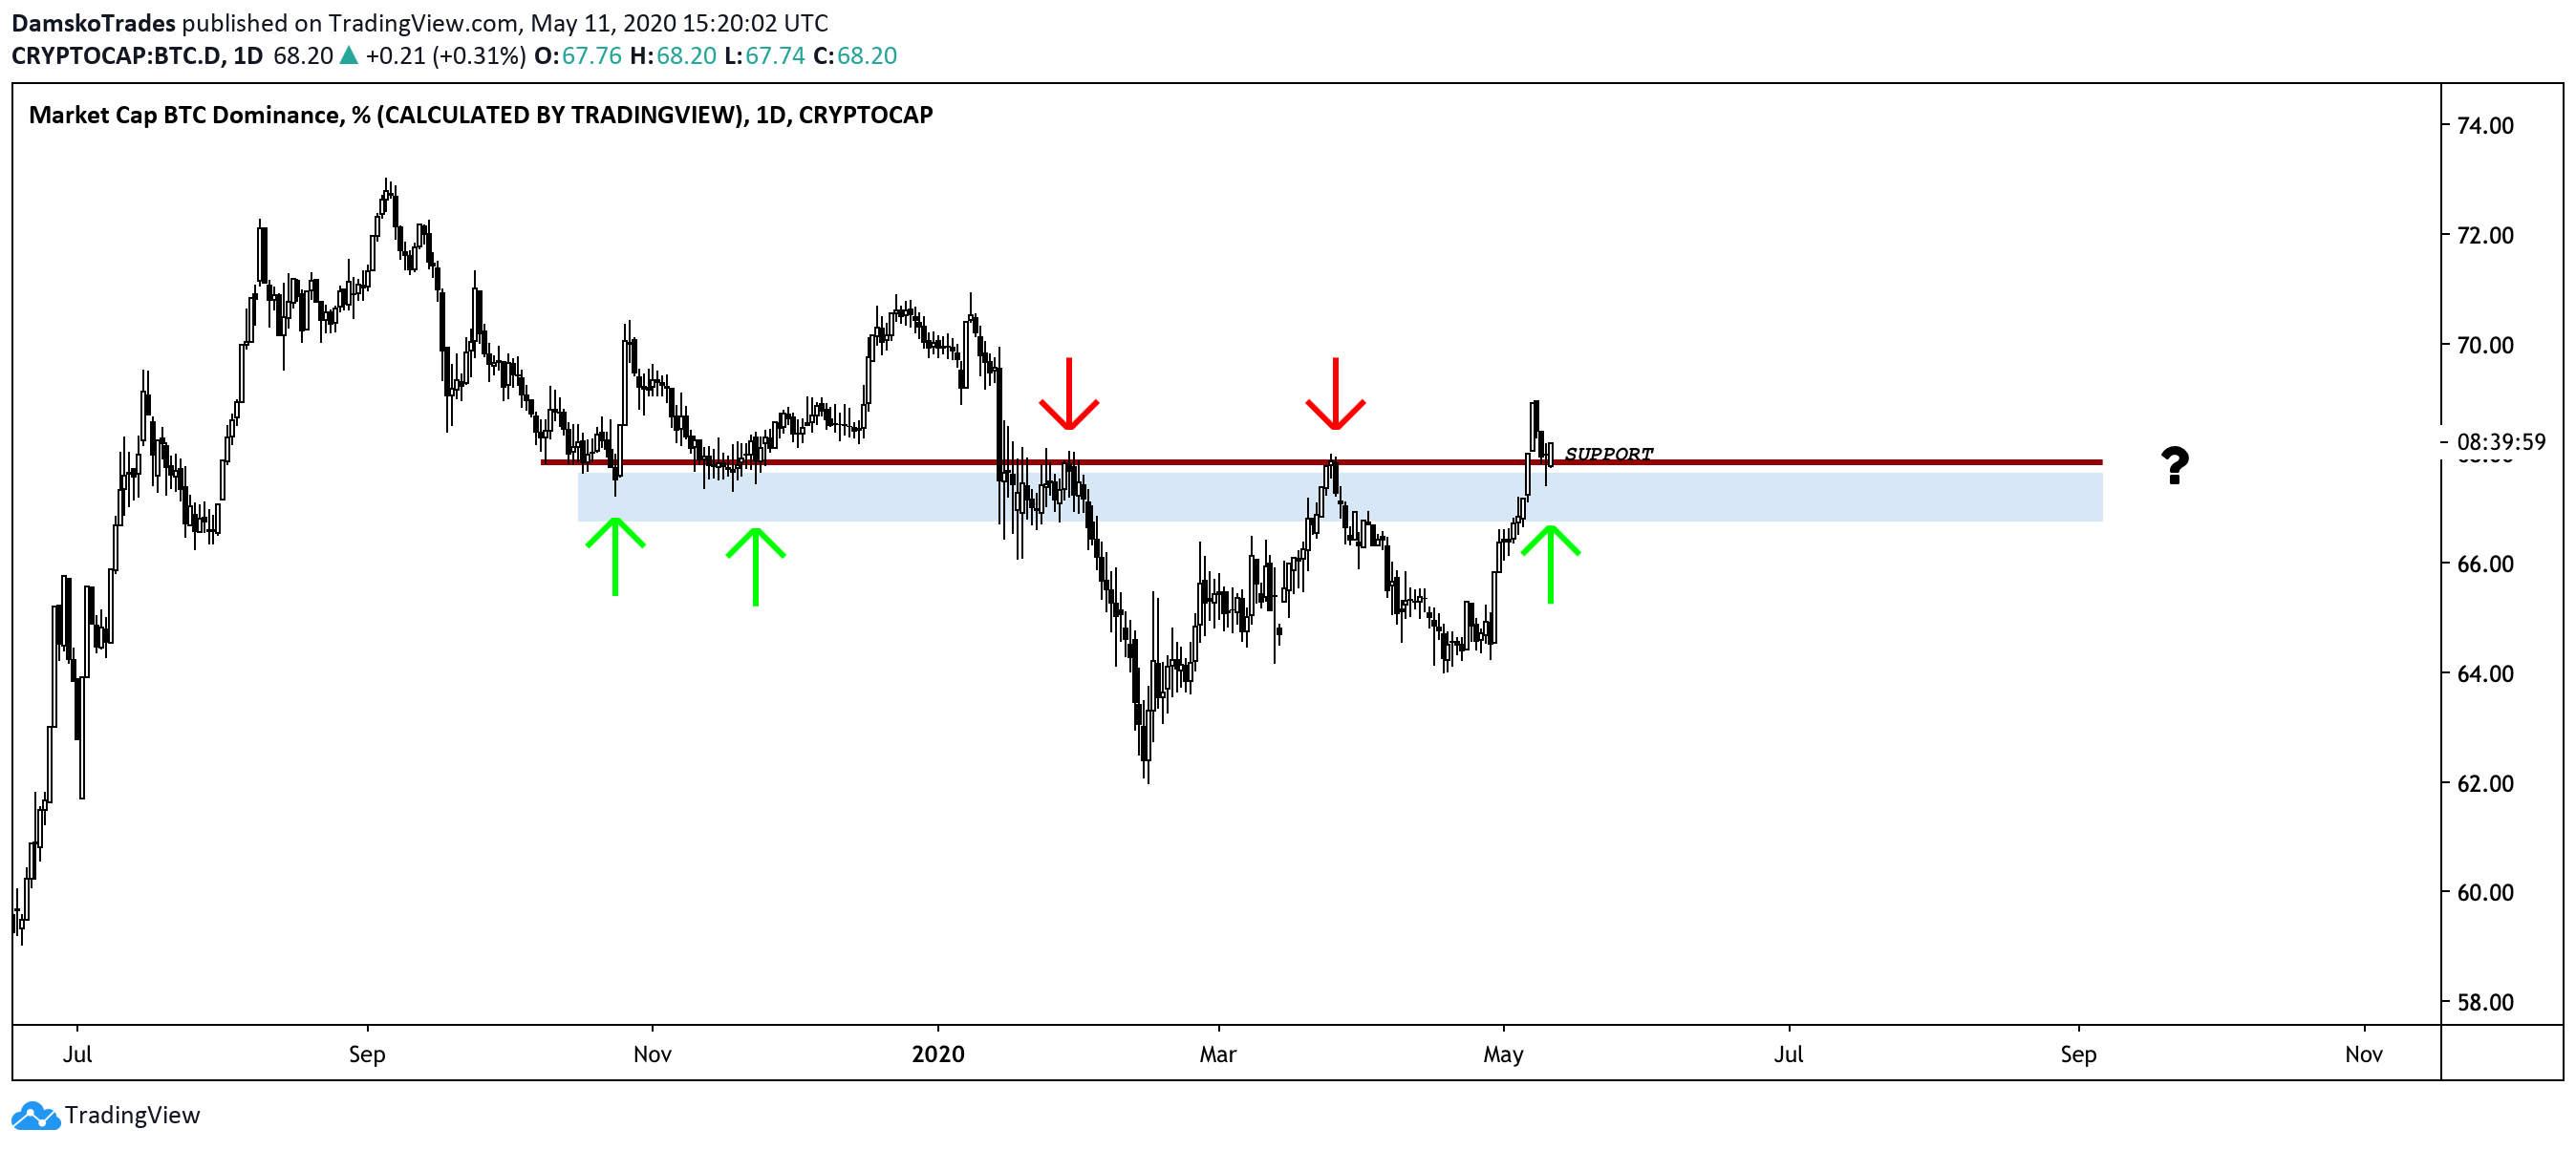
Damsko stated that altcoins are likely to decrease as the Bitcoin dominance rate goes up:
Bitcoin started moving – Bitcoin Dom bounced on the Daily support – Altcoins rejected by the resistances Patience, timing & understanding where your attention on the market should be!
Important Bitcoin Dominance Resistance
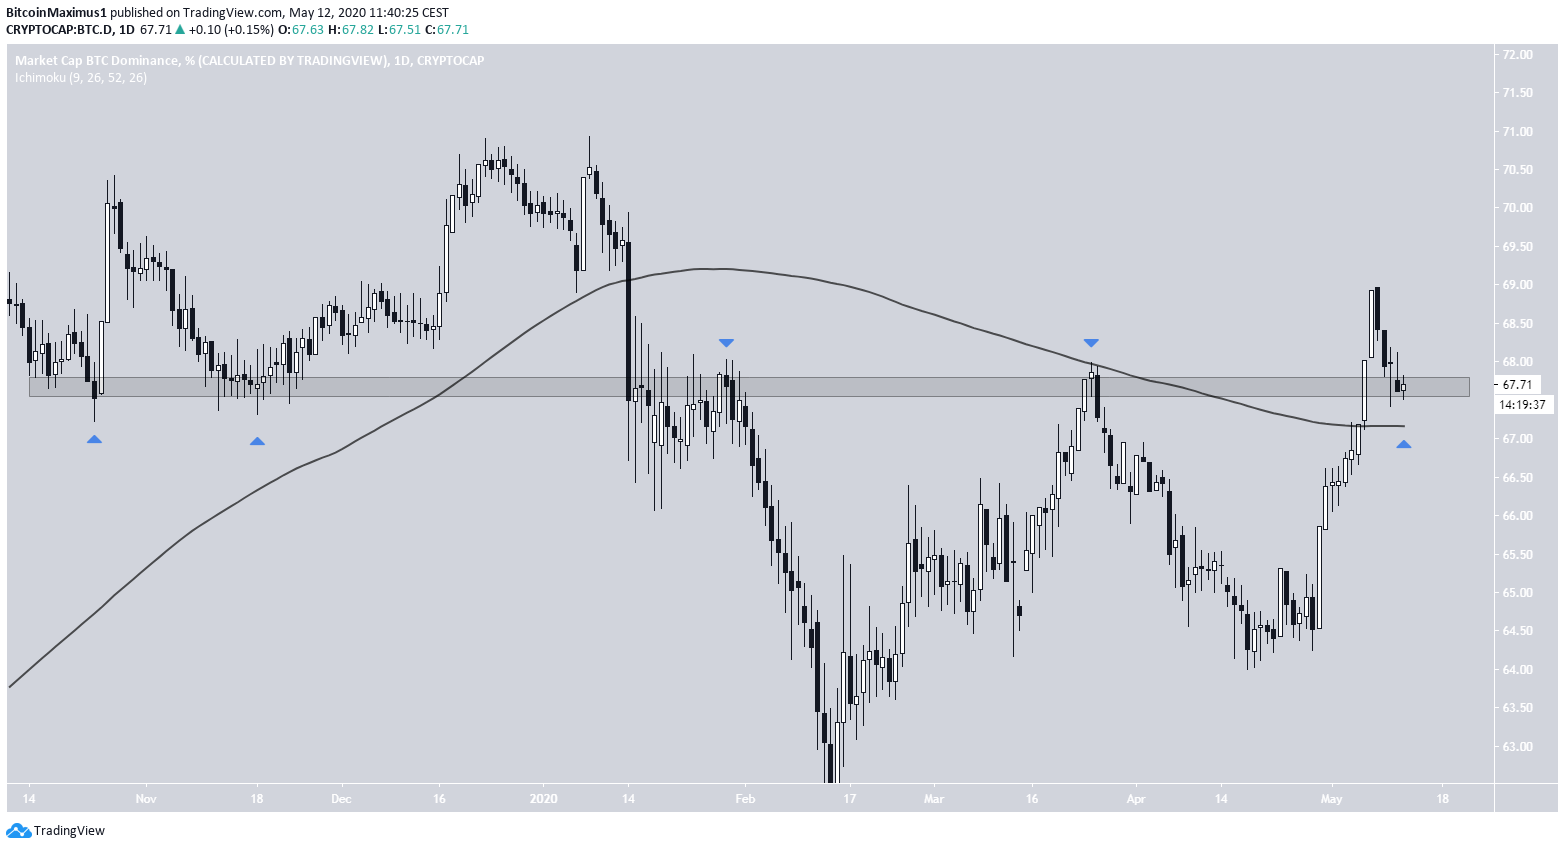
On the daily chart, the most important area is found at 67.5%. Since July 2019, this area has intermittently acted both as resistance and support.
On May 6, the BTCD rate moved above this area and is currently in the process of flipping it as support. The fact that it has also moved above the 200-day moving average (MA) gives even more legitimacy to the breakout.
This movement indicates that the Bitcoin dominance rate is likely to continue moving upward.
Long-Term Range
However, the weekly chart gives a slightly more conflicting outlook. BTCD has fallen back below the long-term range between 52-68%. A movement such as this suggests that it will likely fall towards the support line of this range at 52%.
However, due to the bullishness in the daily chart, it seems that the BTCD will reclaim the resistance of this range instead and move towards the next resistance level, found at 75%. In order to do so, it has to reach a weekly close above 68%.
If it fails to do so, the BTCD is likely to decrease towards 52%.
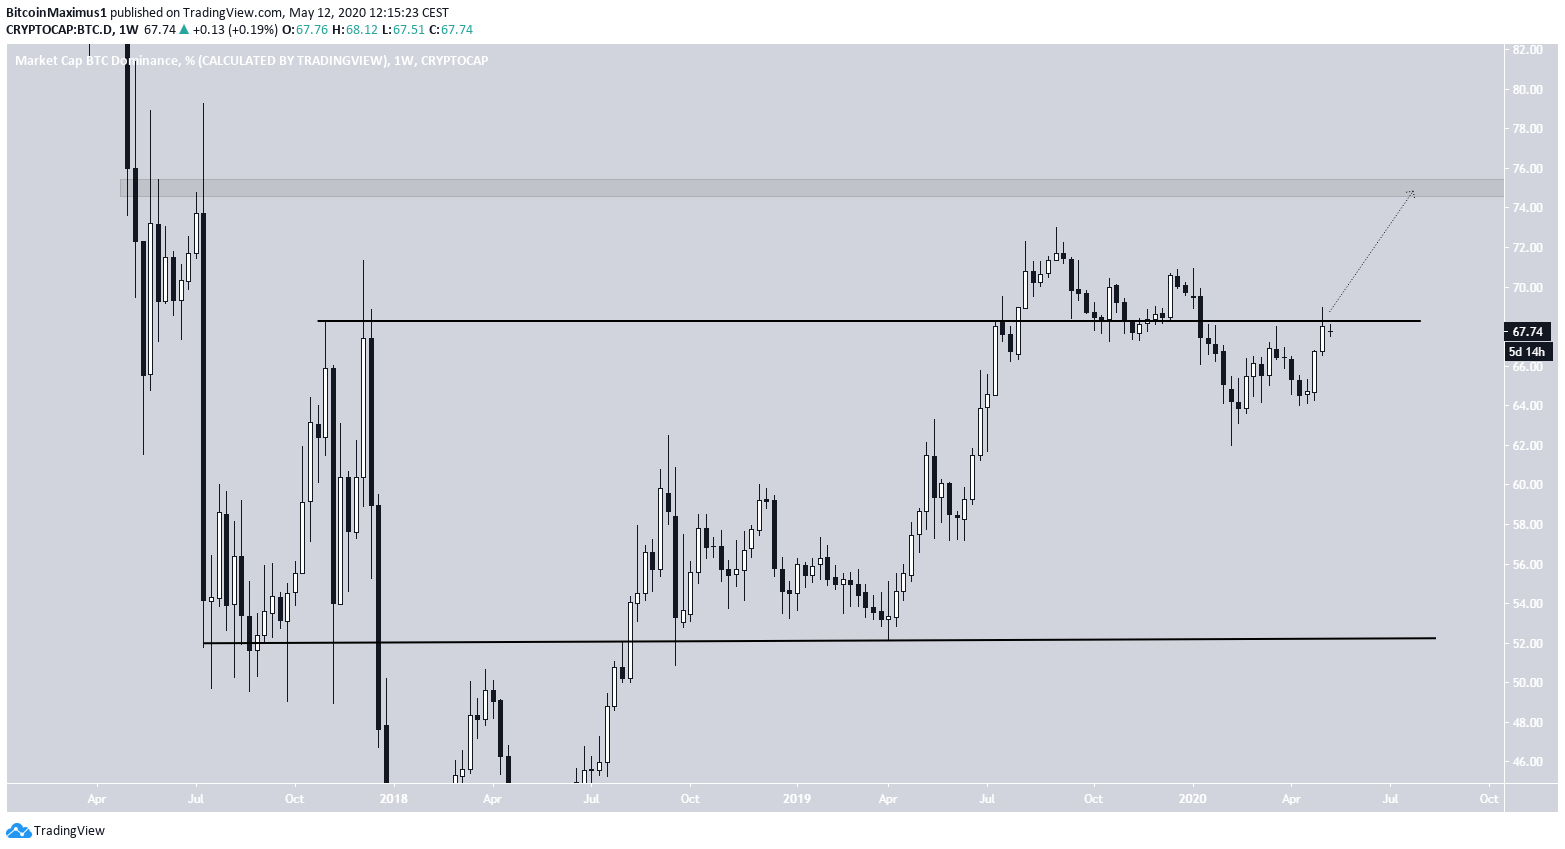
To conclude, the BTCD has broken out above an important resistance level and validated it as support. In order to confirm this bullish movement, the BTCD has to reach a weekly close above 68%.
