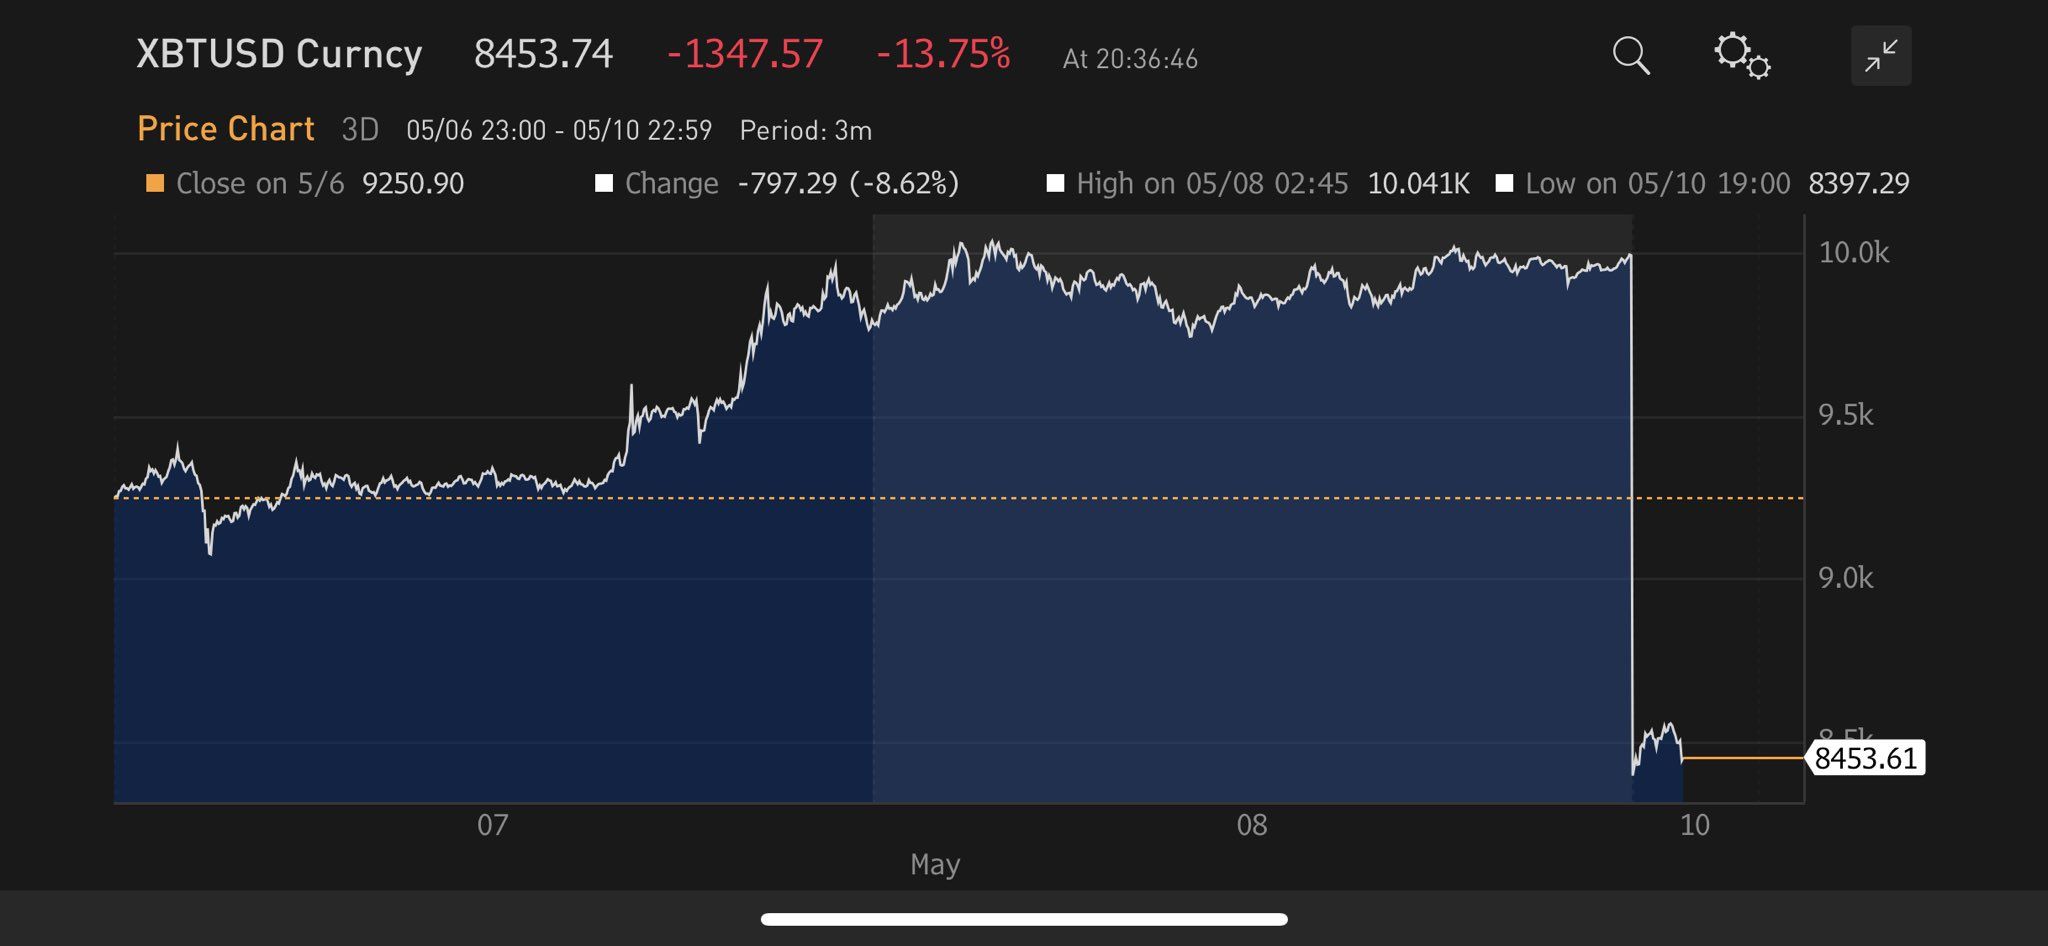
With Bitcoin’s third halving officially in the books, the price movement has been extremely volatile. BTC dropped from a local high of $10,067 on May 9, to a low of $8,117 the day after.
Bitcoin halvings are naturally a bullish event since the supply of total Bitcoin’s is reduced. Yesterday, however, the price initiated a strong upward move, only to be rejected and drop sharply afterward.
Twitter user @jsblokland, head of the asset management firm Robeco, tweeted out a not-so-optimistic halving chart, stating,
A lot of people want to get out of #bitcoin before the #halving.

Bitcoin Rejection and Drop
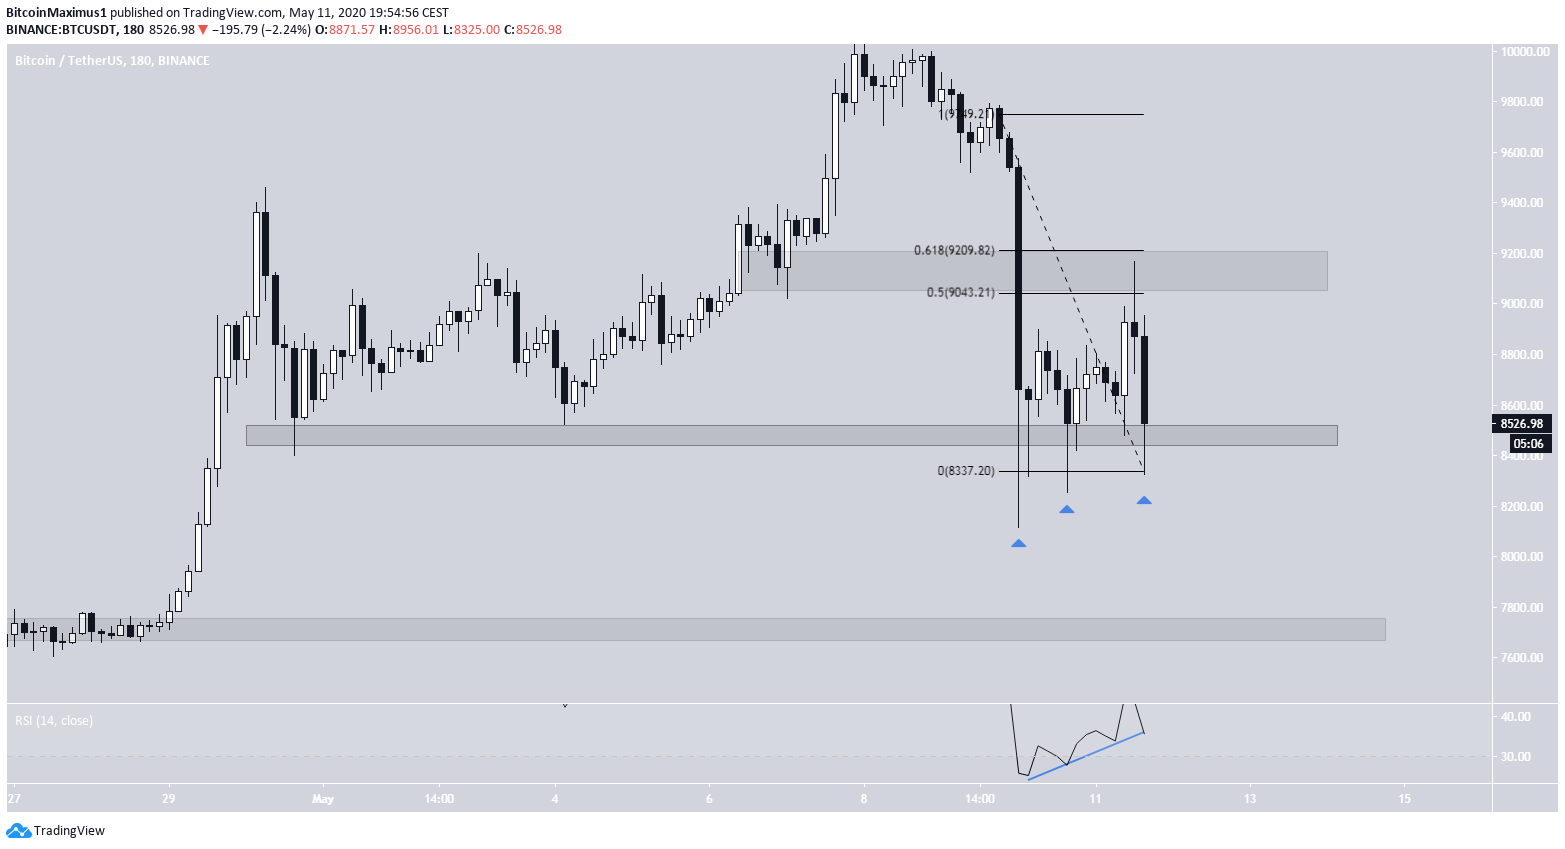
Earlier today, the Bitcoin price initiated an upward move that reached the 0.5-0.618 Fibonacci levels of the previous decrease, found between $9,050-$9,200. This level was also strengthened by the presence of the 200-hour moving average (MA). At the time of press, BTC was trading inside the $8,600 support area, a level which it has not traded under since April 30, with the exception of some long lower-wicks. In addition, while volume has been significant during the drop, it’s significantly lower than that of yesterday’s downward move.

Long-Term Movement
The movement before and after the first two halvings differed in quite a few ways. Prior to BTC’s first halving, the price had dipped for nearly a month but rallied considerably after the event. In the second halving, the movement different. but there appear to be some similarities to the latest. The price was in an uptrend long before the halving but began to decrease just one week afterward. The downturn lasted for two more months before the price began a long-term uptrend that eventually led to the all-time high price reached in December 2017.

Top crypto platforms in the US
Disclaimer
In line with the Trust Project guidelines, this price analysis article is for informational purposes only and should not be considered financial or investment advice. BeInCrypto is committed to accurate, unbiased reporting, but market conditions are subject to change without notice. Always conduct your own research and consult with a professional before making any financial decisions. Please note that our Terms and Conditions, Privacy Policy, and Disclaimers have been updated.

Valdrin Tahiri
Valdrin discovered cryptocurrencies while he was getting his MSc in Financial Markets from the Barcelona School of Economics. Shortly after graduating, he began writing for several different cryptocurrency related websites as a freelancer before eventually taking on the role of BeInCrypto's Senior Analyst.
(I do not have a discord and will not contact you first there. Beware of scammers)
READ FULL BIO
Sponsored
Sponsored

