


The Bitcoin Dominance Rate (BTCD) has been decreasing at an accelerated rate since the beginning of July. The decrease should continue until the rate reaches the closest support area at 62.5%.
Current Support
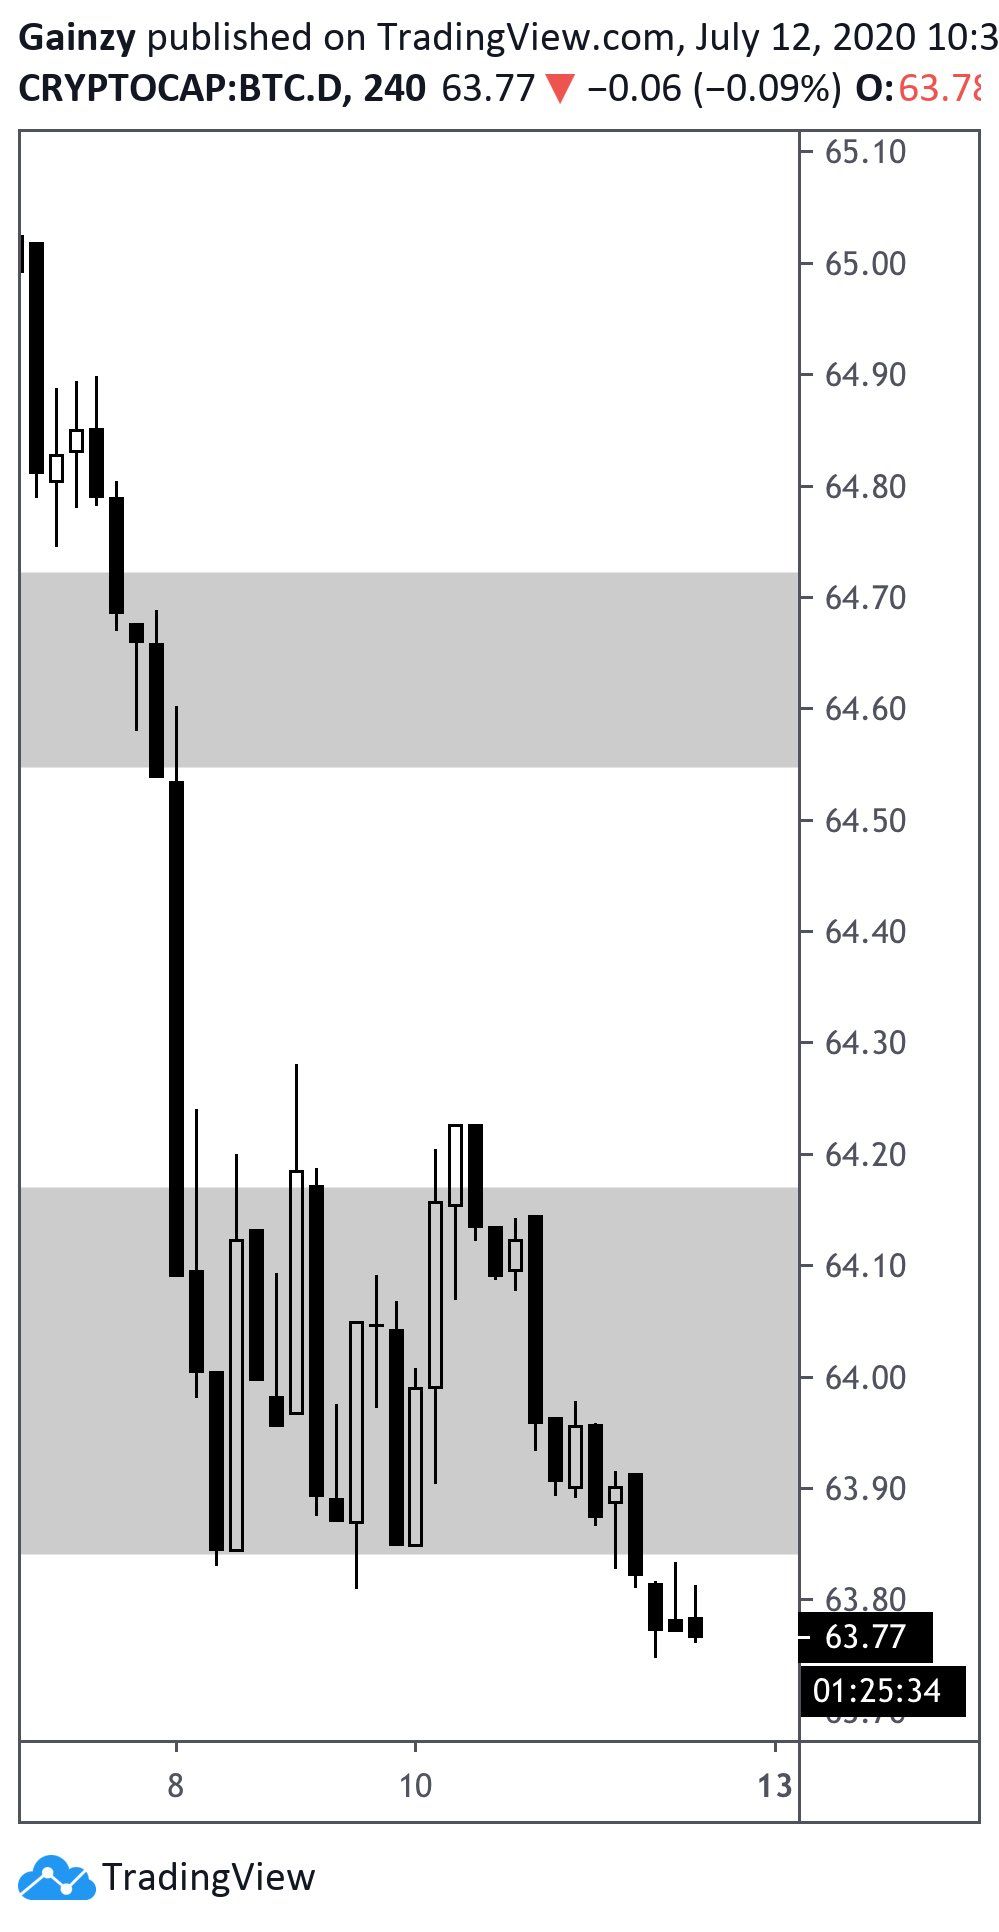
At the beginning of July, the BTCD broke down from a rising support line that had previously been in place since February 15. After breaking down, the price validated the line as resistance and has been declining at an accelerated pace since.
The closest support area is at 62.5%, the beginning of the rising support line. Technical indicators are bearish but don’t write off the chance for a reversal just yet. The RSI is deep in oversold territory but has not generated any type of bearish divergence yet.
The last time the RSI was this oversold, the rate began to move up alongside the ascending support line. While the 50 and 200-day MAs have made a bearish cross and are providing resistance to the price, the price has dropped considerably below both, suggesting that the short-term decline is overextended.

Cryptocurrency trader @Cryptogainz1 believes that there’s likely another leg up for altcoins since the Bitcoin dominance rate is going down and has broken down from an important support level.
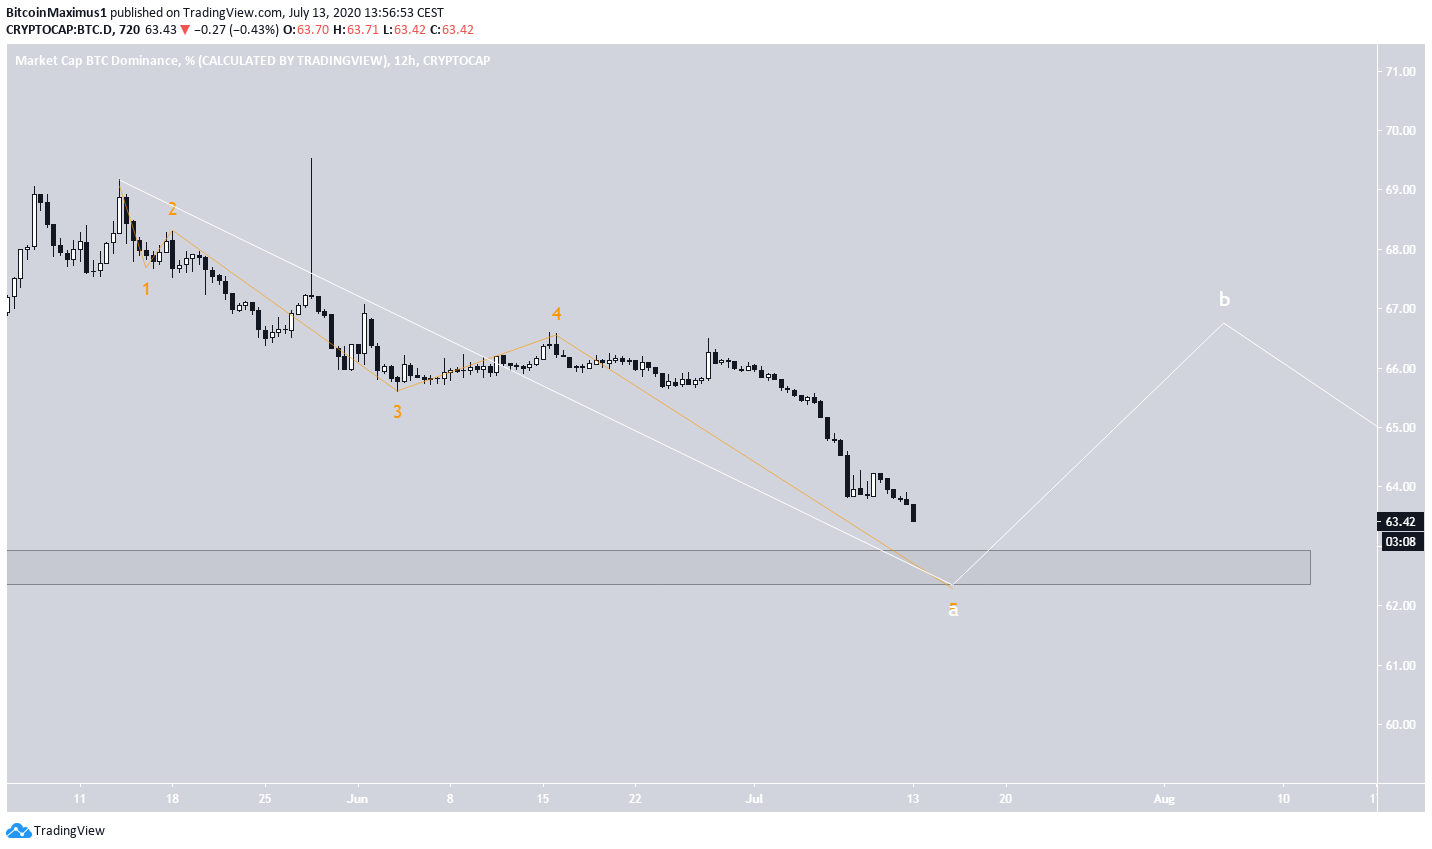
Besides the above analysis, the wave count also fits with this decline since the rate is likely in the fifth and final wave that began on May 11. The fifth wave has extended, and it should end inside the previously mentioned 62.5% support area. (For the longer-term wave count, click here.)
Relationship to Bitcoin
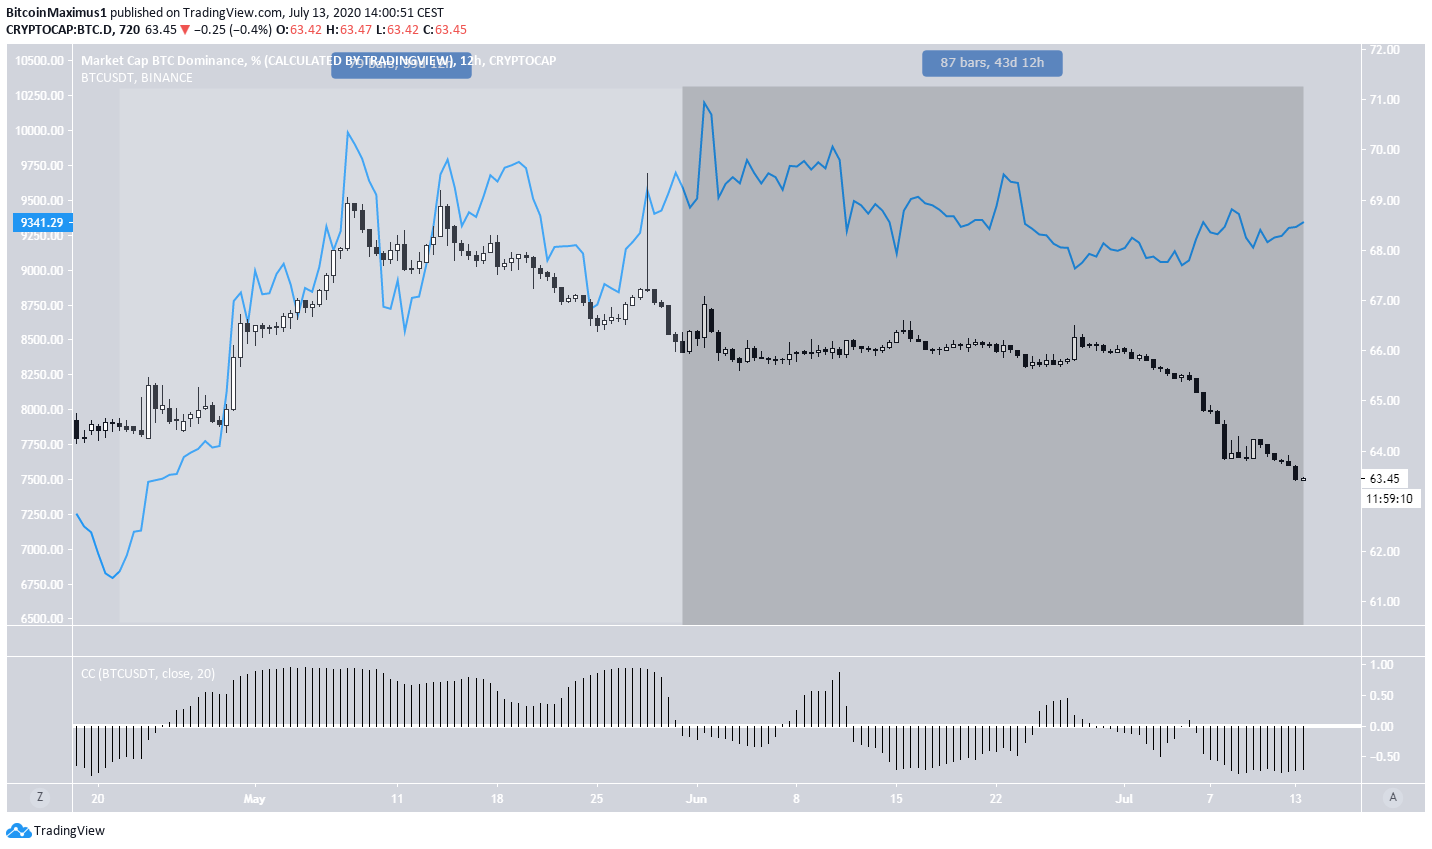
The BTCD (candlesticks) and the Bitcoin price (blue) are shown in the image below. In a 30-day period from April 20 to May 29, the BTCD and BTC price had a positive relationship, shown by correlation coefficient (CC) values near 1 at the bottom of the chart
This means that an increase in one caused an increase in the other. However, since then, the relationship has become negative. While there have been some periods of a positive relationship, as the histogram shows, the CC is currently near -0.5, indicating a negative relationship.
Therefore, in order for the BTCD to drop to the support area outlined, the BTC price would have to increase.
To conclude, the BTCD should decrease towards the support area outlined, before beginning a short-term upward move.


