The Bitcoin dominance rate (BTCD) is approaching a crucial support area, a breakdown below which could trigger a rapid downward move.
The rate should initiate a short-term bounce before resuming its downward momentum.
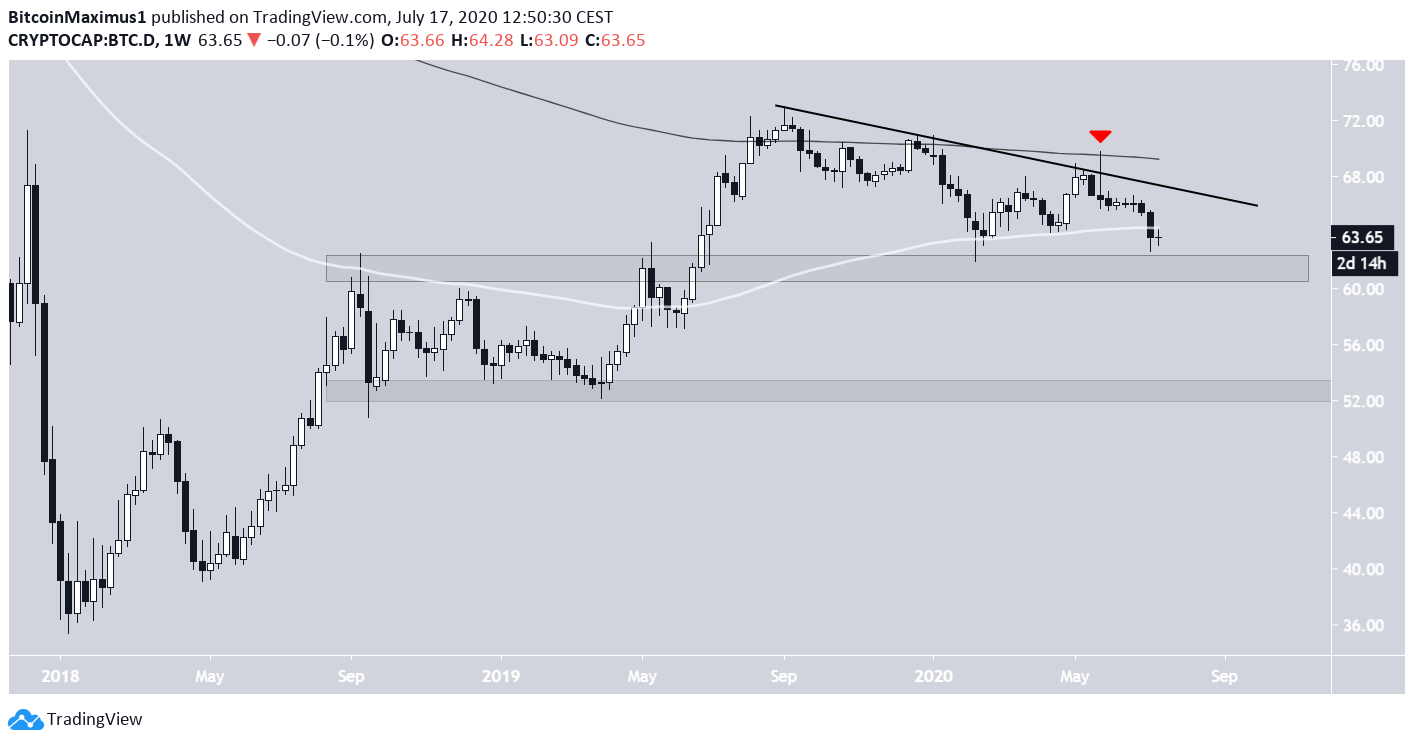
Long-Term Support
The BTCD has been declining since September 2019, following a descending resistance line. The line is also strengthened by the presence of the 200-week moving average (MA).
At the time of writing, the rate was losing the support of the 100-week MA, which has been a very good predictor of the trend over the past two years. BTCD has mostly been bullish when trading above it, and vice versa.
The closest support area is found near 61%, an area that has not been broken since May 2017. If the rate declines below this level, it should continue to fall to 52%.
While the bias is leaning bearish, it cannot be confirmed until the rate either breaks down from this area or out from the descending resistance line.
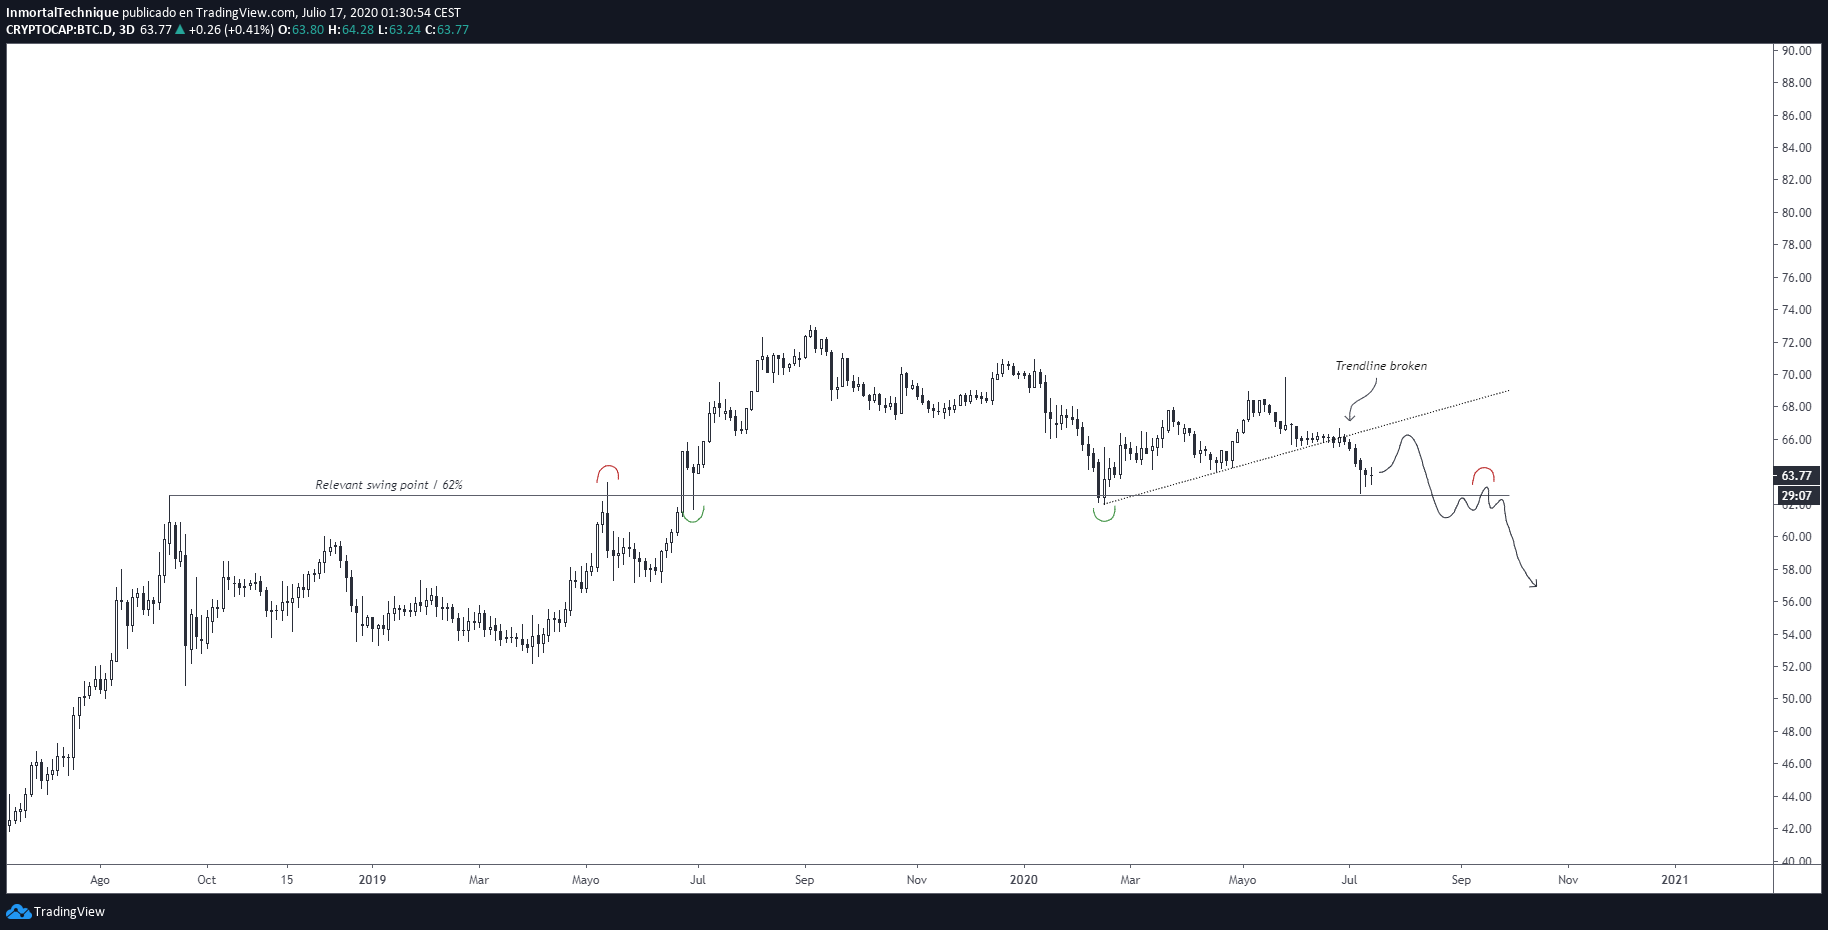
Cryptocurrency trader @inmortalcrypto stated that he’s closing altcoin positions because he believes a bounce is due. However, he also believes a long-term BTCD decline could begin if the rate loses the 62% support handle, which is in line with our analysis.
I think we will see a bounce here so ALT cool off incoming.
If we break and close below 62% (the most relevant lvl for me) probably we will see BIG alt rallies.
For now, I’ve reduced a bit my alt exposure , I will wait to see what BTC does.
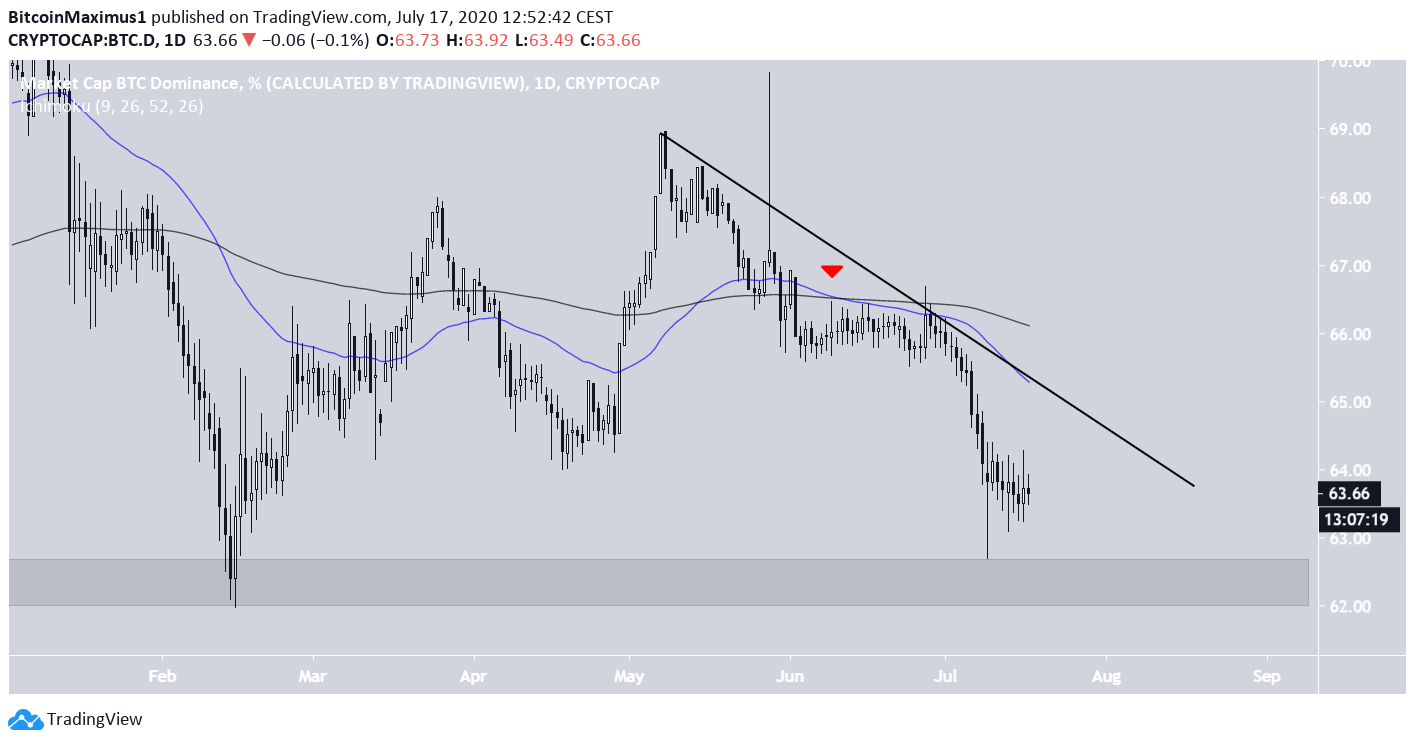
Possible BTCD Bounce
The daily chart provides a similar bearish picture. A bearish cross has occurred between the 50 and 200-day MAs. Both MAs are also strengthening the resistance provided by a descending resistance line.
The main support area in the daily chart is found at 62.5%, which would create a double bottom if the price were to decrease to this level.
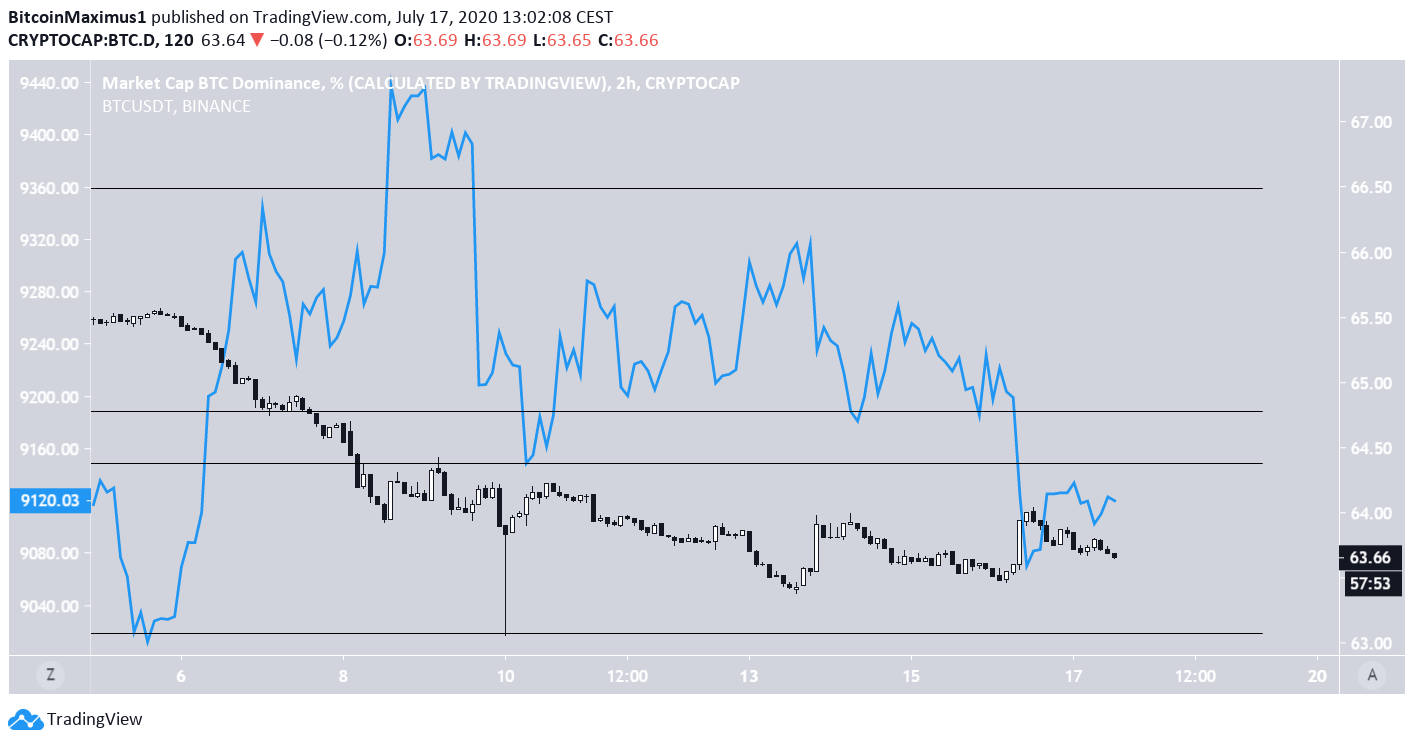
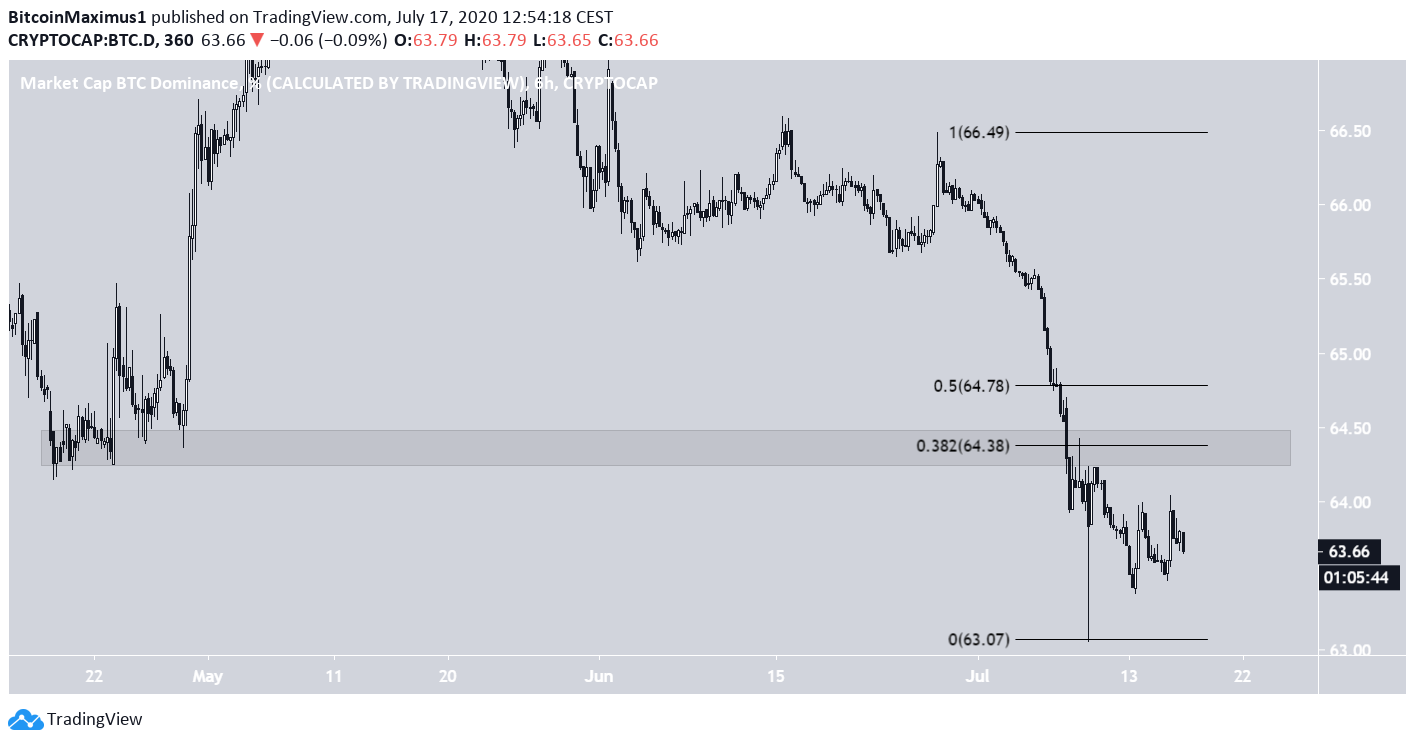
Similarly, the hourly chart shows that the price is creating an impulsive downward move. While a retracement is likely, with a possible test of 64.8%, the rate should resume its downward move afterward.
Relationship to Bitcoin
The Bitcoin price (blue) and BTCD (Candlesticks) are shown in the image below. Since at least July 7, the relationship between the two has been negative, meaning an increase in one has caused a decrease in the other.
For a short-term bounce in BTCD to take place, the BTC price would need to decline again, which is in line with our analysis.