
![The BAT Price Has The Potential For a 300%+ Upward Move [Premium Analysis]](https://beincrypto.com/wp-content/uploads/2019/12/BIC_BAT_accumulation.jpg.optimal.jpg)
Let’s dive deep into the price action and try to answer this question.What does this $BAT chart say to you? pic.twitter.com/bk1YDPwsMX
— Posty (@PostyXBT) December 30, 2019
New Market Cycle
The long-term chart suggests that the BAT price has possibly begun a new upward cycle. Firstly, the Basic Attention Token price had created a support area at 2000 satoshis that held throughout 2018. The price broke down below it in August 2019. However, instead of falling to the next support area, BAT reversed and reclaimed the range. Secondly, the weekly MACD has just made a bullish cross. The previous time this occurred was in October 2018, leading to an eventual 350 percent increase. Therefore, it is entirely possible that the upward move from September-November was the first wave of a five-wave Elliott formation and the price is currently correcting. The rate of increase should accelerate once BAT breaks out above 3200 satoshis.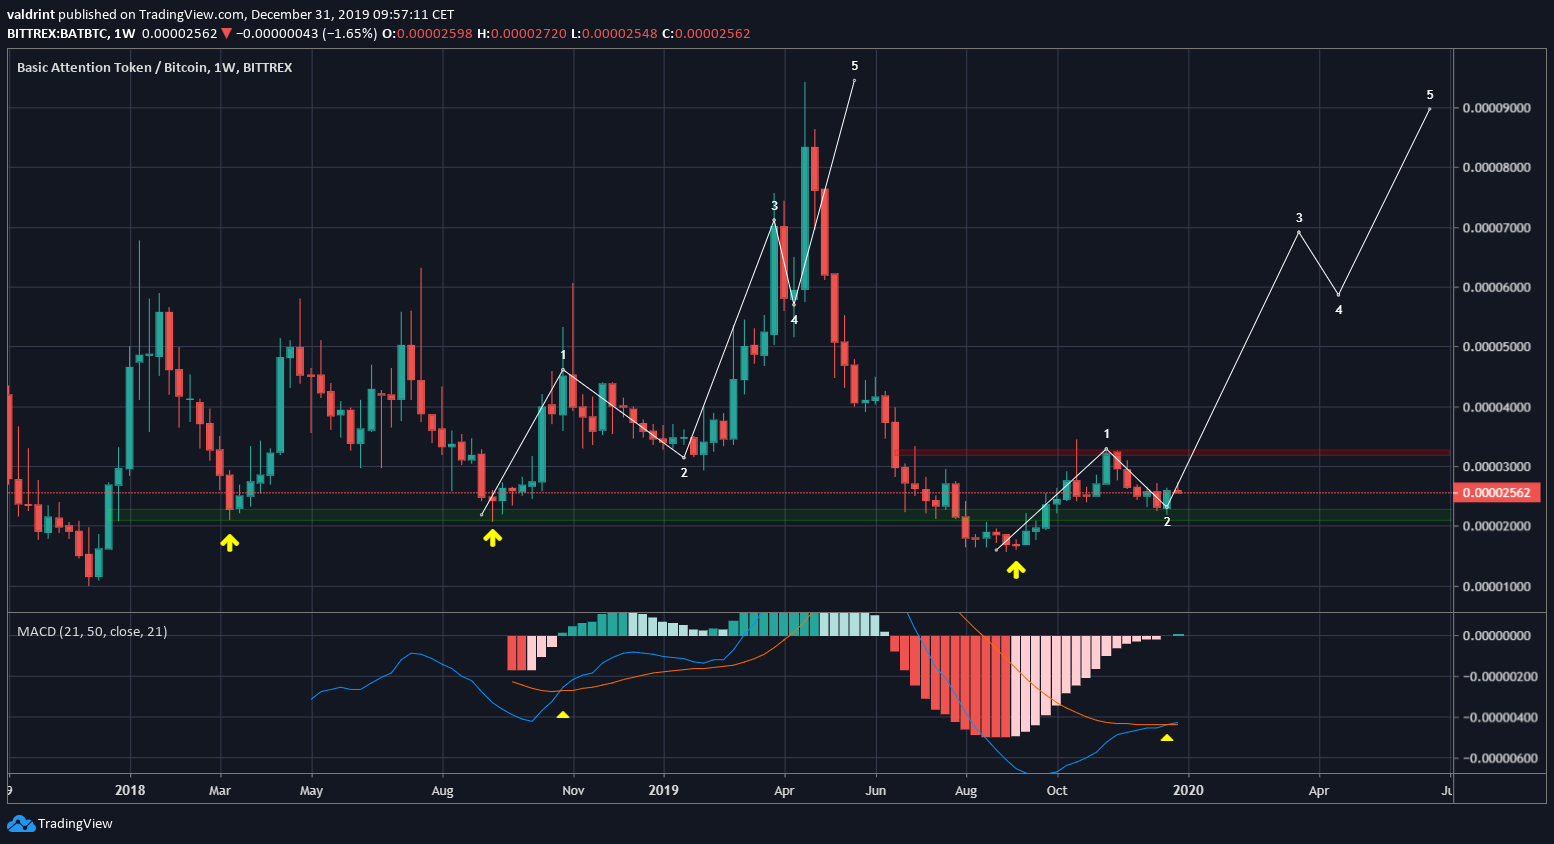 Isolating the upward move from September, several features are revealed.
The Basic Attention Token price has possibly finished both a five-wave of the upward move and an A-B-C correction with an extended C wave.
The correction ended inside the 2200 satoshis support area, which coincides with the 0.618 Fib level, making it a very suitable place to initiate a reversal.
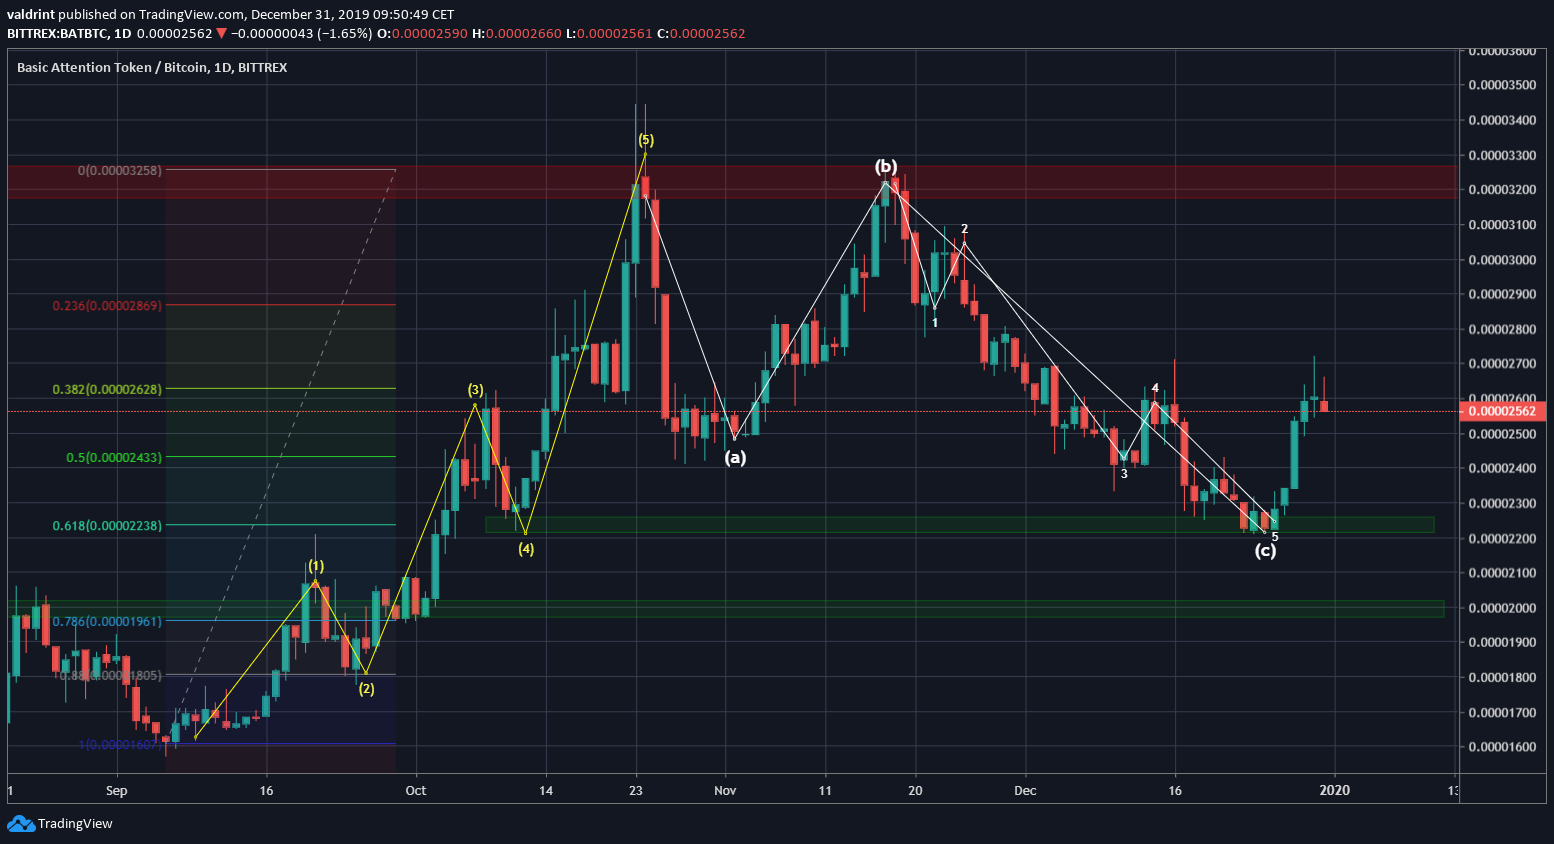
Isolating the upward move from September, several features are revealed.
The Basic Attention Token price has possibly finished both a five-wave of the upward move and an A-B-C correction with an extended C wave.
The correction ended inside the 2200 satoshis support area, which coincides with the 0.618 Fib level, making it a very suitable place to initiate a reversal.
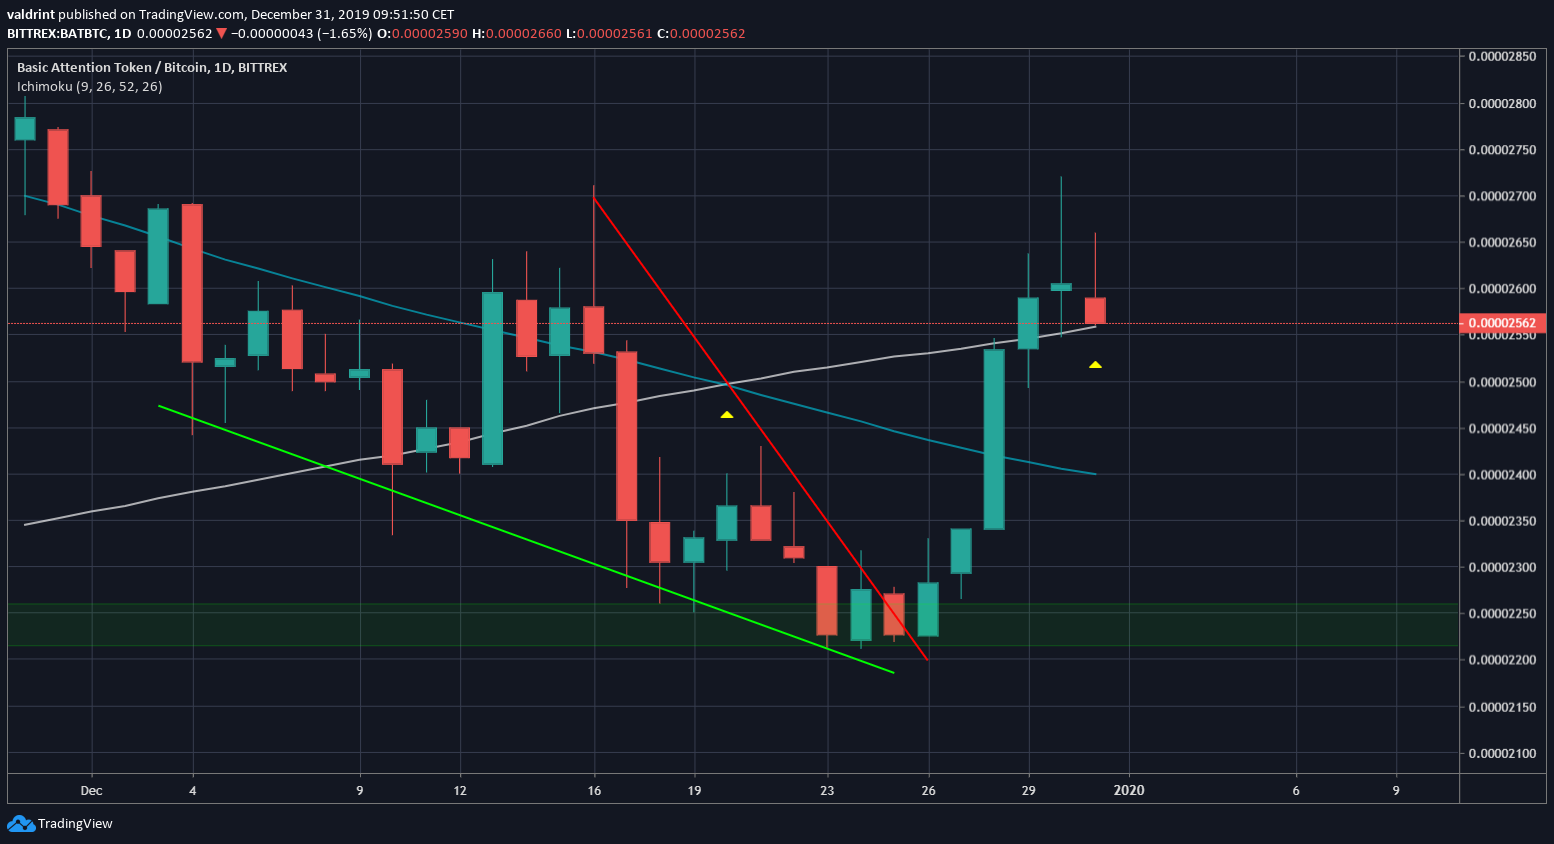
 The breakout transpired after the BAT price created a descending wedge. Additionally, it has moved above the 100- and 200-day moving averages (MAs) — which have made a bullish cross. The price has possibly found support above the 100-day MA.
Short-Term Movement
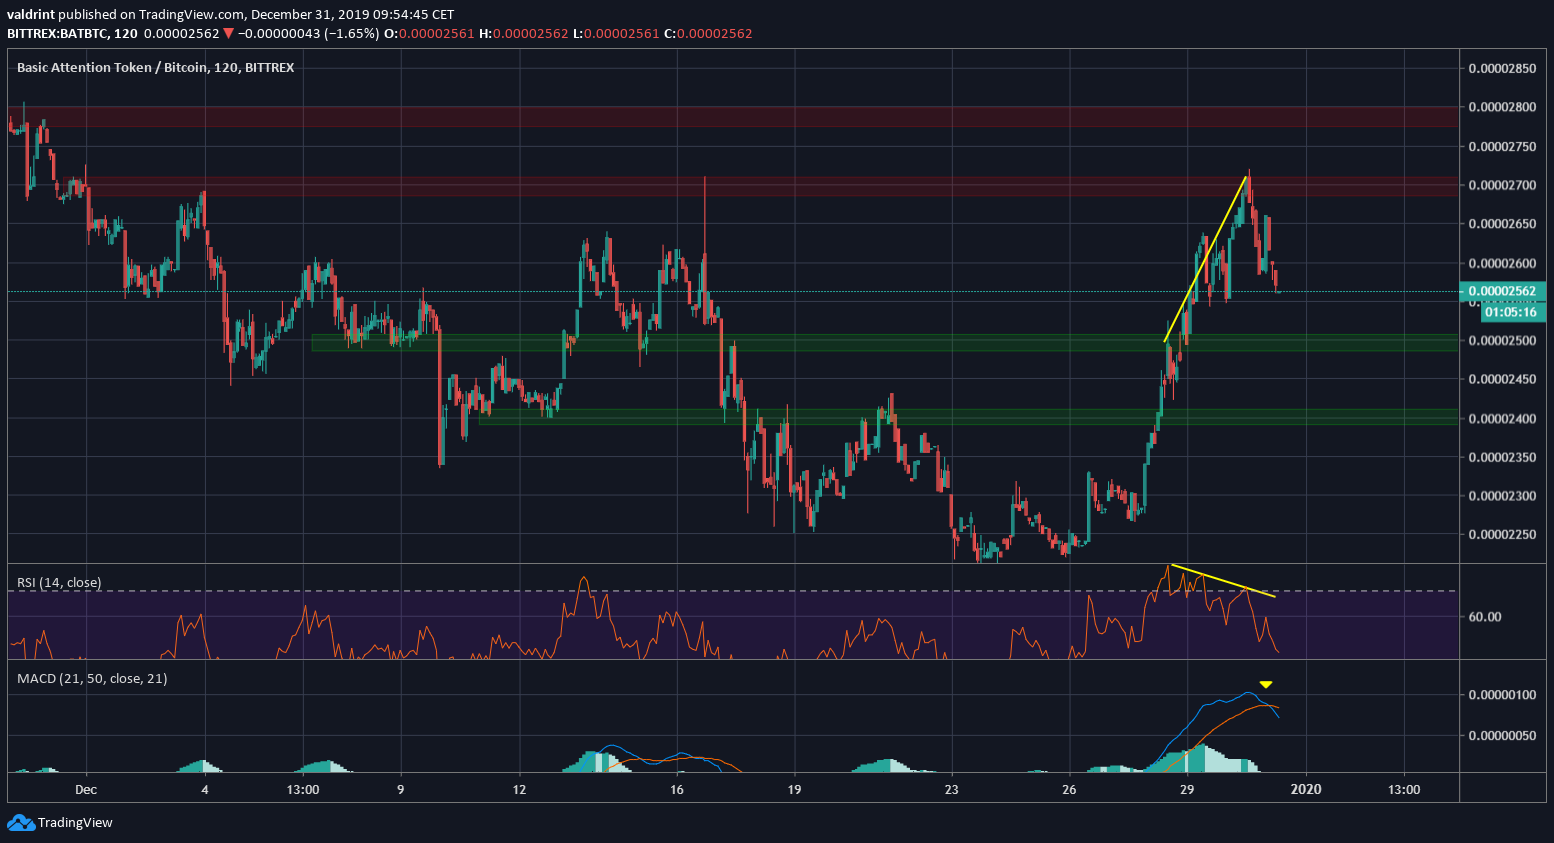
In the short-term, the price movement was perfectly outlined by another cryptocurrency trader, @devchart, who stated that the price has broken out and retested both the 2400 and 2600 satoshi resistance area and is heading for 2800.Since the tweet, the BAT price made an unsuccessful attempt at reaching 2800 satoshis, topping out near 2750. The movement was combined with a bearish divergence in both the RSI & the MACD, suggesting that the price will head downwards. Therefore, we can expect it to reach at least one of the support areas at 2500 and 2400 satoshis, respectively.$BAT (including tutorial)
— Devchart 👨🏻💻 (@devchart) December 30, 2019
4H TF@BTC_JackSparrow convinced me to take another look so here we go.
Got my alert and went for the trade.
Here is another quick breakout and retest (need to close above) example.#BAT#Alts#Crypto
Alerts by @ChartAlertsIO pic.twitter.com/7SdGOTLOJr
 To conclude, the BAT price has likely begun a new market cycle. Since the correction is finished, we can expect the price to move upward and the rate of increase to accelerate after it breaks out above 3200 satoshis. While the short-term outlook is bearish, both the medium- and long-term ones are bullish.
Disclaimer
In line with the Trust Project guidelines, this price analysis article is for informational purposes only and should not be considered financial or investment advice. BeInCrypto is committed to accurate, unbiased reporting, but market conditions are subject to change without notice. Always conduct your own research and consult with a professional before making any financial decisions. Please note that our Terms and Conditions, Privacy Policy, and Disclaimers have been updated.
