The Tezos (XTZ) price briefly reached a new all-time high on Aug 13 but has pulled back slightly.
As long as it is able to maintain prices above the support levels that BeInCrypto will outline below, the upward move is expected to continue.
XTZ Makes New All-Time High
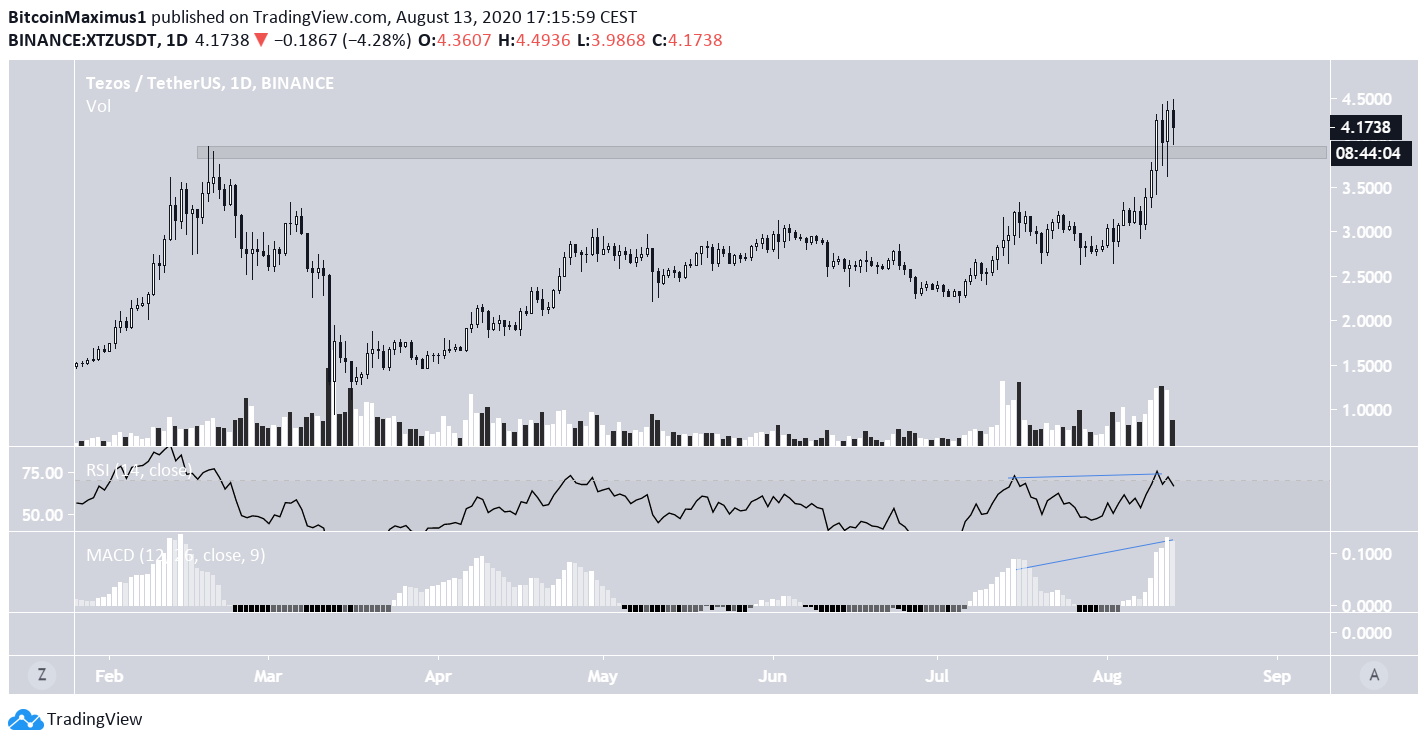
The XTZ price has been gradually increasing since it reached a bottom on March 13. After a corrective period that lasted throughout May and June, Tezos resumed its upward movement. The acceleration picked up after a long lower-wick on Aug 2 and has gained 54% since.
On Aug 10, the price first broke its previous all-time high of $3.95. XTZ has continued its push to the upside, culminating in a new high of $4.49 yesterday.
Technical indicators show that the trend is still strong. Neither the MACD nor the RSI have generated bearish divergence, and the latter has just reached overbought levels. In addition, volume has not been considerably low during the most recent upward move.
Therefore, as long as the price is trading above the $3.80 level, confirming it as support, it is expected to continue making new highs.
Short-Term Weakness
The short-term chart, on the other hand, is showing some weakness.
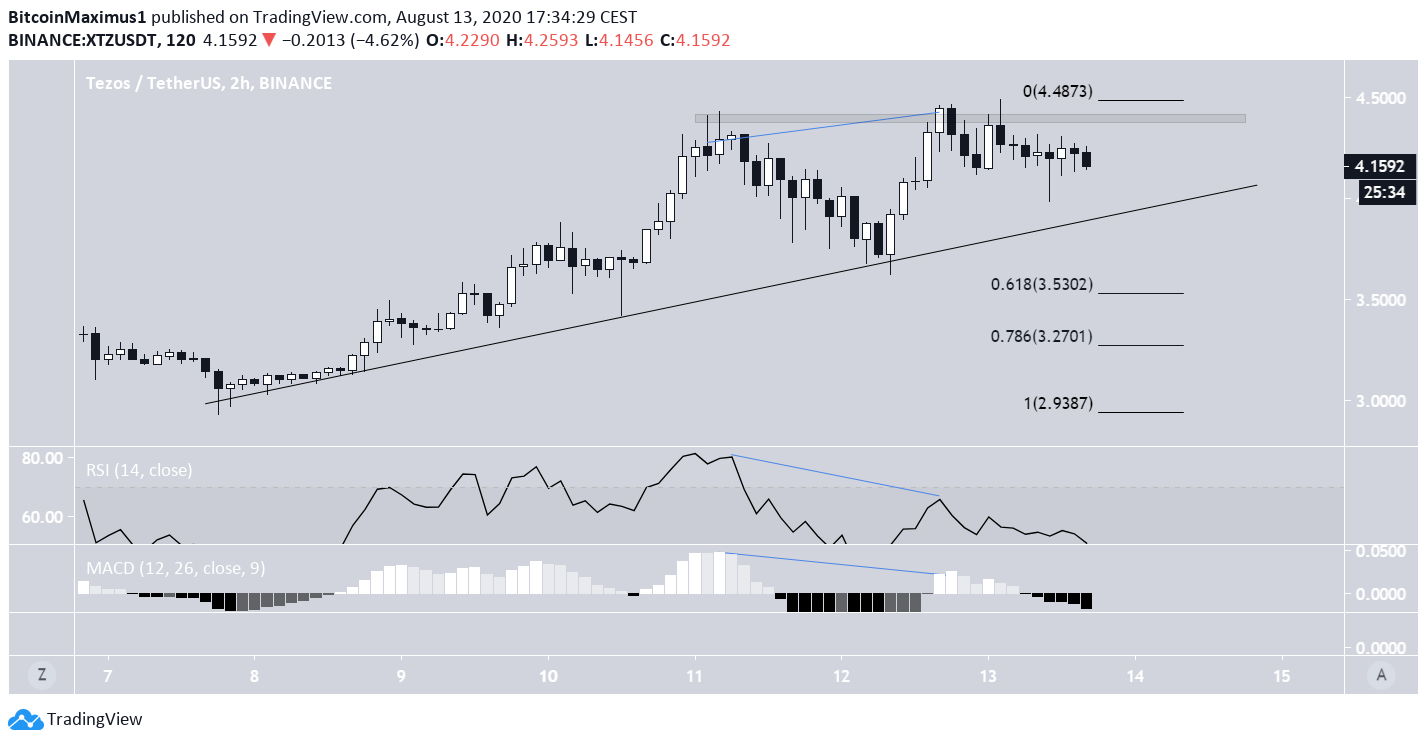
In the 2-hour time-frame, both the RSI and MACD have generated significant bearish divergence, causing the ongoing decrease. Currently, the price is heading towards the ascending support line it has been following since Aug 2.
If the price breaks down from this level, it would be expected to bounce between $3.27-$3.53, the 0.618-0.786 Fib levels of the entire upward move.
As long as the price is trading above this level, it is considered bullish and XTZ is still expected to generate further new all-time highs.
Wave Count
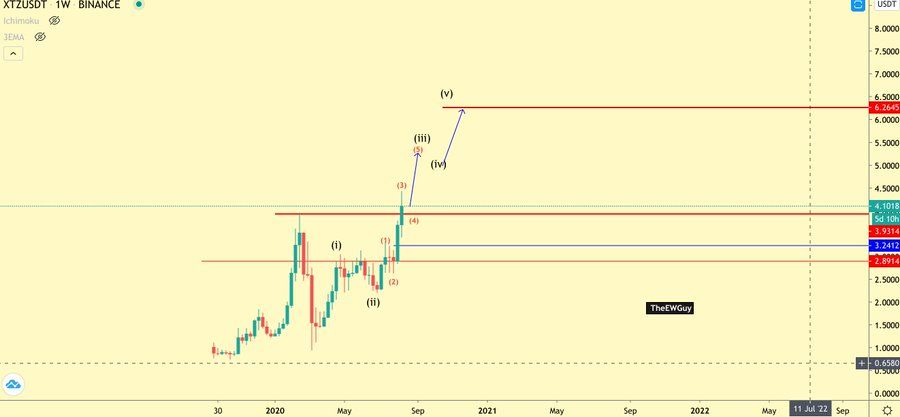
Cryptocurrency trader @TheEWguy stated that he is expecting the price to move above $6. He outlined a five-wave formation which suggests that the price is currently in the fourth sub-wave of the third wave.
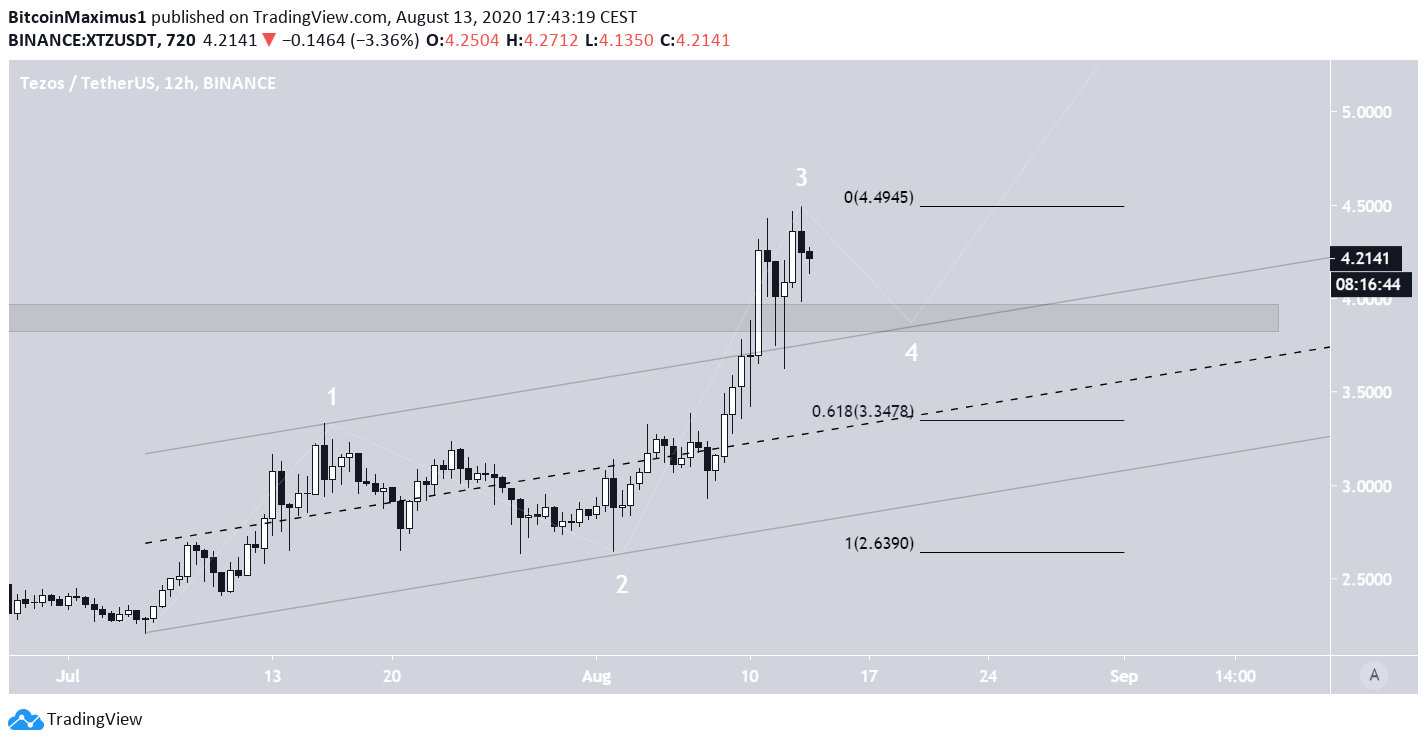
When looking closer at the movement, it is possible that the price has already completed the third wave, and is currently in the fourth. In order for this particular wave count to be the correct, the first wave would have to be a leading diagonal.
There are two main levels where wave 4 could end. The first is the previous resistance area at $3.80, which coincides with the resistance line of a parallel channel that XTZ has broken out from.
The second is the 0.618 Fib level of the increase, found at $3.34. This is also the middle of the channel.
If the price decreases below this level, it could mean that the upward trend has ended.