

Both the XTZ/USD and the XTZ/BTC pairs have been declining since the beginning of February.
However, the current move and technical indicators suggest that the retracement is nearing its end and the price will soon continue moving upwards.
Long-Term Triangle
Tezos has been following a rising support line since it reached a low on October 27, 2019. While the price dropped below this area at the beginning of July, it found support above the 200-day moving average (MA) and has since reclaimed that area. Failed breakdowns such as these often indicate that the price will reverse in the other direction. The price is trading above both the 50 and 200-day MAs, which previously made a bullish cross. Furthermore, the daily RSI is above 50 and there is no bearish divergence yet. In addition, it seems that the price is trading inside a symmetrical triangle, which can be formed by drawing a descending resistance line from the February high. Since the triangle is taking place after an upward move, a breakout upwards from the pattern is expected. If so, the closest resistance area would be found at 40,000 satoshis.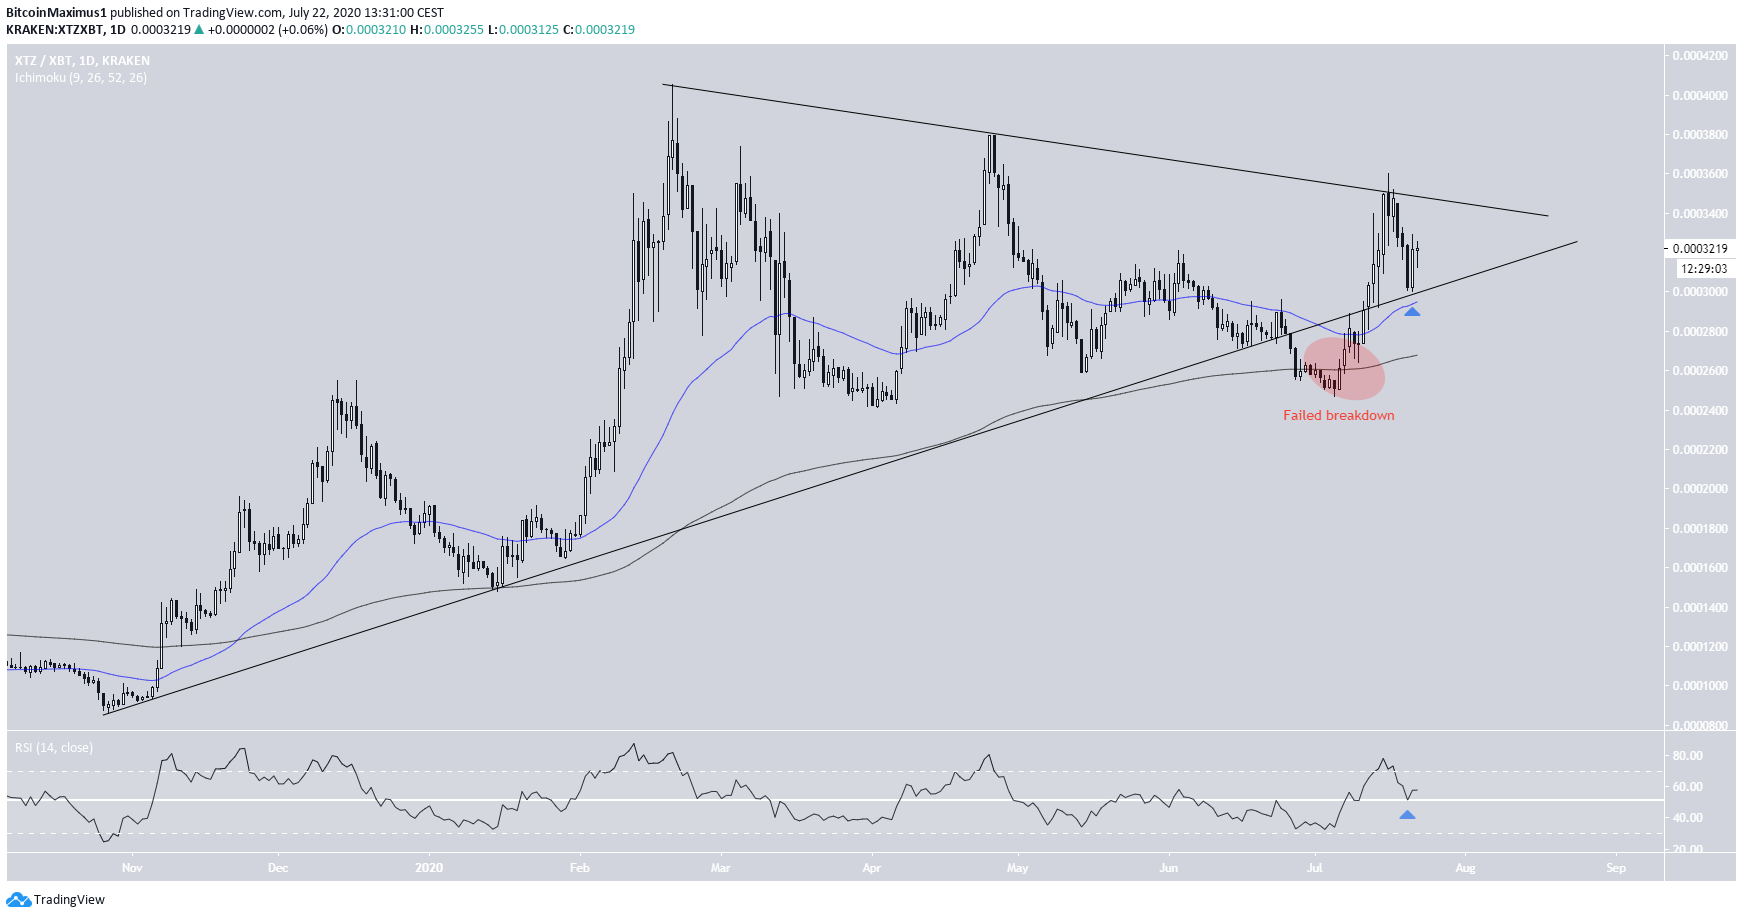
XTZ/USD
The XTZ/USD pair also looks bullish, showing a breakout from a descending resistance line that had been in place since February. After breaking out, the price returned to validate the line as support, along with the 50-day MA. Once it did, the price created a bullish engulfing pattern, a sign that the upward trend is likely to resume. If the price continues rising, the closest resistance area would be found at $3.9, near the previous February highs.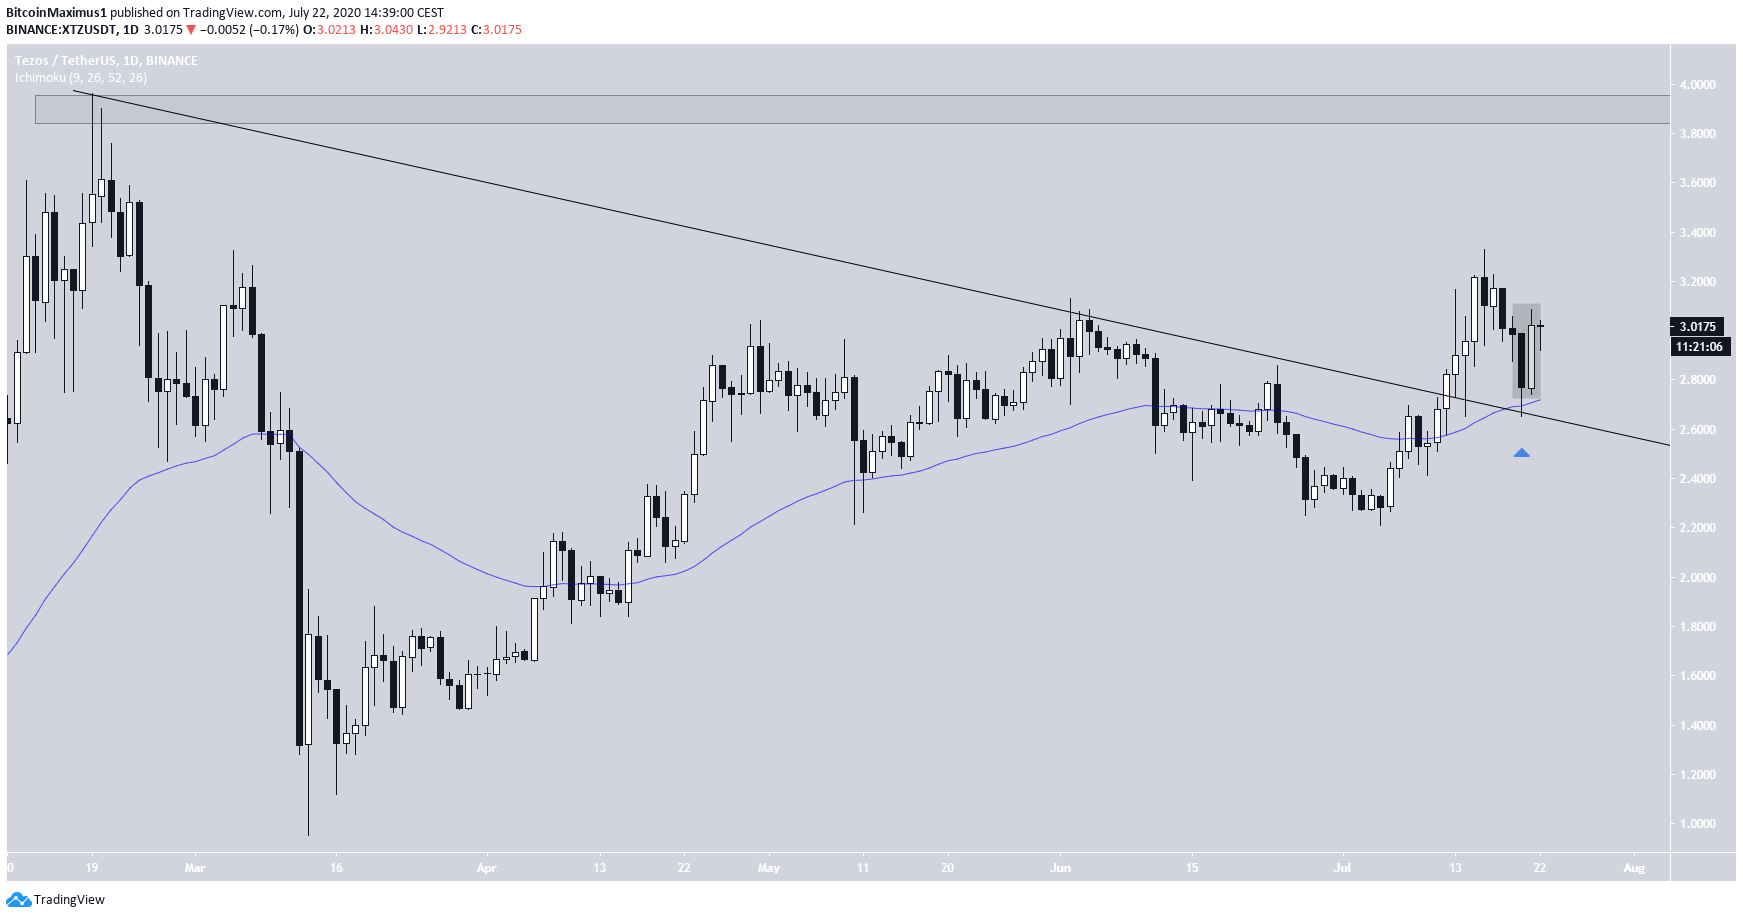
Disclaimer
In line with the Trust Project guidelines, this price analysis article is for informational purposes only and should not be considered financial or investment advice. BeInCrypto is committed to accurate, unbiased reporting, but market conditions are subject to change without notice. Always conduct your own research and consult with a professional before making any financial decisions. Please note that our Terms and Conditions, Privacy Policy, and Disclaimers have been updated.

Valdrin Tahiri
Valdrin discovered cryptocurrencies while he was getting his MSc in Financial Markets from the Barcelona School of Economics. Shortly after graduating, he began writing for several different cryptocurrency related websites as a freelancer before eventually taking on the role of BeInCrypto's Senior Analyst.
(I do not have a discord and will not contact you first there. Beware of scammers)
READ FULL BIO
Sponsored
Sponsored