
The Tezos (XTZ) price has been decreasing since reaching a peak of 25,520 satoshis on Dec 17 but could see a significant turnaround in the neighborhood of 12,000 satoshis.
On Jan 8, BeInCrypto published an article outlining the top-five cryptocurrency projects to keep an eye on in 2020:
- QNT
- OCEAN
- XTZ
- DAG
- FCT
Here Are the Five Blockchain Projects to Keep an Eye on in 2020.$QNT $OCEAN $XTZ $DAG $FCT@quant_network @oceanprotocol @tezos @Conste11ation @factomhttps://t.co/TNRaVCHgcq
— BeInCrypto (@beincrypto) January 8, 2020
In this article, the third in a five-part series, we will take a closer look at Tezos (XTZ), and go over a few possible scenarios for its future movement.
Tezos Trading Range
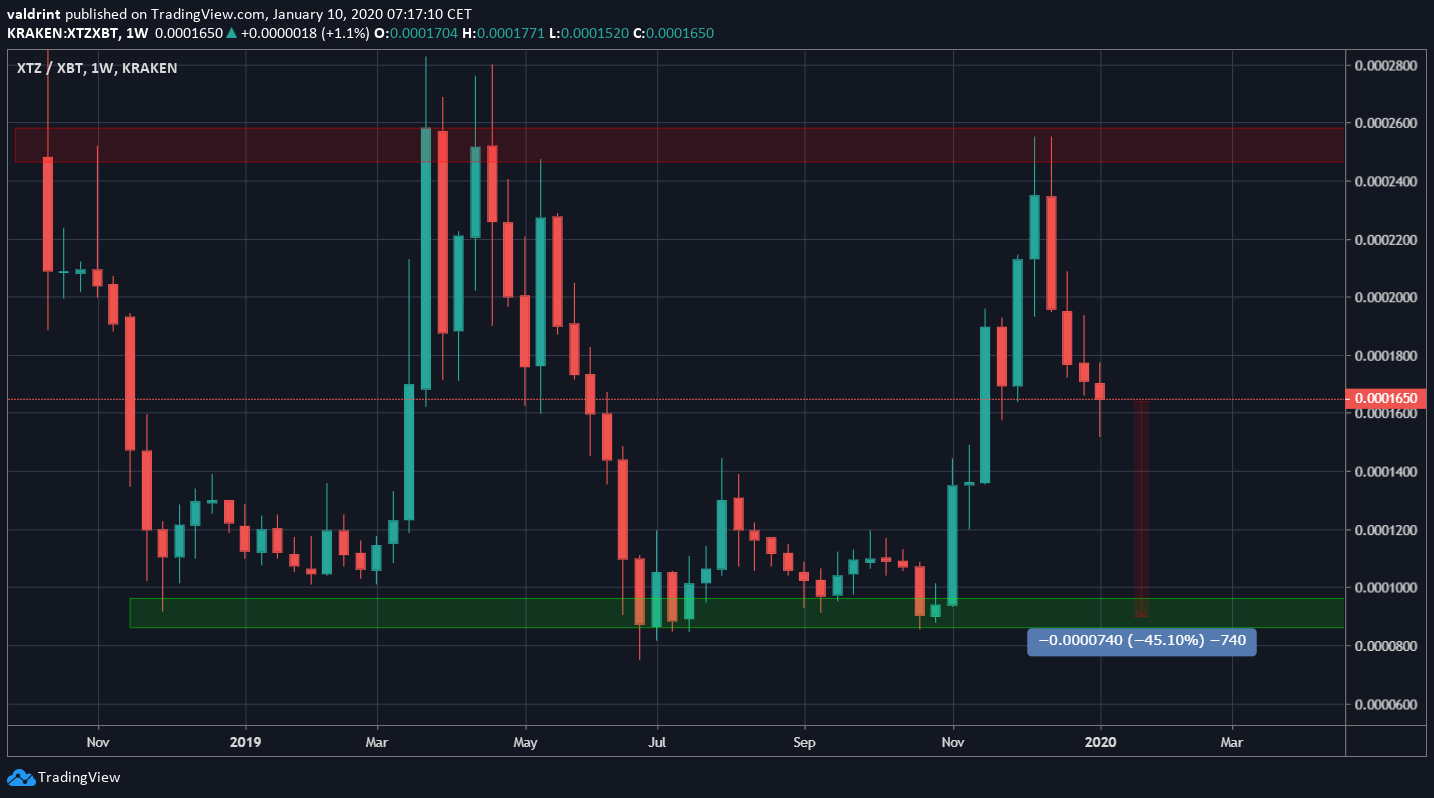
Since October 2018, the Tezos price has been trading in a range between 9,000 and 26,000 satoshis. Both the support and resistance areas have been validated thrice.
On Dec 17, 2019, the price reached a peak of 25,520 satoshis, just slightly below its 2019 high of 26,600 satoshis in April, and has been decreasing since. A continuation of this downward move to the next support level would constitute a 45% decrease from the current price.
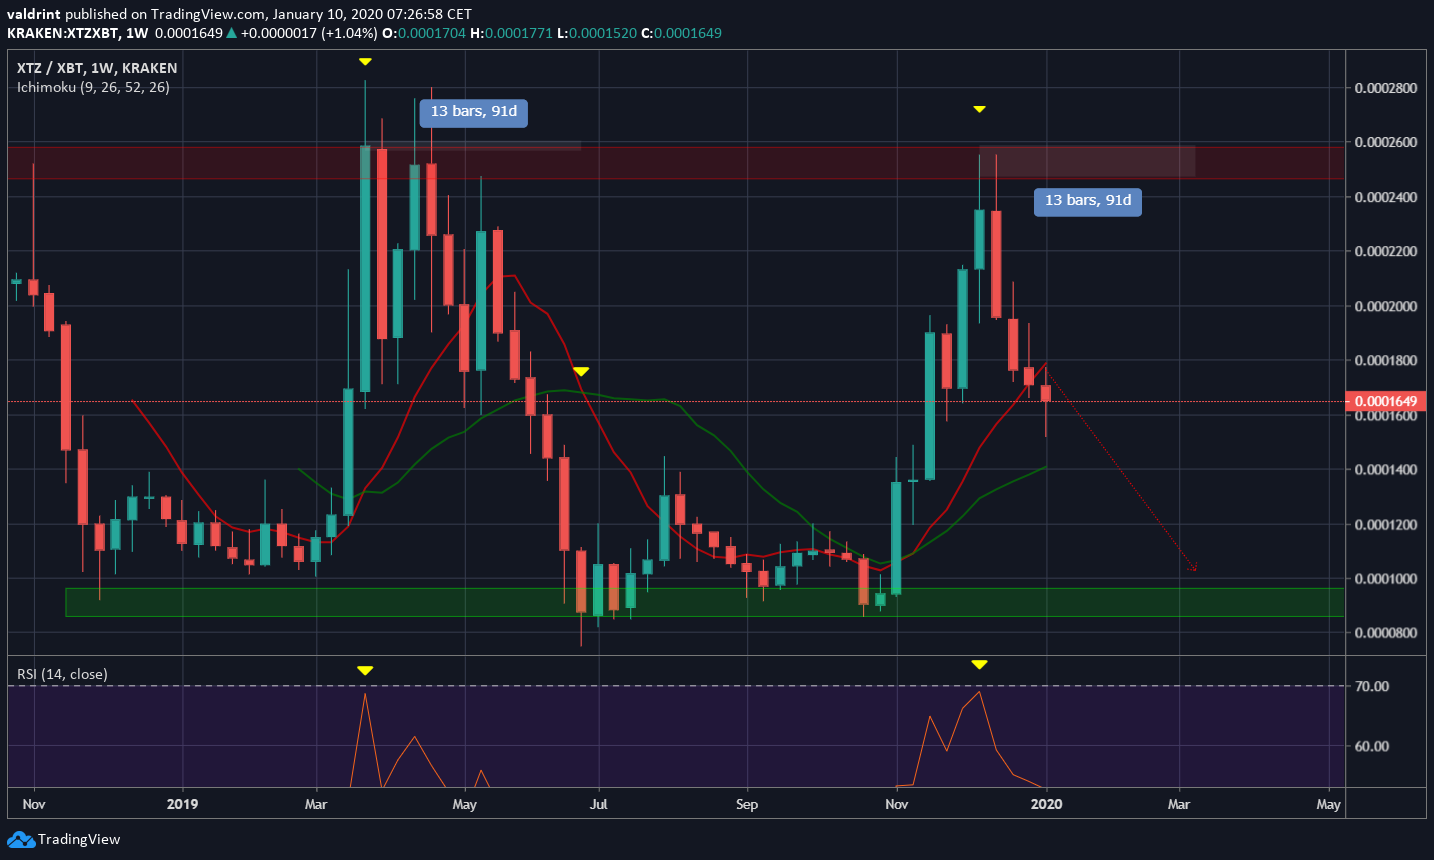
The Dec 17 high and the movement that followed have several similarities with its movement throughout March and April of 2019. Both saw RSI values near 70 — quite close to being considered overbought. Shortly after, the price began to slip back down.
The 10 and 20-week moving averages (MA) made a bearish cross 91 days after this RSI value was reached, coinciding with the bottom of the said move. If the same pattern repeats itself, the price would reach support on March 9, combining this low with a bearish cross of the aforementioned MAs.
2020 Symmetrical Triangle Possibilities
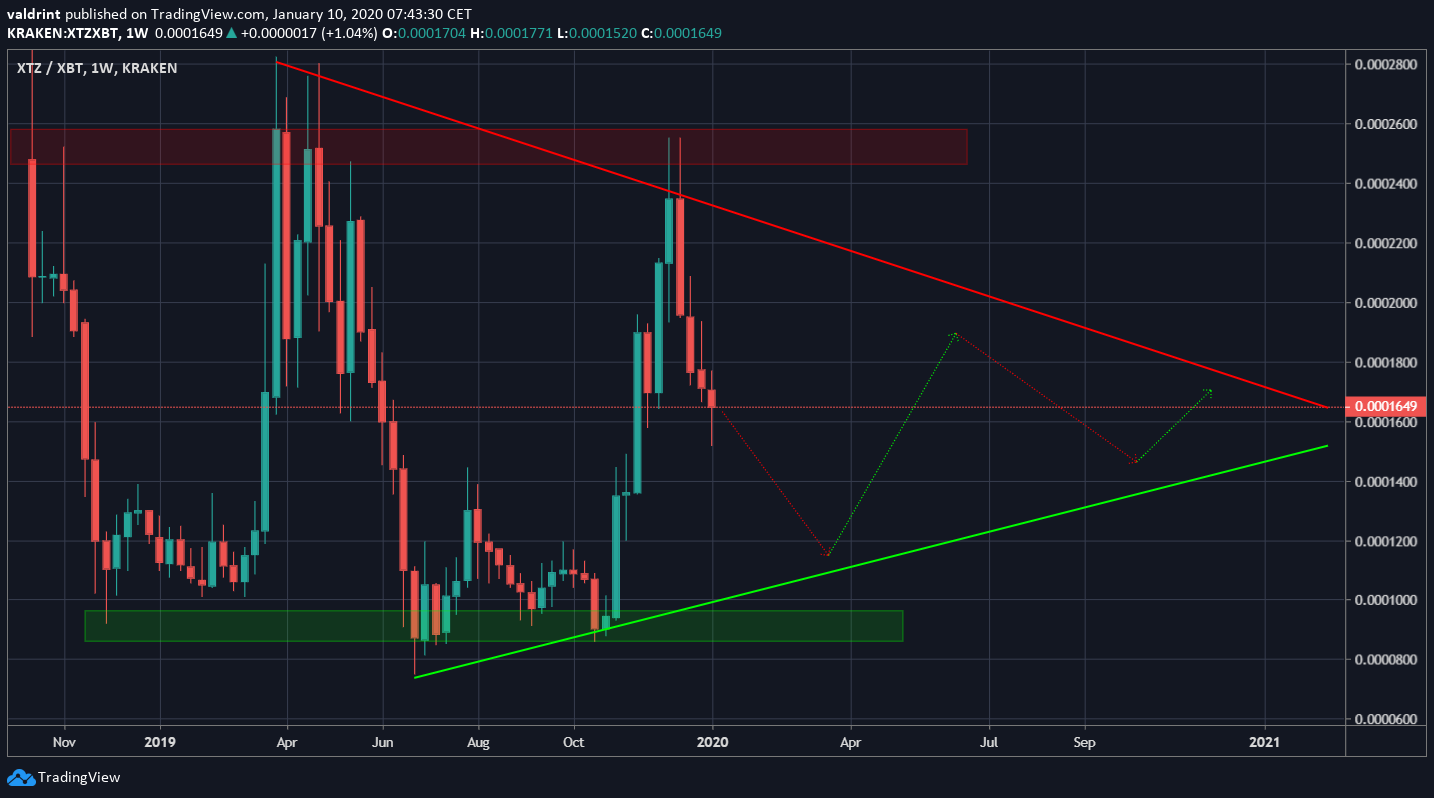
Besides the trading range, there is the possibility that the price is trading inside a symmetrical triangle. However, the presence of wicks makes it difficult to outline whether it’s following horizontal or descending/ascending resistance/support lines.
The time period of the current decrease would not be altered even if this was the case. However, the price would not reach the support area, but rather make a low above the ascending support line. Afterward, an upward move towards the resistance line could take XTZ back to 20,000 satoshis, depending on when it occurs.
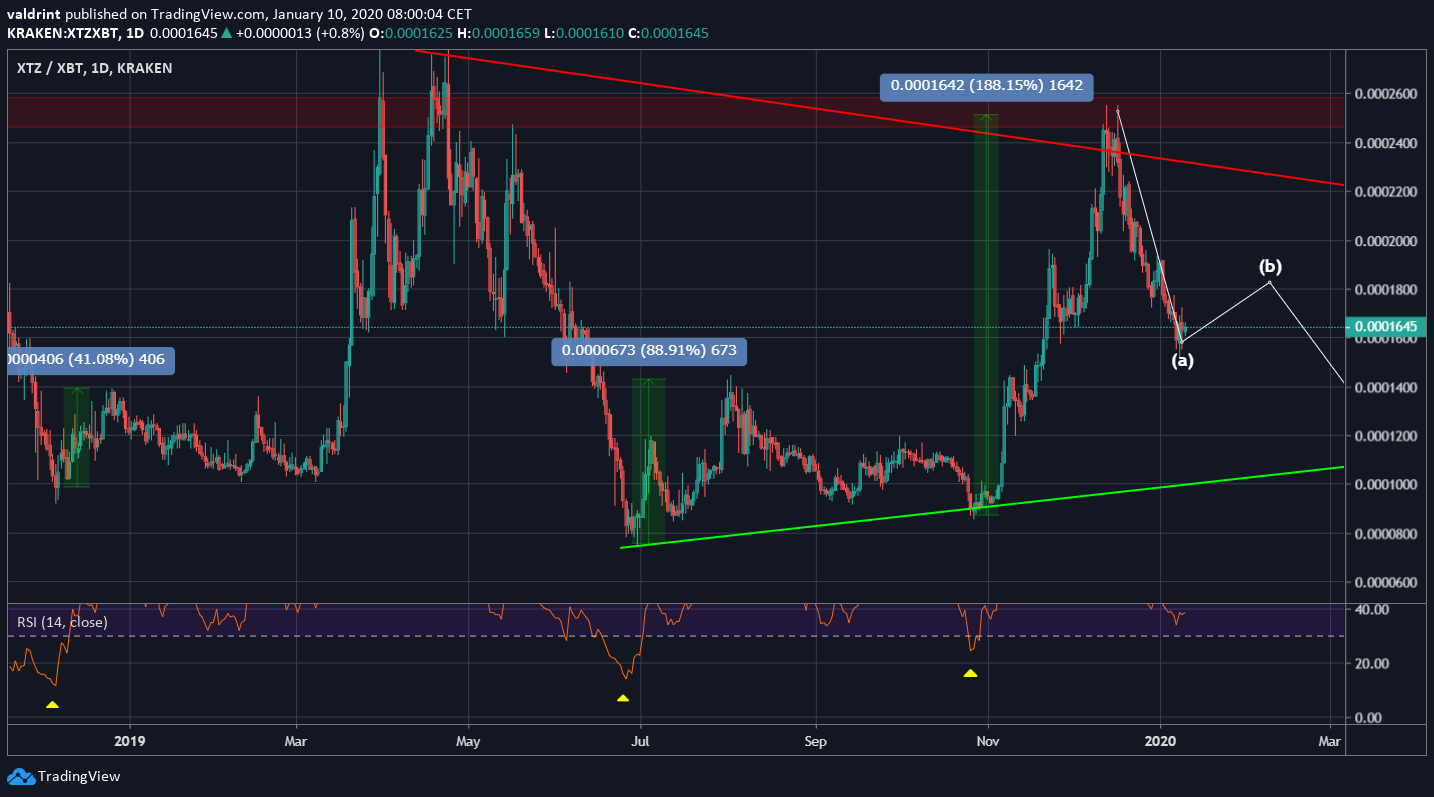
Looking at the daily chart, this would have the price complete an A-B-C correction near 12,000 satoshis, before resuming its upward movement towards the resistance line of the triangle.
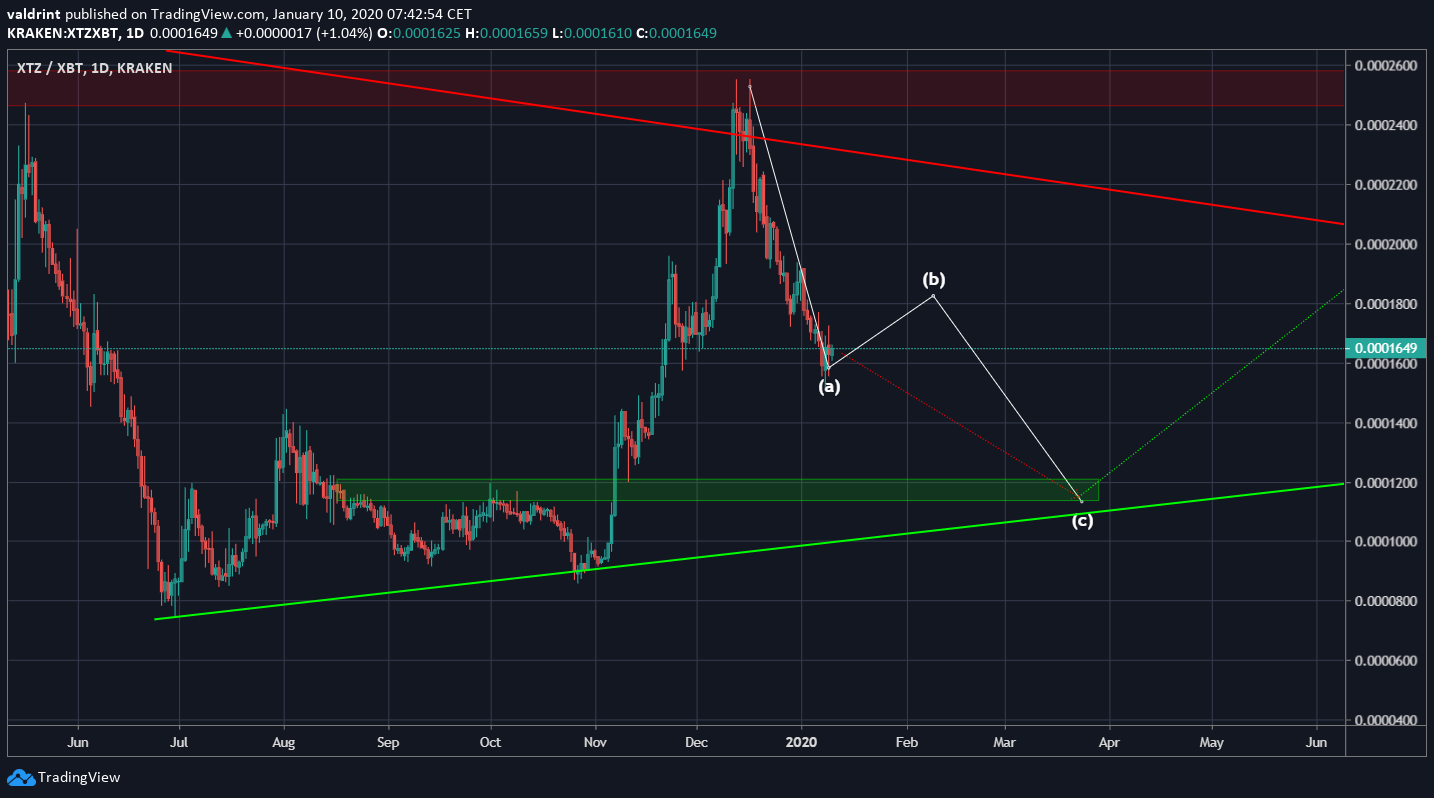
This movement is supported by the daily RSI readings. Each time the daily RSI has been oversold, an upward move with a magnitude between 40-190% followed. The current RSI level is 35, slightly above the oversold level of 25, indicating that it might soon drop inside these levels if the aforementioned decrease occurs.
This reduces the possibility that the price will fall all the way to the support area at 8,000 satoshis, rather suggesting that it will make a low near the ascending support line at 12,000 satoshis.
To conclude, the Tezos price is in a corrective period, which could continue until March 2020. Afterward, it is likely that the price will trade within the confines of the long-term symmetrical triangle.
