


The Feb. 24-26 decrease in the cryptocurrency markets did not spare Tezos, which broke down below its pattern and erased all of the gains from the previous week. But, XTZ has outlasted the decrease and is seemingly preparing for another upward move.
Tezos (XTZ) Price Highlights
- The price has previously broken down from a descending triangle.
- There is support at $2.5
- XTZ broke out from a descending resistance line.
- The price is following an ascending support line.
- There is resistance at $3.3
Crypto trader @HackermanAce tweeted an XTZ price chart, outlining his areas of interest for initiating long positions, which are at $1.8 and $2.4, respectively. The current price is at $2.77, so a significant decrease would be required for the price to get there.
My plan is watching the reactionary zone to look for a swing trade and from there my target would be the kijun.
The ideal long zone box is where im going to go big on tezos positioning and i will set some bids just a bit lower incase we wick. pic.twitter.com/lqVASCG9fG
— Ace (@HackermanAce) February 26, 2020
Let’s take a closer look at the Tezos price movement and determine if the decrease will actually occur.
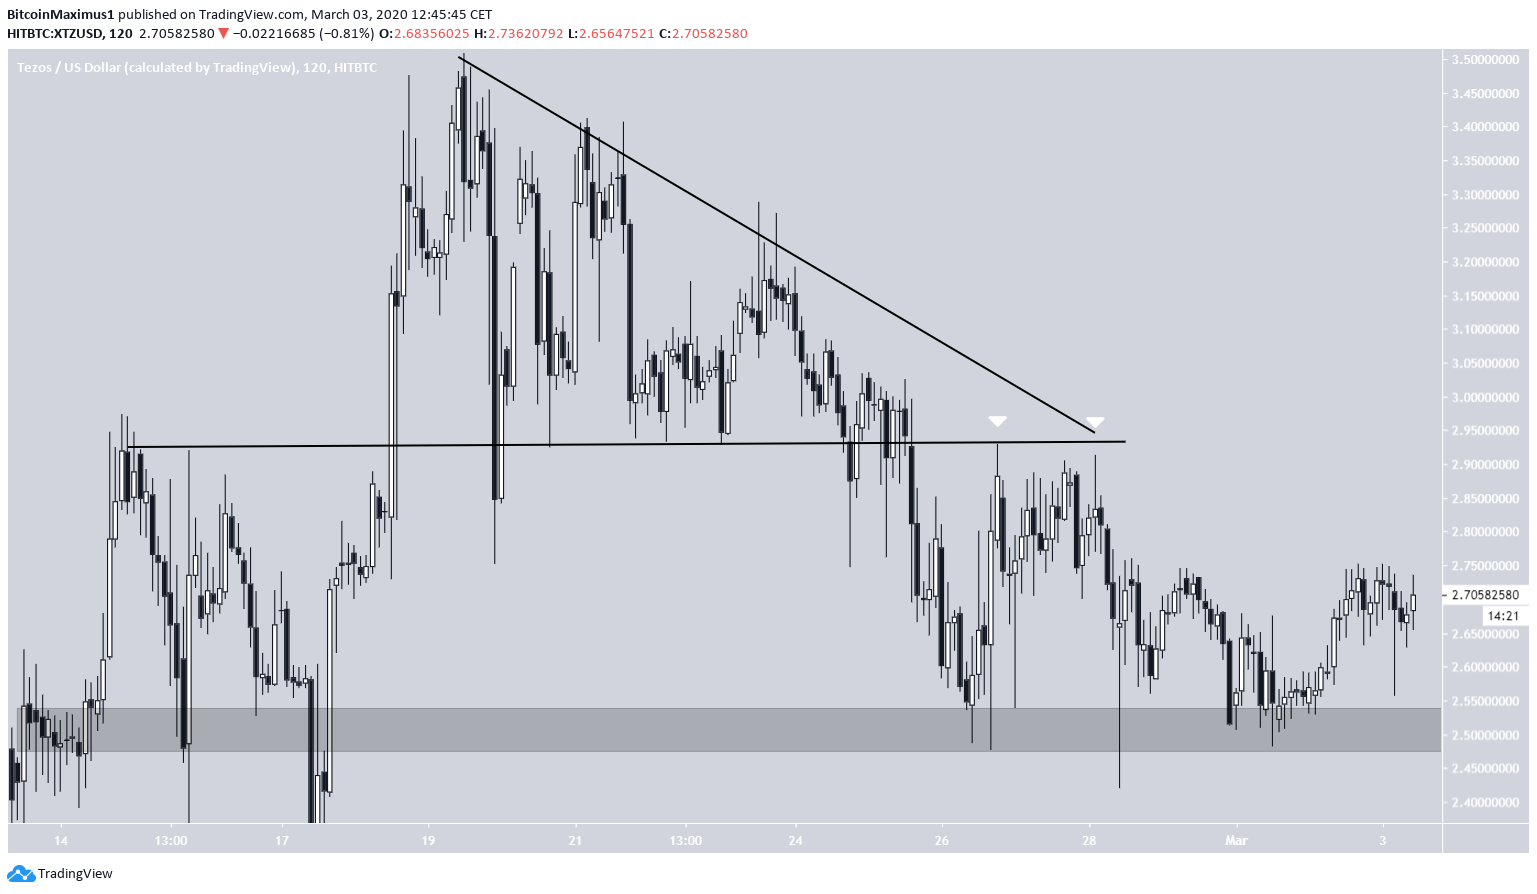
Triangle Breakdown
On Feb. 25, the XTZ price broke down from a descending triangle. This movement was correctly predicted in our previous analysis.
But, the decrease was relatively short-lived. Afterward, the price increased in order to validate the previous support line as resistance and did so in the form of two long upper wicks.
Since then, it has revisited the $2.5 level several times, confirming it as a support area for the future.
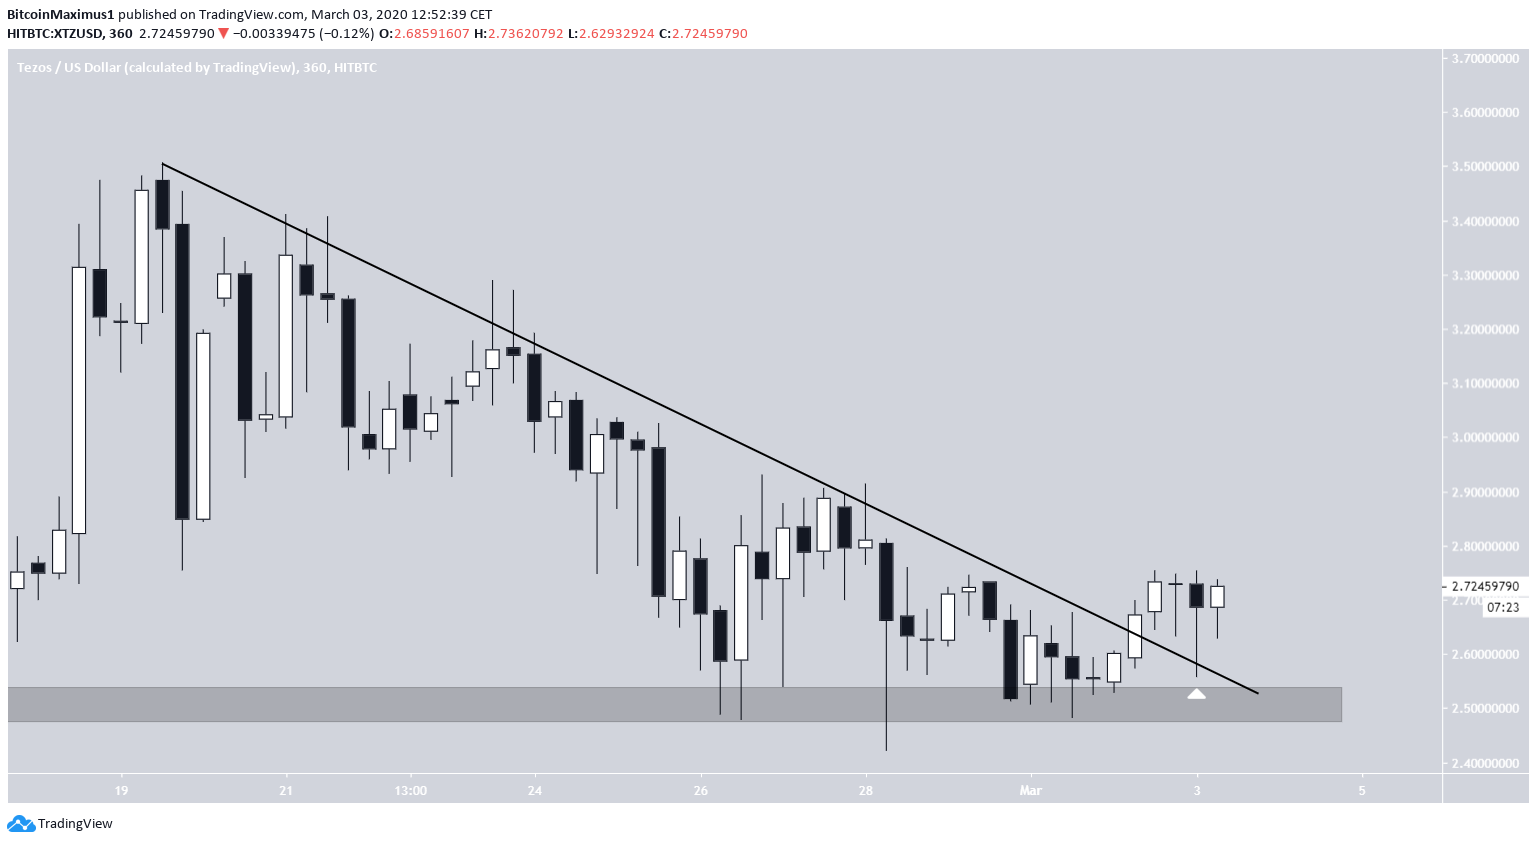
Zooming out slightly, we can see that the price has just broken out above a descending resistance line.
Afterward, it validated it as support with a hammer candlestick, characterized by a long lower wick. This is a customary movement after a breakout, and the fact that the price validated it with a bullish candlestick makes it even more so.
The most likely movement after this would be an upward move toward the previous highs.
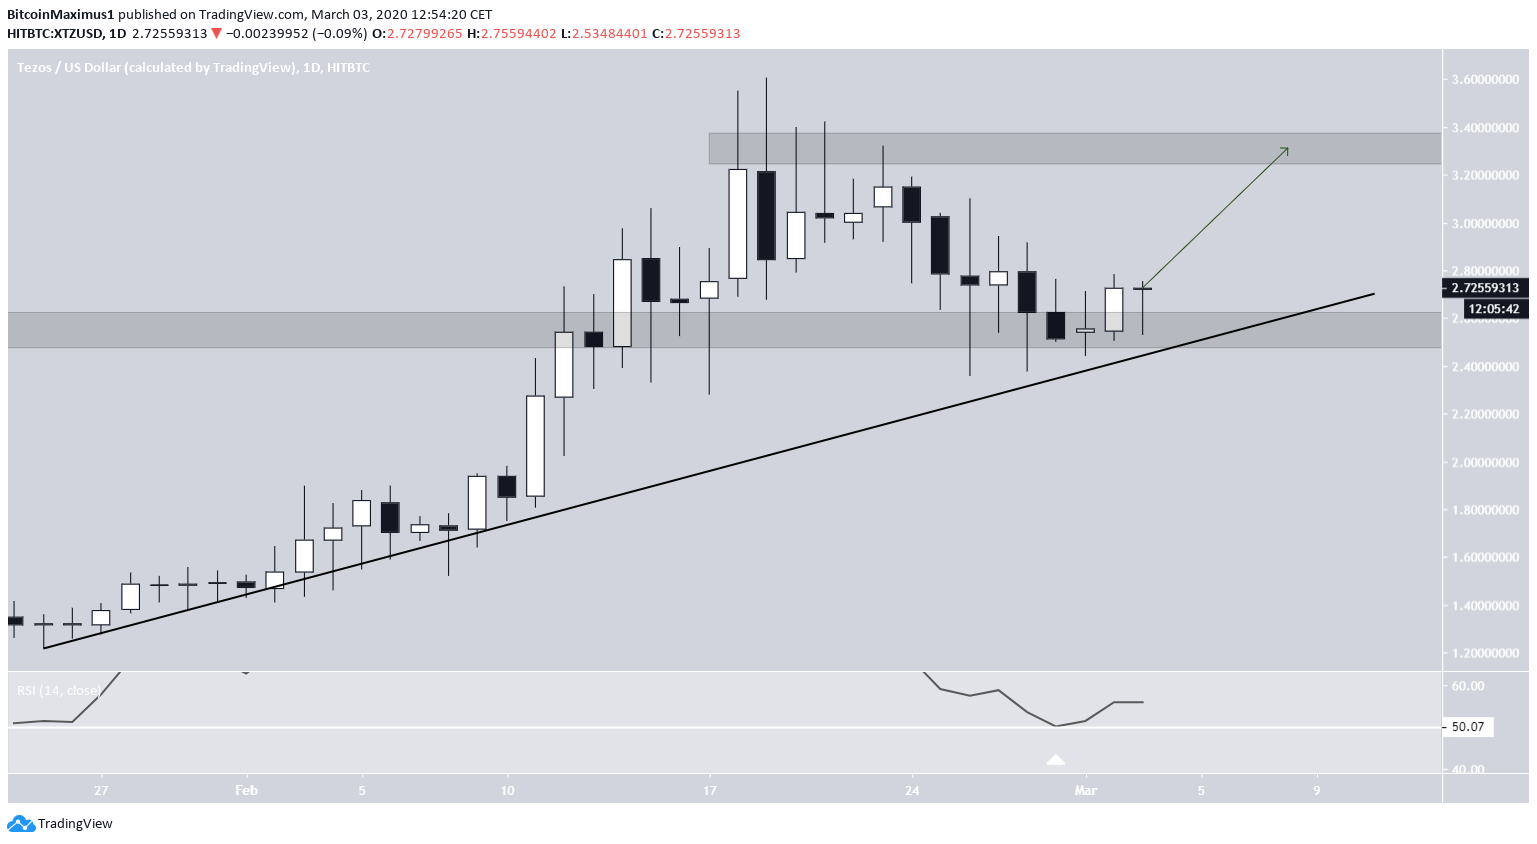
Future Movement
The daily chart supports the hypothesis laid out from the lower time-frames. The XTZ price has been following an ascending support line since Jan. 25.
The recent decrease caused a validation of a confluence of the $2.5 support area and the ascending support line. It would be expected that the price continue moving upward toward the next resistance area at $3.3, since it also aligns with the lower time-frame view.
Another bullish indication is given by the RSI, which has bounced right at the 50-line. This means that the price has staved off a downward trend and will move upward.
On March 3, the XTZ price broke out from a descending resistance line. We expected the upward movement to continue and the price to reach the closest resistance area at $3.4.


