


On Feb 9, the XTZ price broke out above an important resistance area found at $1.70. Since then, it has increased by almost 80%.
Tezos (XTZ) Price Highlights
- There is support at $2.50 and $1.70.
- There is resistance at $5.05-$6.00.
- The price is following an ascending support line.
- The medium-term RSI is bearish.
Full-time trader @CryptoMichNL outlined an XTZ price chart which shows strong support at $2 and $3, while the main resistance area is found between $6-7. He stated the aforementioned support areas are considered potential long zones, with a target at the resistance area.
Hit the $4 target area here and starts to consolidate.
Potential long zones for me are $3 and $2.50.
Breakout above $4 and I'm aiming for $6 / $7. pic.twitter.com/4S4Tujlb7J
— Michaël van de Poppe (@CryptoMichNL) February 24, 2020
*For XTZ/BTC, BeInCrypto previously predicted the creation of a new all-time high. Since XTZ is in the price discovery phase for its BTC pair, this article will only focus on the USD pair. For the full XTZ/BTC analysis, click here.
Important Areas
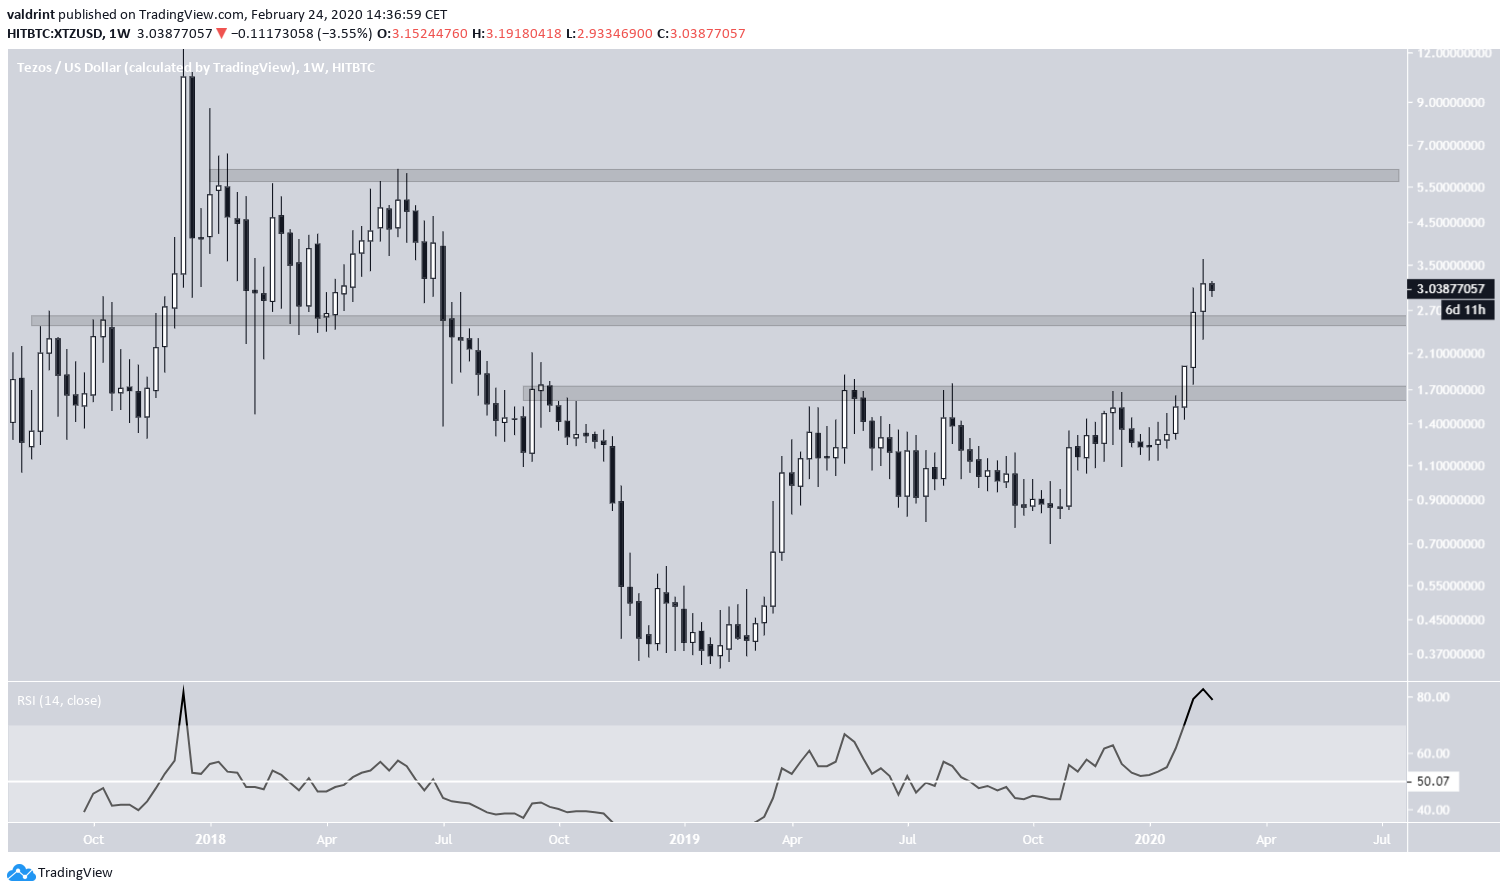
The main resistance area was initially found at $1.70, but the price broke out in February 2020. There are not that many significant areas near the current price. The closest support is found at $2.50 while the main resistance area can be found between $5.50 and $6.00.
While the weekly RSI is deep into overbought territory, it has not generated any trace of bearish divergence, so it is possible that the current move will continue.
Possible Decrease
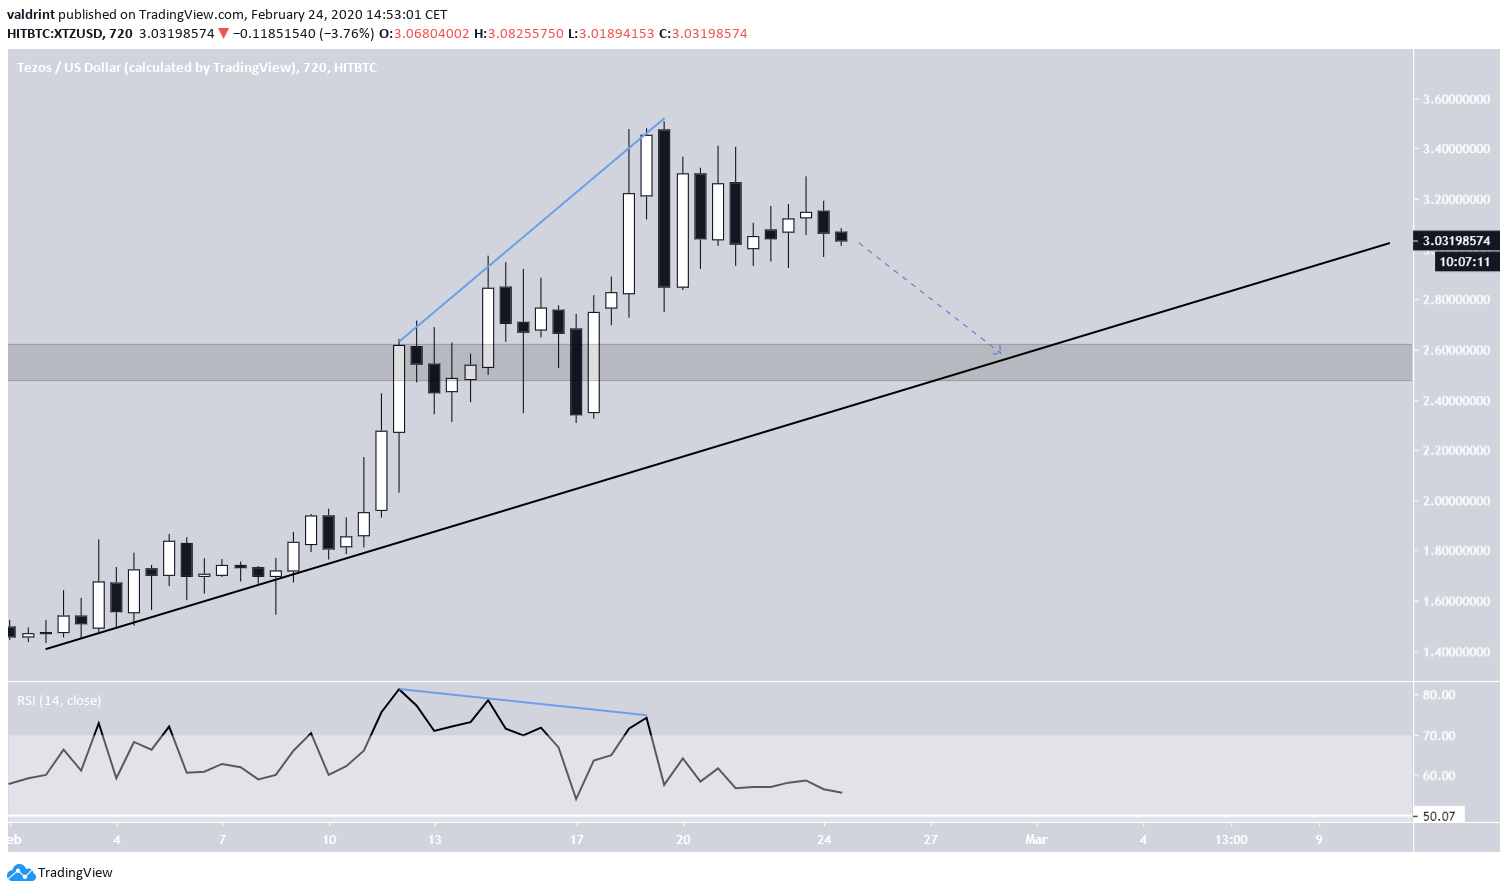
The XTZ price has been following an ascending support line since Feb 9, right around the time it broke out above the main resistance area of $1.70.
However, the price is considerably above this line now, and unable to use it as support. Furthermore, the 12-hour RSI has generated a considerable bearish divergence. It would not be surprising if the price were to decrease and validate the confluence of the ascending support line and support area.
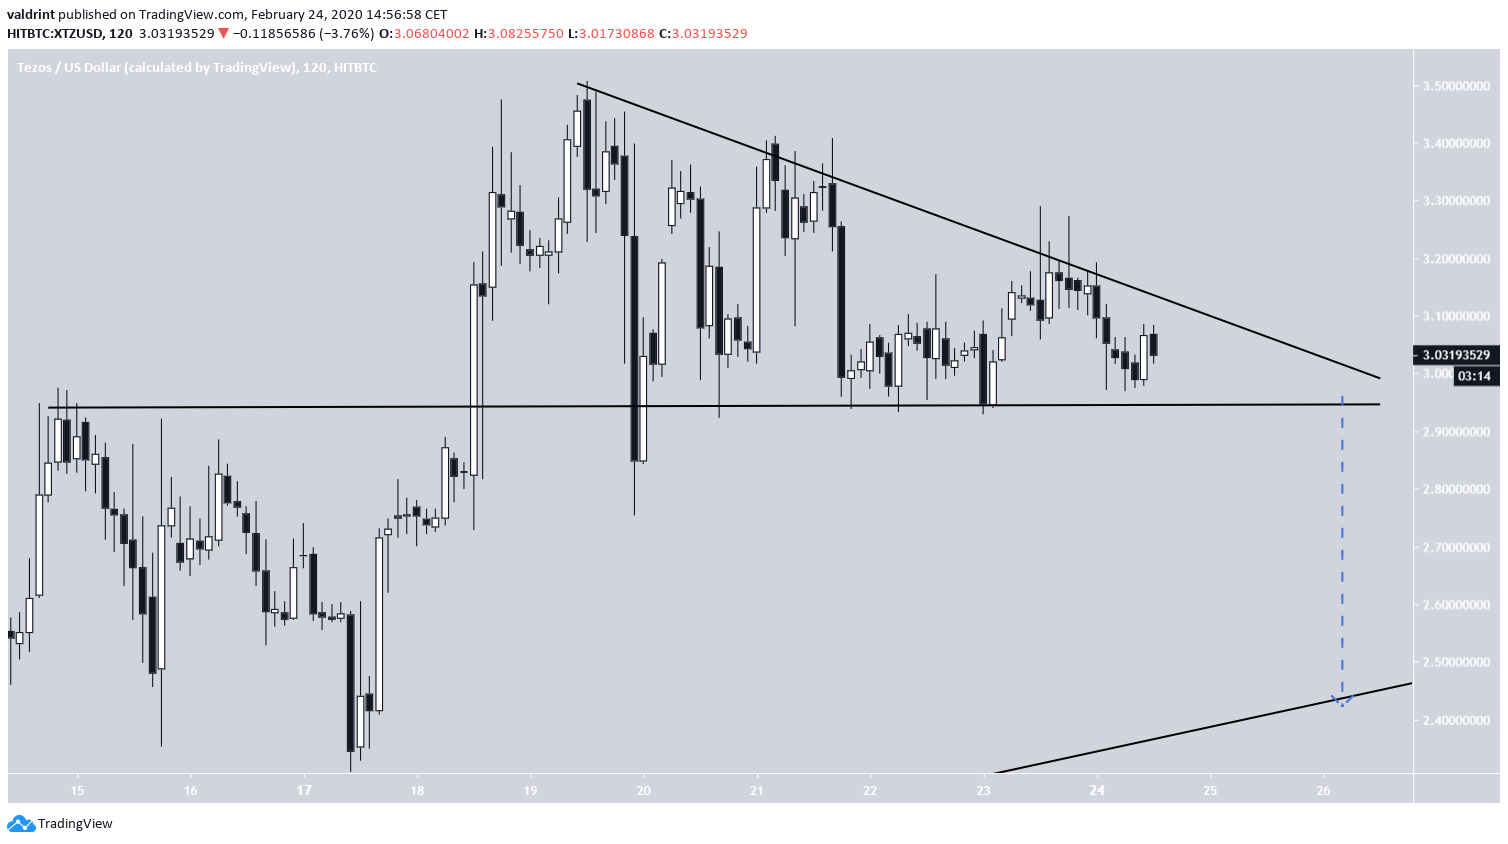
This possibility is also supported by the creation of a descending triangle in the short-term. The price is approaching the end of this pattern, so a rapid move in one direction is bound to occur soon.
Since the descending triangle is considered a bearish pattern and the longer-term analysis predicts a decrease, a breakdown towards the support line is expected.
If we project the entire height of the pattern to the expected breakdown level, it gives us a target of $2.50, right above the ascending and horizontal supports.
To conclude, the XTZ price has increased considerably since the beginning of February. However, the price looks due for a correction. A target for the possible breakdown is given at $2.50.


