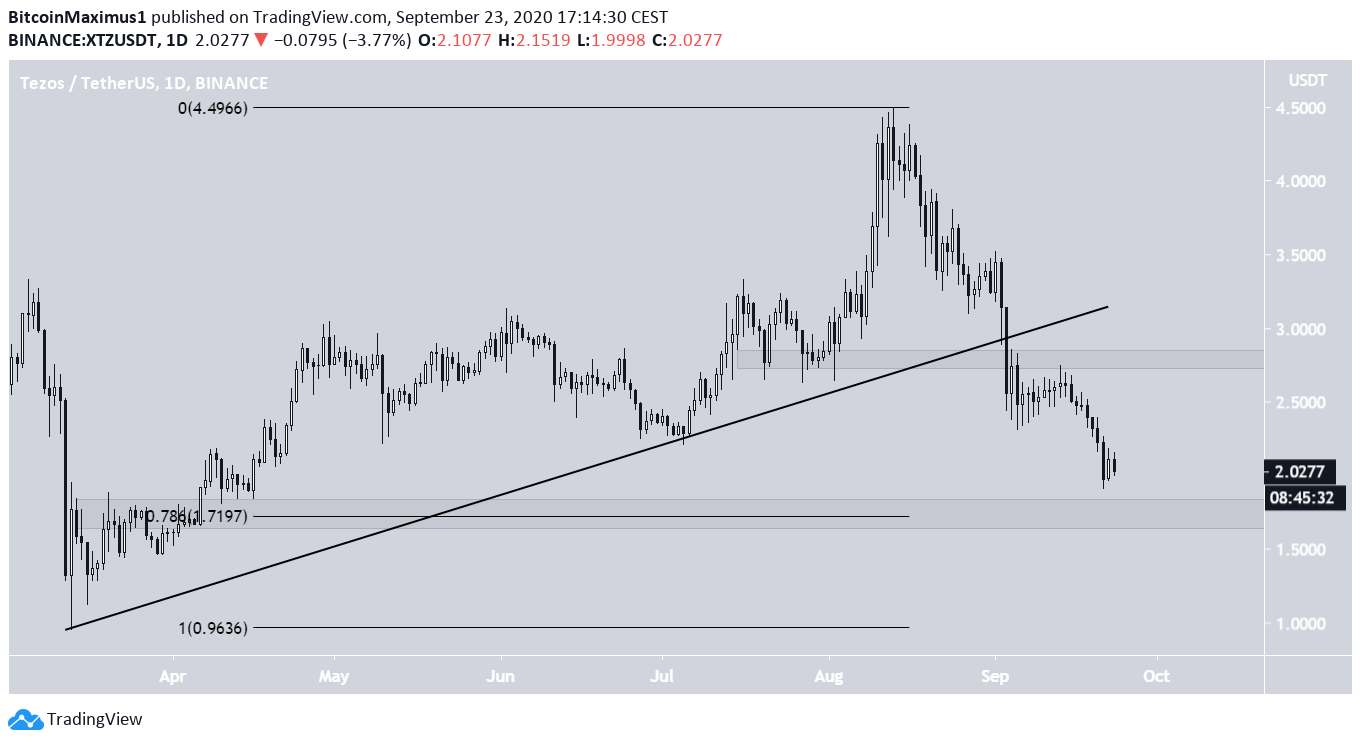
The Tezos (XTZ) price has been decreasing rapidly since Aug. 13 and has broken down from several crucial support levels. Unless the price is successful in reclaiming them, the trend is considered bearish.
Breakdown From Long-Term Support
The XTZ price has been decreasing since a high of $4.49 was reached on Aug. 13. The decrease has been swift, and on Sept. 4, the price broke down from to major support levels:
- An ascending support line in place since the March 13 lows
- The $2.80 support area
Afterwards, the price validated the area as resistance and continued its descent. The price is approaching the $1.70 area, which is the 0.786 Fib level of the entire upward move and is expected to act as support.
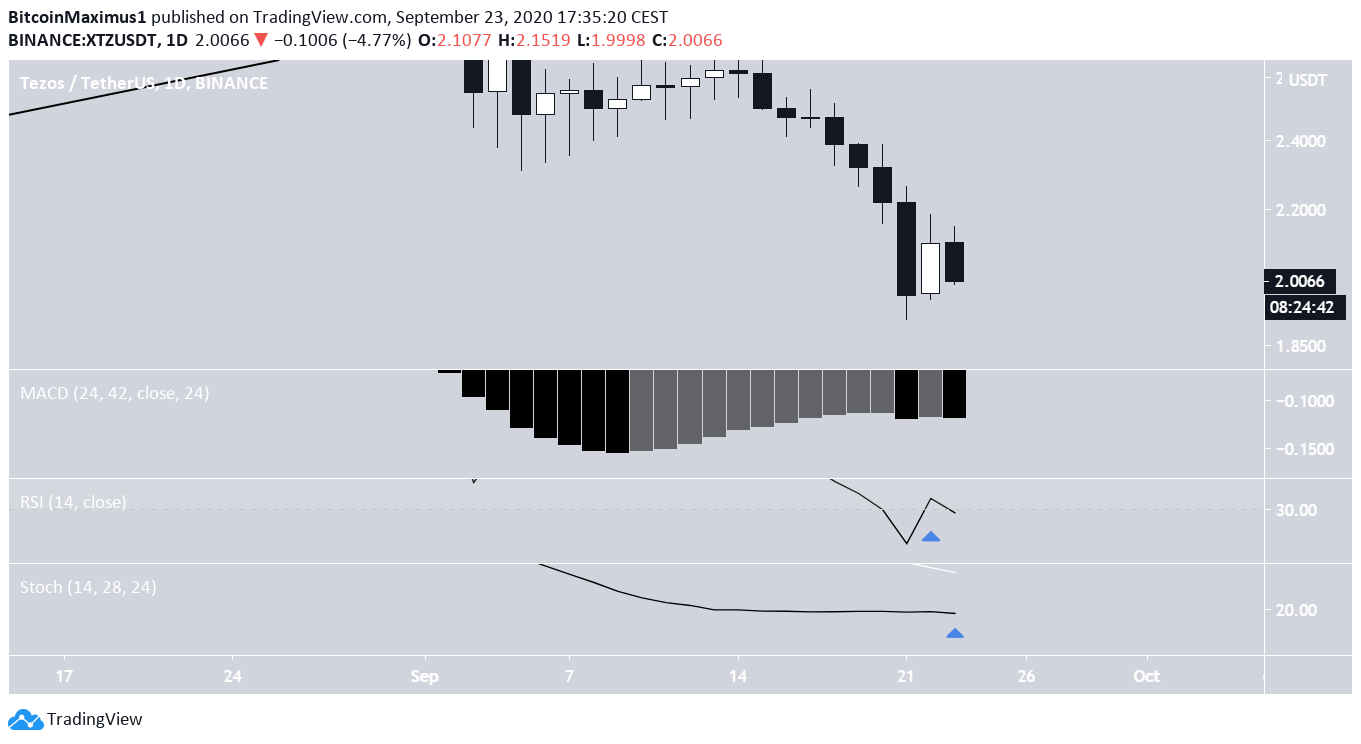
Technical indicators show extremely oversold conditions, but do not yet confirm that a reversal has begun. While there is a developing bullish divergence in the MACD, it has begun to fall once more prior to reaching positive territory.
The RSI reached its lowest levels since the March crash, but has not generated any bullish divergence yet. Similarly, the Stochastic Oscillator has yet to make a bullish cross.
All these are signs that the price is expected to decrease all the way to the $1.70 support area, before possibly beginning an upward move.
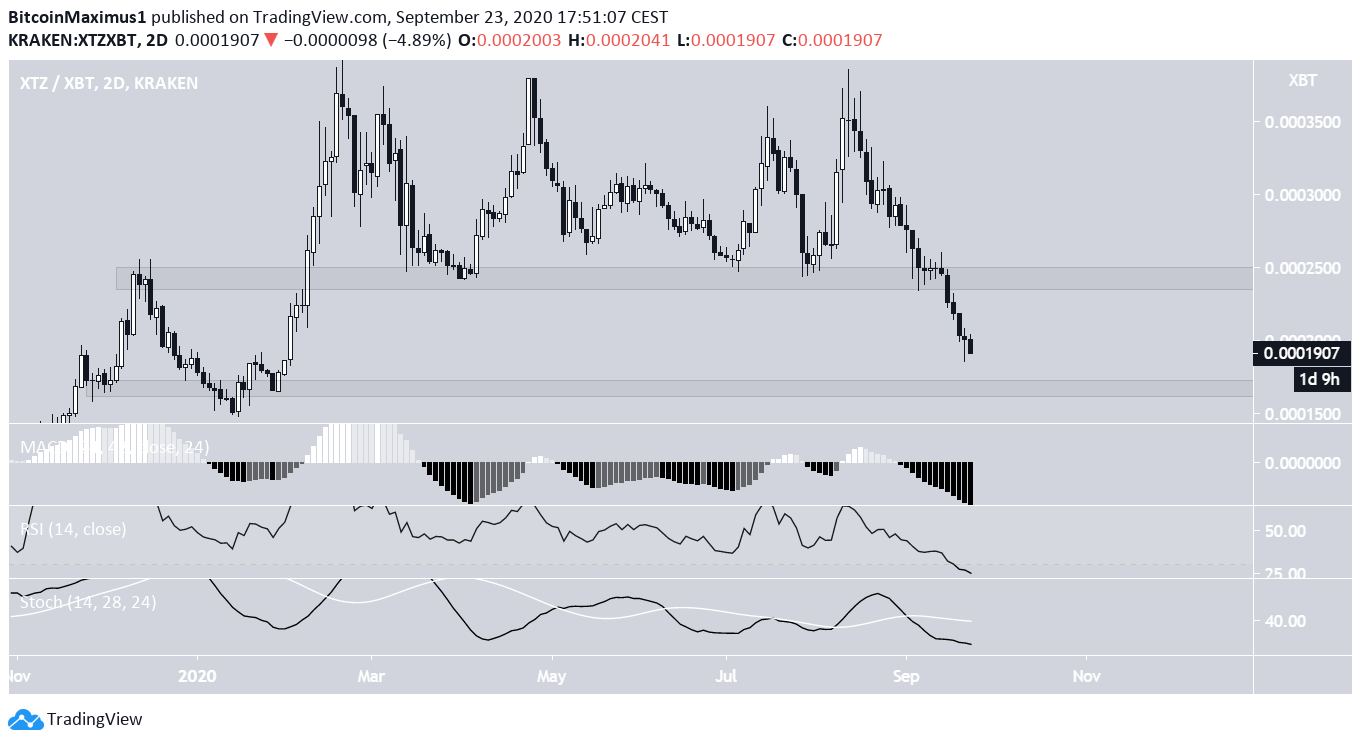
XTZ/BTC
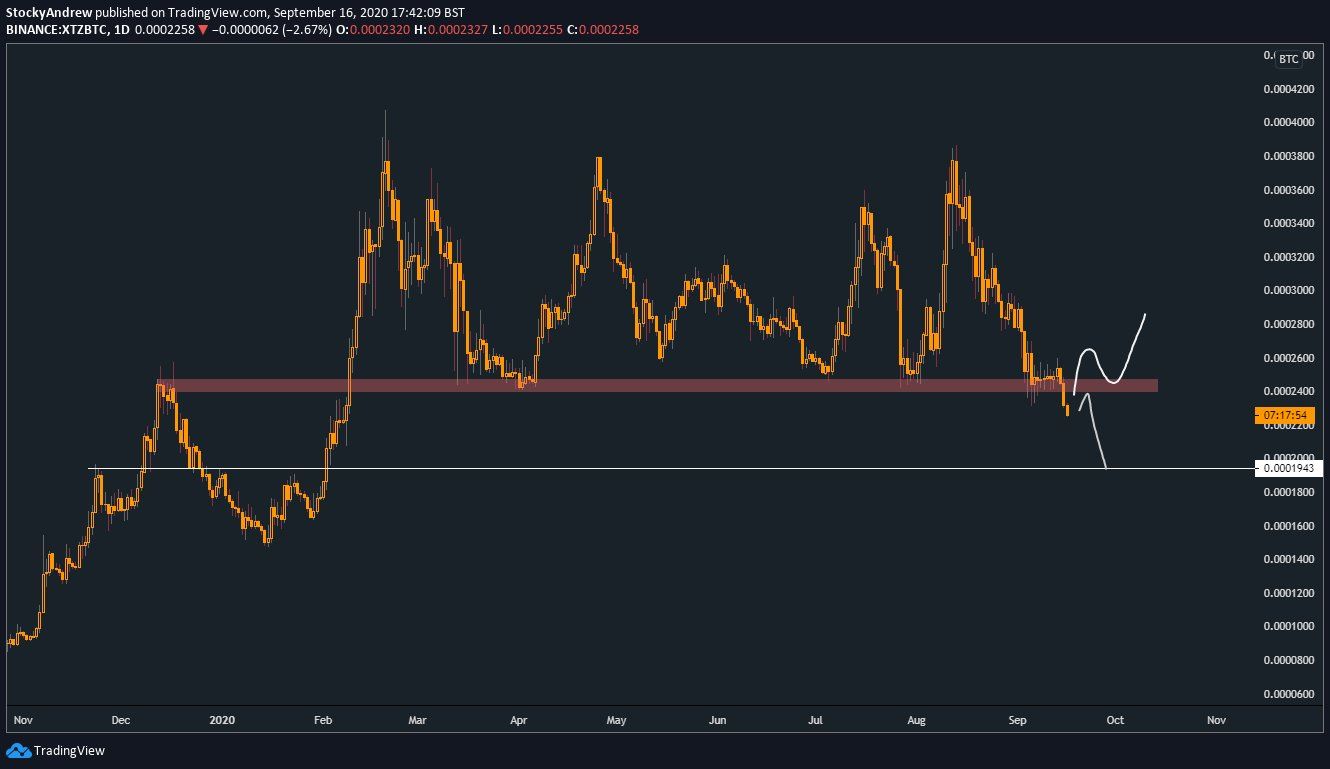
Cryptocurrency trader @ACXtrades outlined an XTZ chart, which shows that the price has broken down from an important support area at 24,500 satoshis. While a reclaim of the area is possible, he states that a validation of the area as resistance followed by a decrease is more likely.
Since the tweet, the price has continued its descent. The XTZ/BTC chart looks considerably more bearish than its XTZ/USD counterpart.
Besides falling below the 24,500 satoshi support area, which had been in place for eight months, the price has continued its descent without even validating it as resistance. Furthermore, technical indicators show no signs of a reversal.
If the price continues falling, the closest support area is found at 16,500 satoshis.