


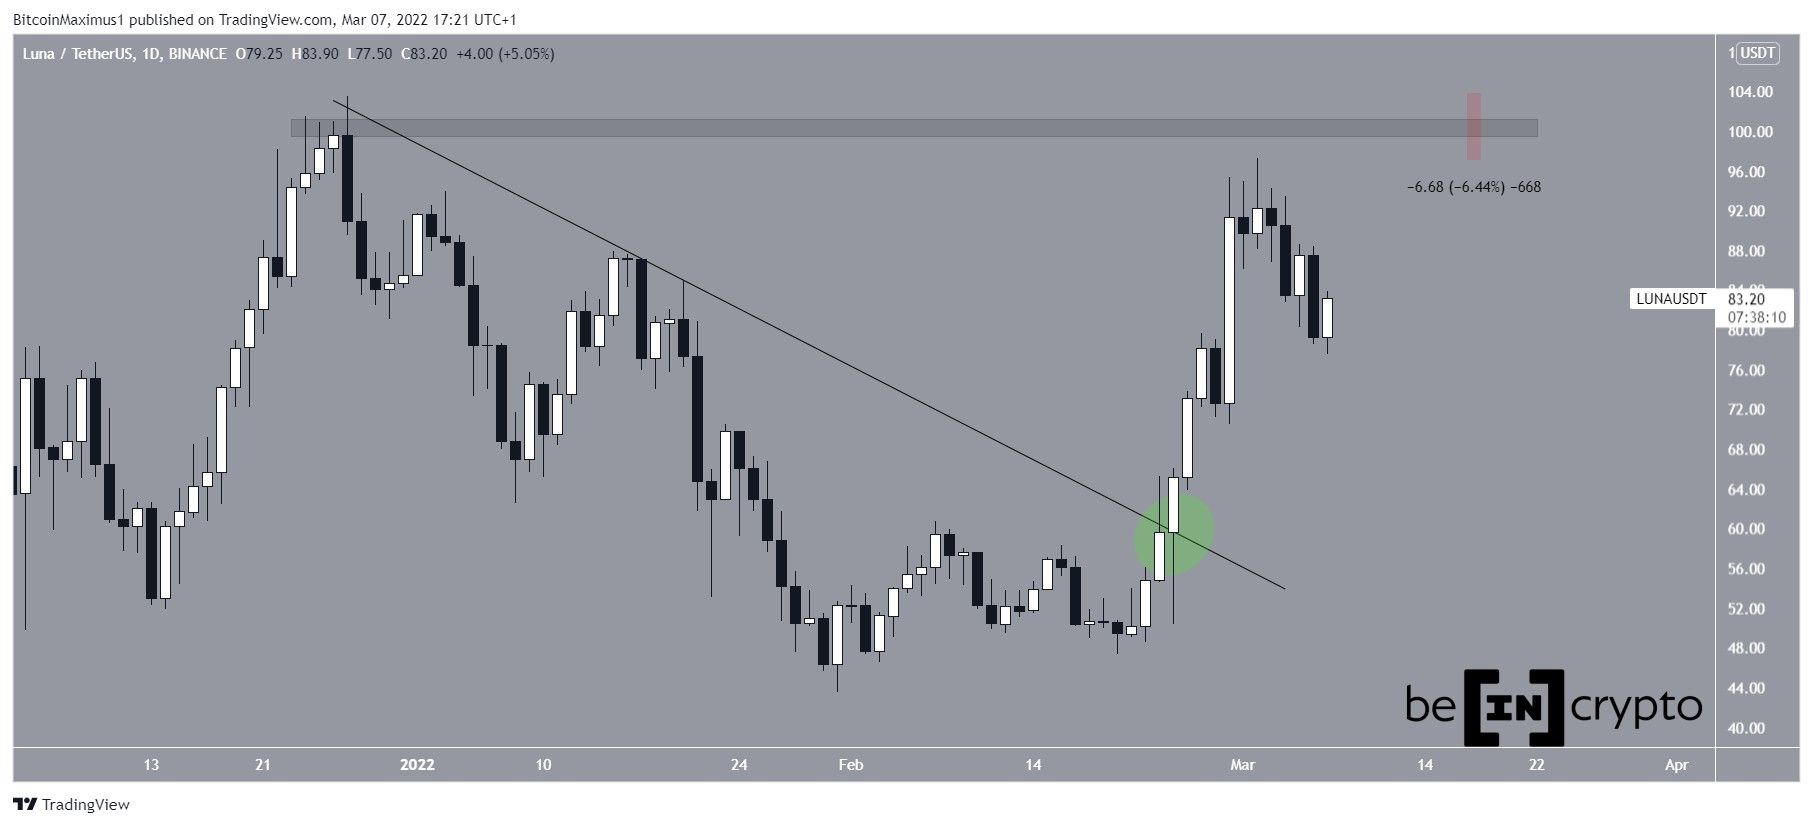
Terra (LUNA) has been falling since it barely failed to reach a new all-time high price on March 2. However, it is possible that it will make another attempt in the near future.
LUNA has been decreasing alongside a descending resistance line since reaching an all-time high price $103.60 on Dec 27. The downward movement led to a low of $43.44 on Jan 31.
The price has been moving upwards since, and broke out from the descending resistance line on Feb 24 (green circle). The upward movement has been swift, and LUNA did not even return to validate the line as support.
The increase led to a high of $97.29 on March 2. This was only 6.45% below the aforementioned all-time high price.
However, LUNA has decreased slightly since then.
Future LUNA movement
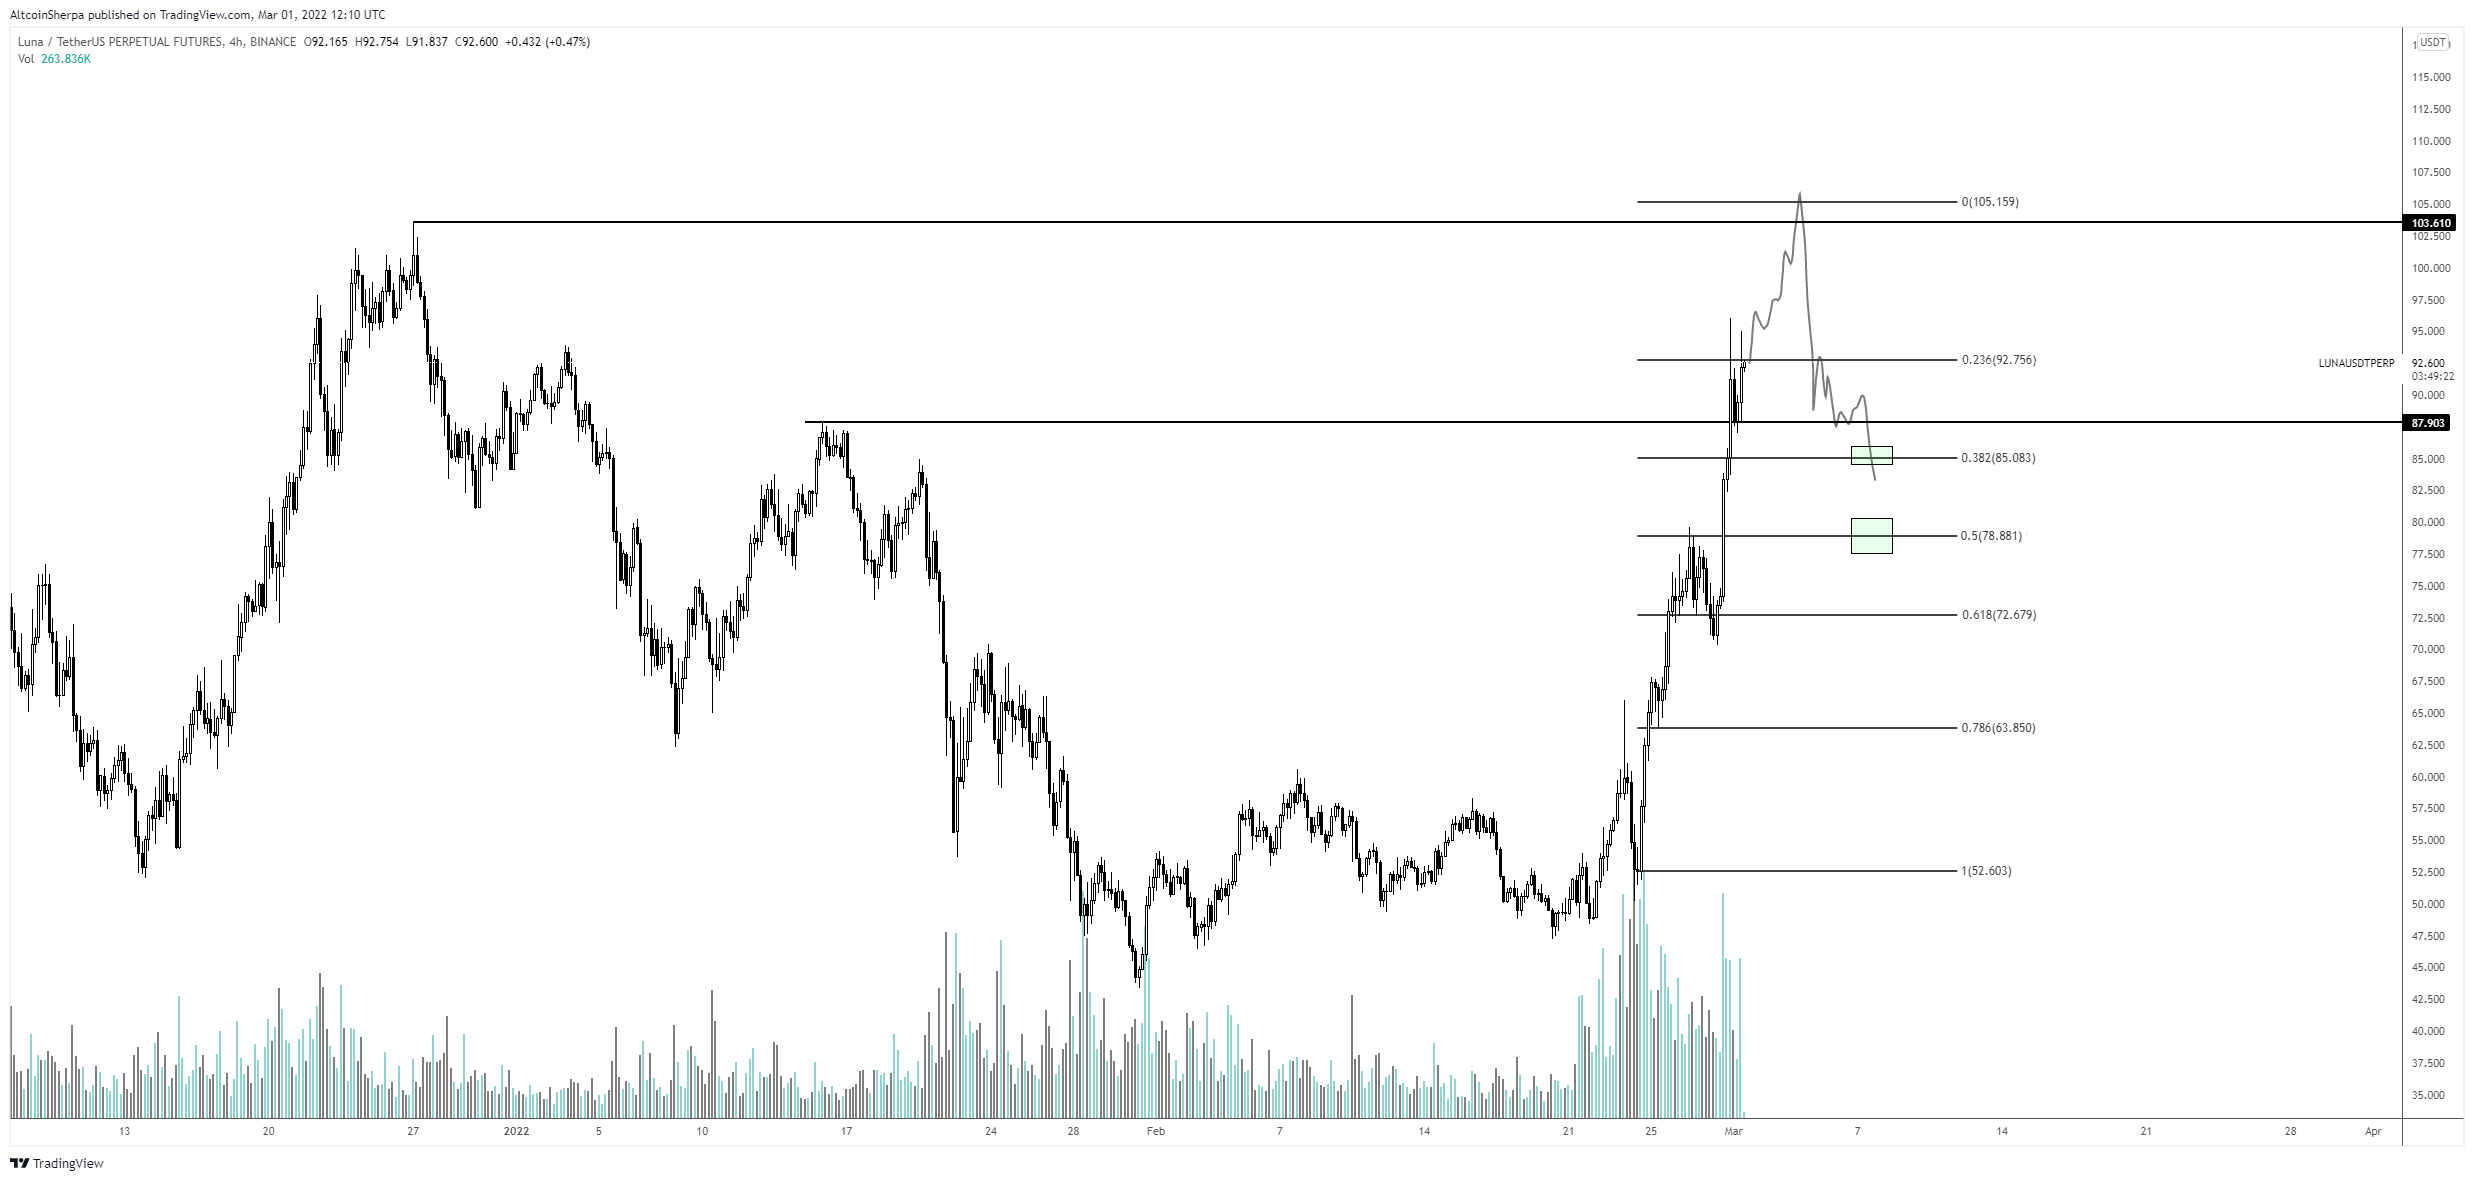
Cryptocurrency trader @AltcoinSherpa tweeted a chart of LUNA, stating that it is possible that the price will reach a new all-time high before falling.
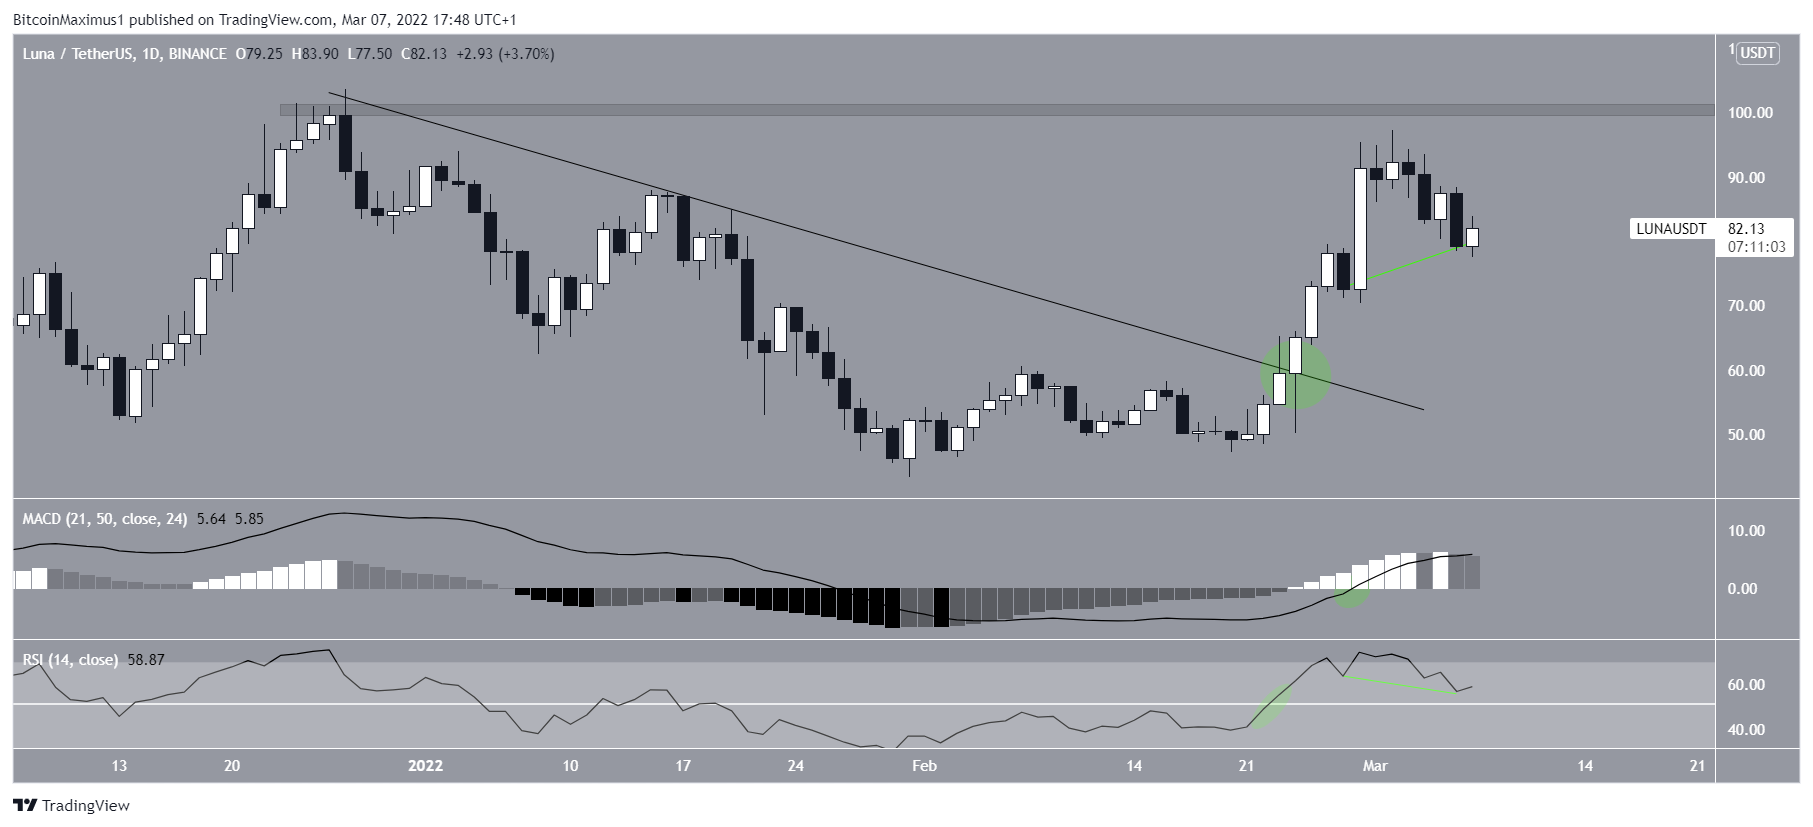
After the breakout, both the MACD and RSI crossed into bullish territory (green circles). In the case of the MACD, this meant a movement above 0, while in the case of the RSI, it meant a movement above 50.
In addition to this, the RSI has now generated hidden bullish divergence. This is a strong sign of trend continuation. Since the prevailing trend is upwards, this would lead to a continuation of the upward movement for LUNA.
Wave count analysis
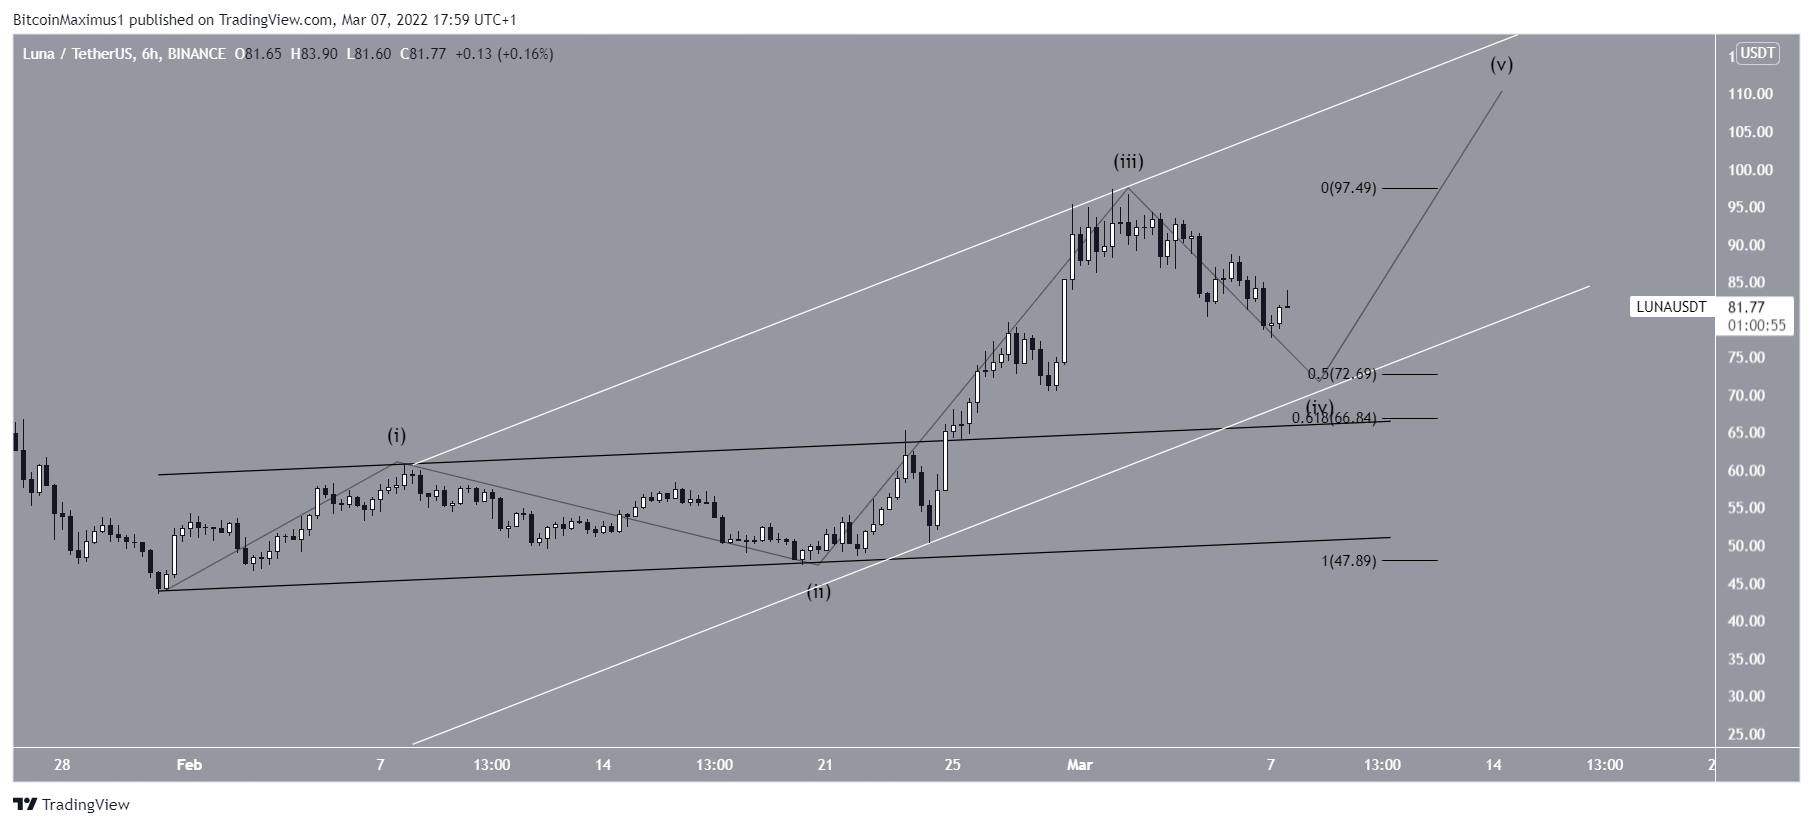
While LUNA has been increasing since Jan 31, its rate of increase accelerated on Feb 24, once it broke out from an ascending parallel channel. The shape of the increase suggests that it was wave three of a five wave upward movement.
If correct, LUNA is currently in wave four, which is corrective. It is possibly in the process of creating a fourth wave pullback, which is characterized by a sharp fall, a validation of the previous channel and the resumption of the upward movement.
If so, the area most likely to act as the bottom would be at either $66 or $72. These are the 0.5 and 0.618 Fib retracement support level and both coincide with the support lines of an ascending parallel channel.
For BeInCrypto’s latest Bitcoin (BTC) analysis, click here


