
Swipe (SXP) has been accumulating near the $1.68 horizontal support are since May 23.
Technical indicators are showing bullish signs that are akin to accumulation.
Bounce at horizontal support
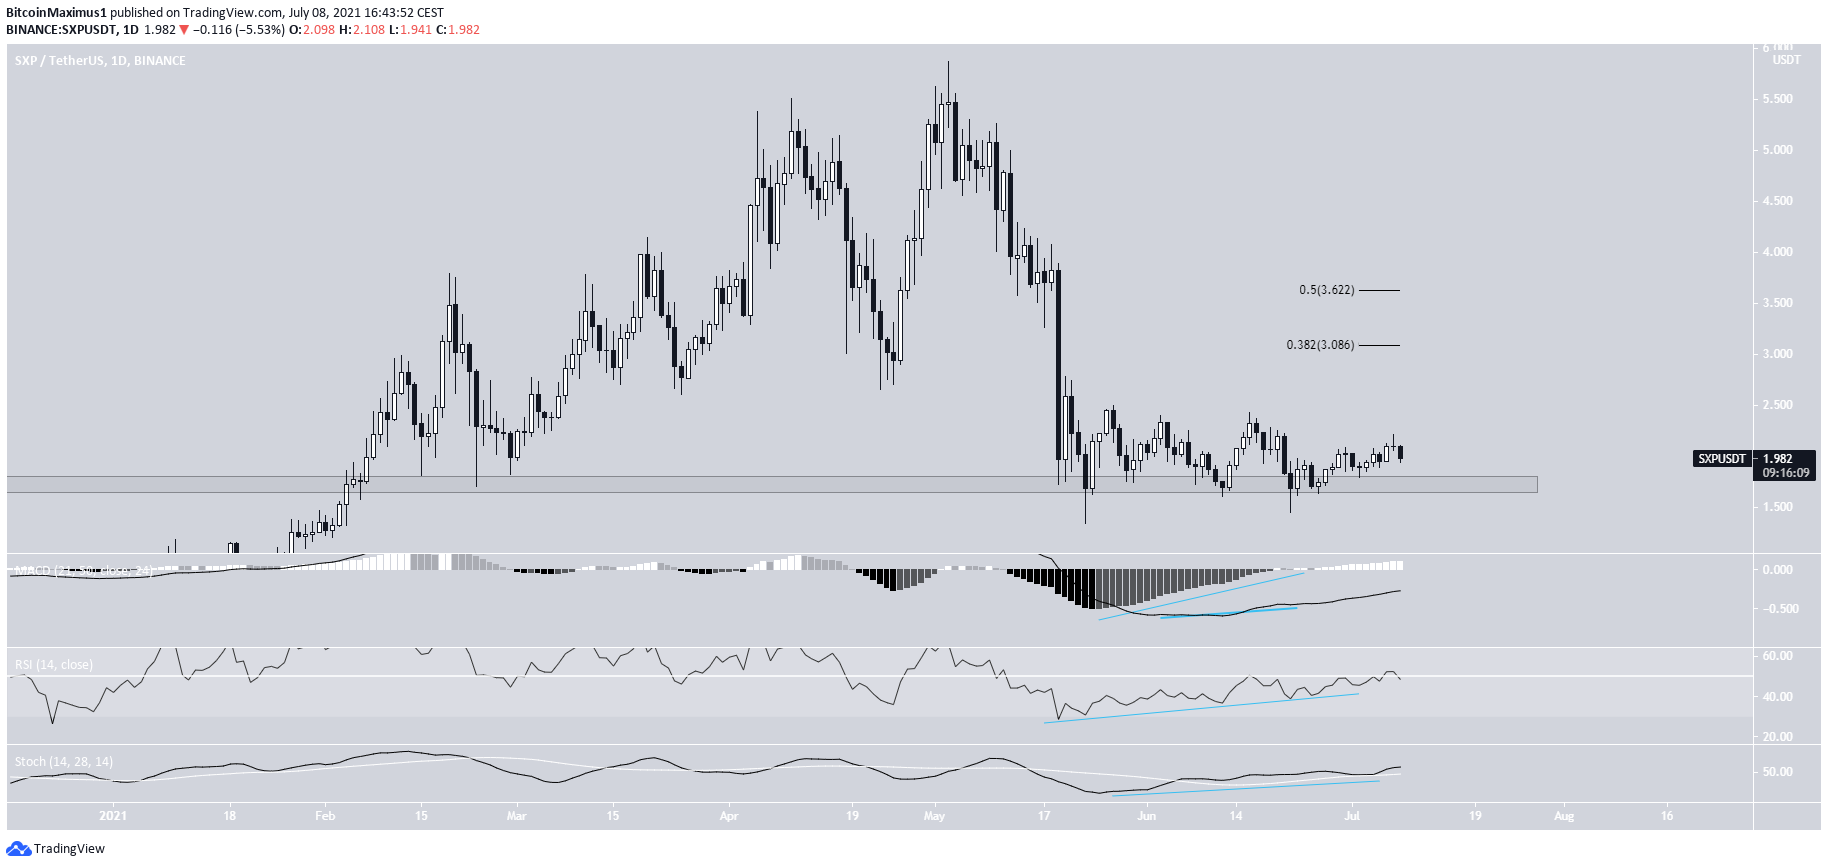
SXP has been decreasing since May 3, when it reached a high of $5.87. The downward movement continued until a low of $1.34 was reached on May 23. The token has bounced since, but is still trading close to this level.
The bounced served to validate the $1.68 area as support. The token has not closed below this level since February.
Despite the lack of a decisive upward movement, technical indicators are showing bullish signs. This is especially visible by the multiple bullish divergences in the MACD signal line, RSI & Stochastic oscillator. The latter has also made a bullish cross (green icon).
The closest resistance levels are at $3.08 and $3.62. These are the 0.382 and 0.5 Fib retracement resistance levels, respectively.
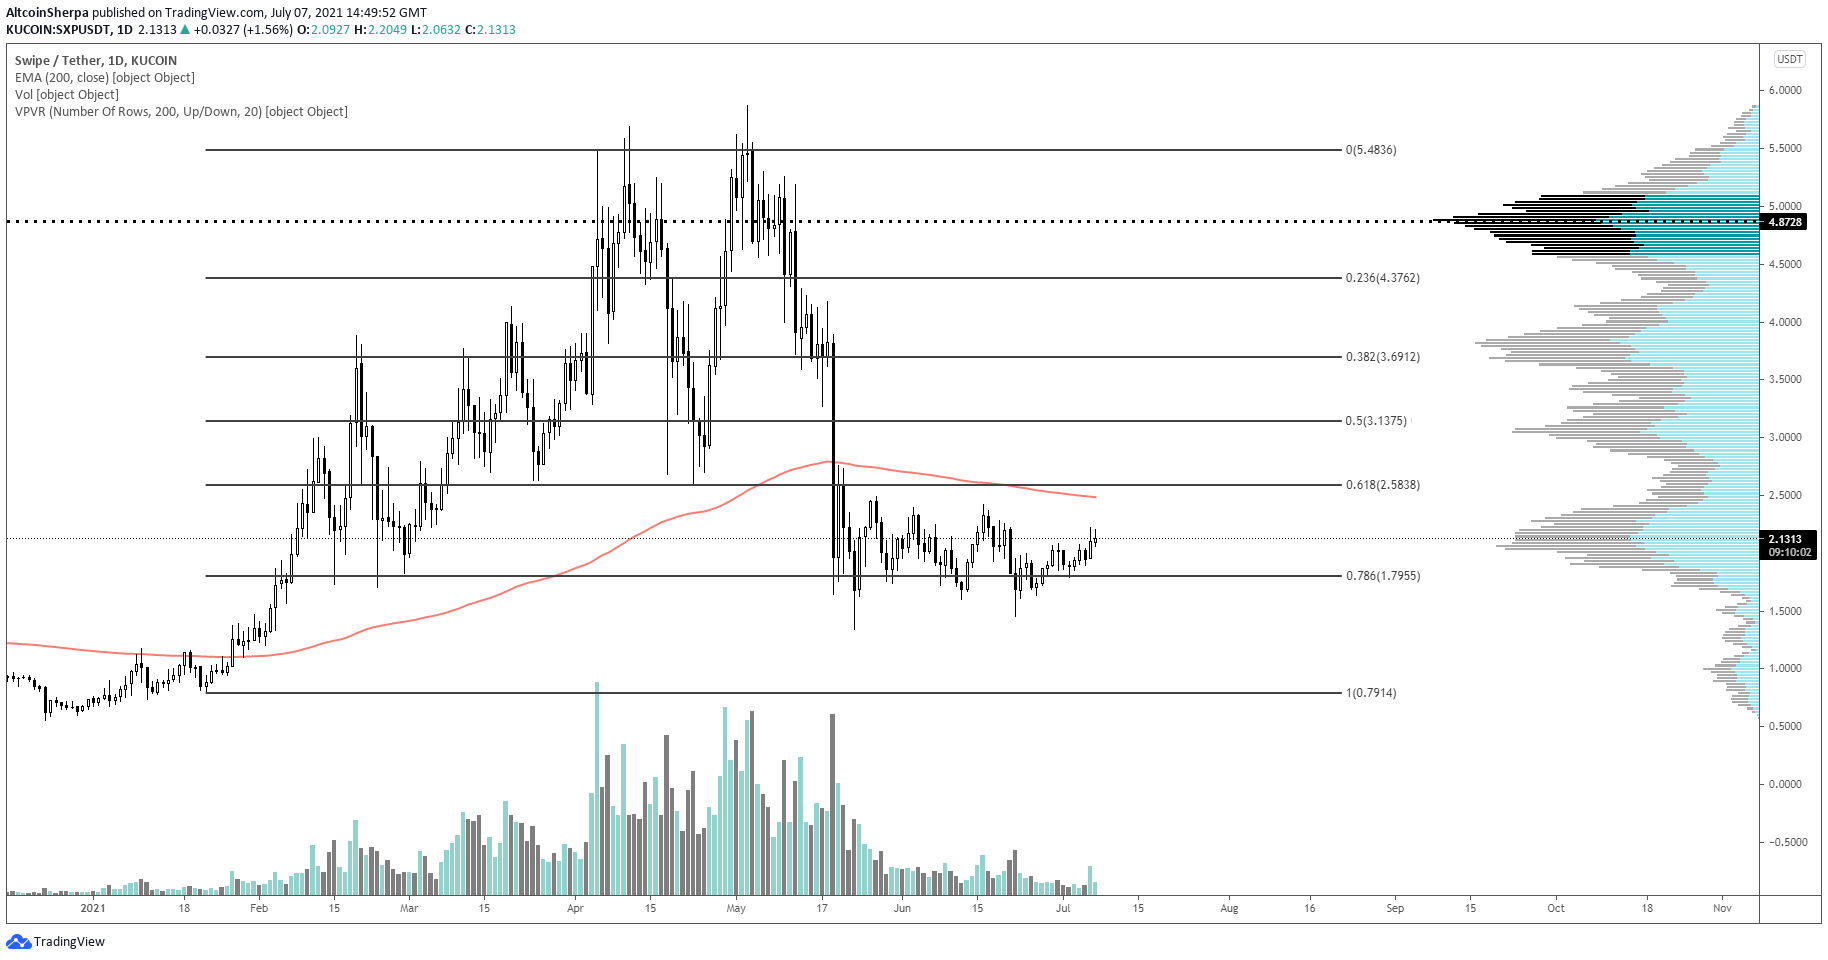
Cryptocurrency trader @Altcoinsherpa outlined a SXP chart, stating that the token seems to be accumulating. As seen above, this accumulation is occurring inside a strong horizontal support area.
Potential breakdown
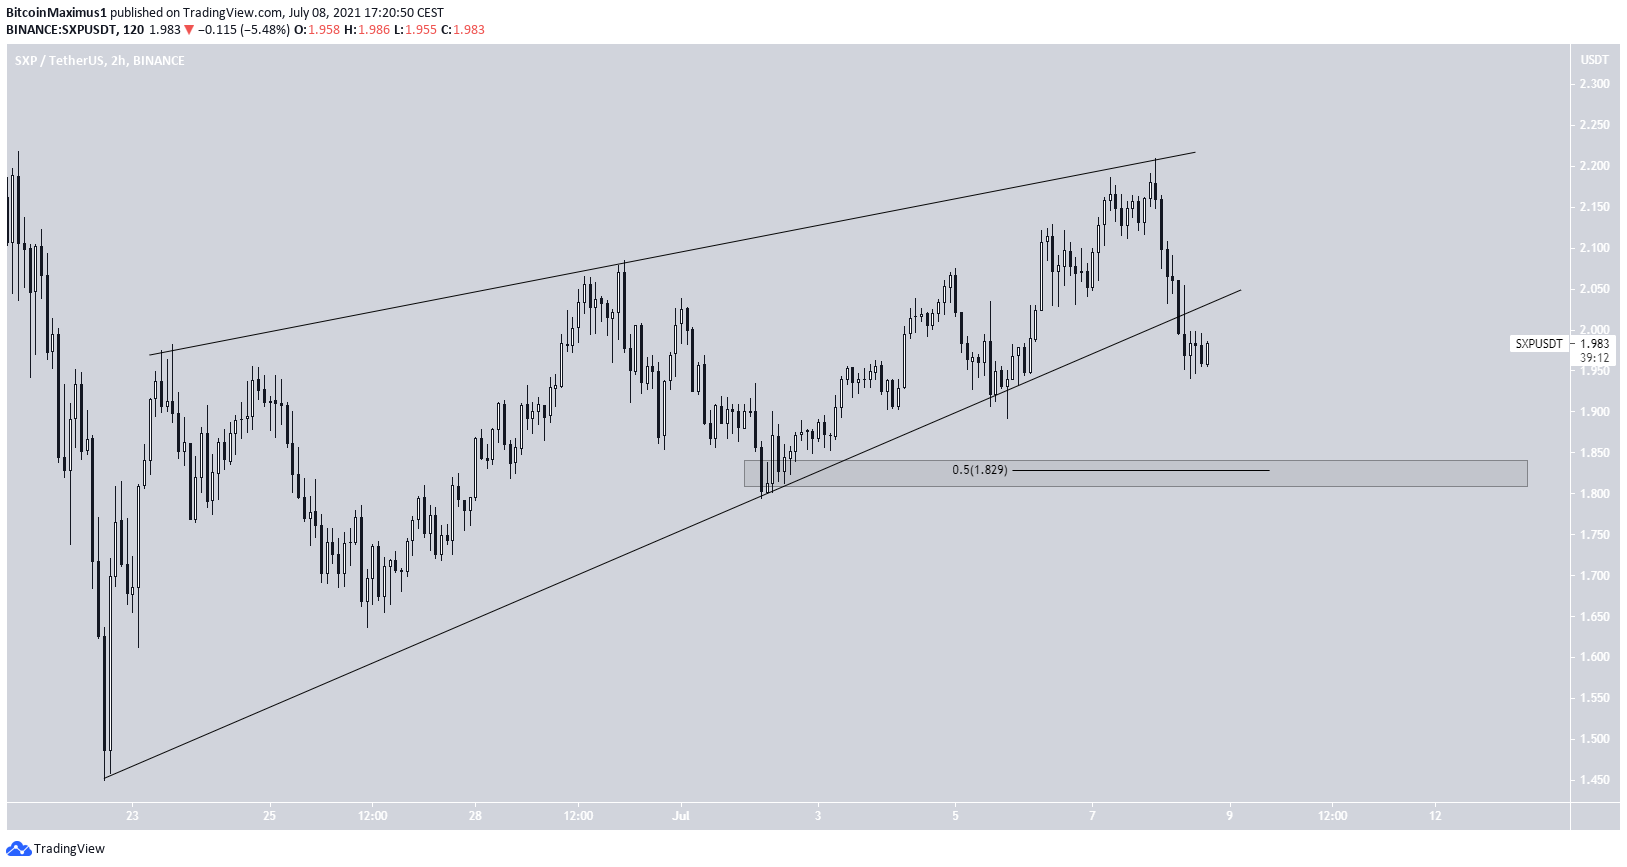
The shorter-term two-hour chart shows that the movement since the June 22 low was contained inside an ascending wedge. This is considered a bearish pattern.
After reaching a high of $2.21 on July 7, SXP initiated a downward movement and broke down from the wedge.
The closest support area is at $1.83, the 0.5 Fib retracement support level.
SXP/BTC
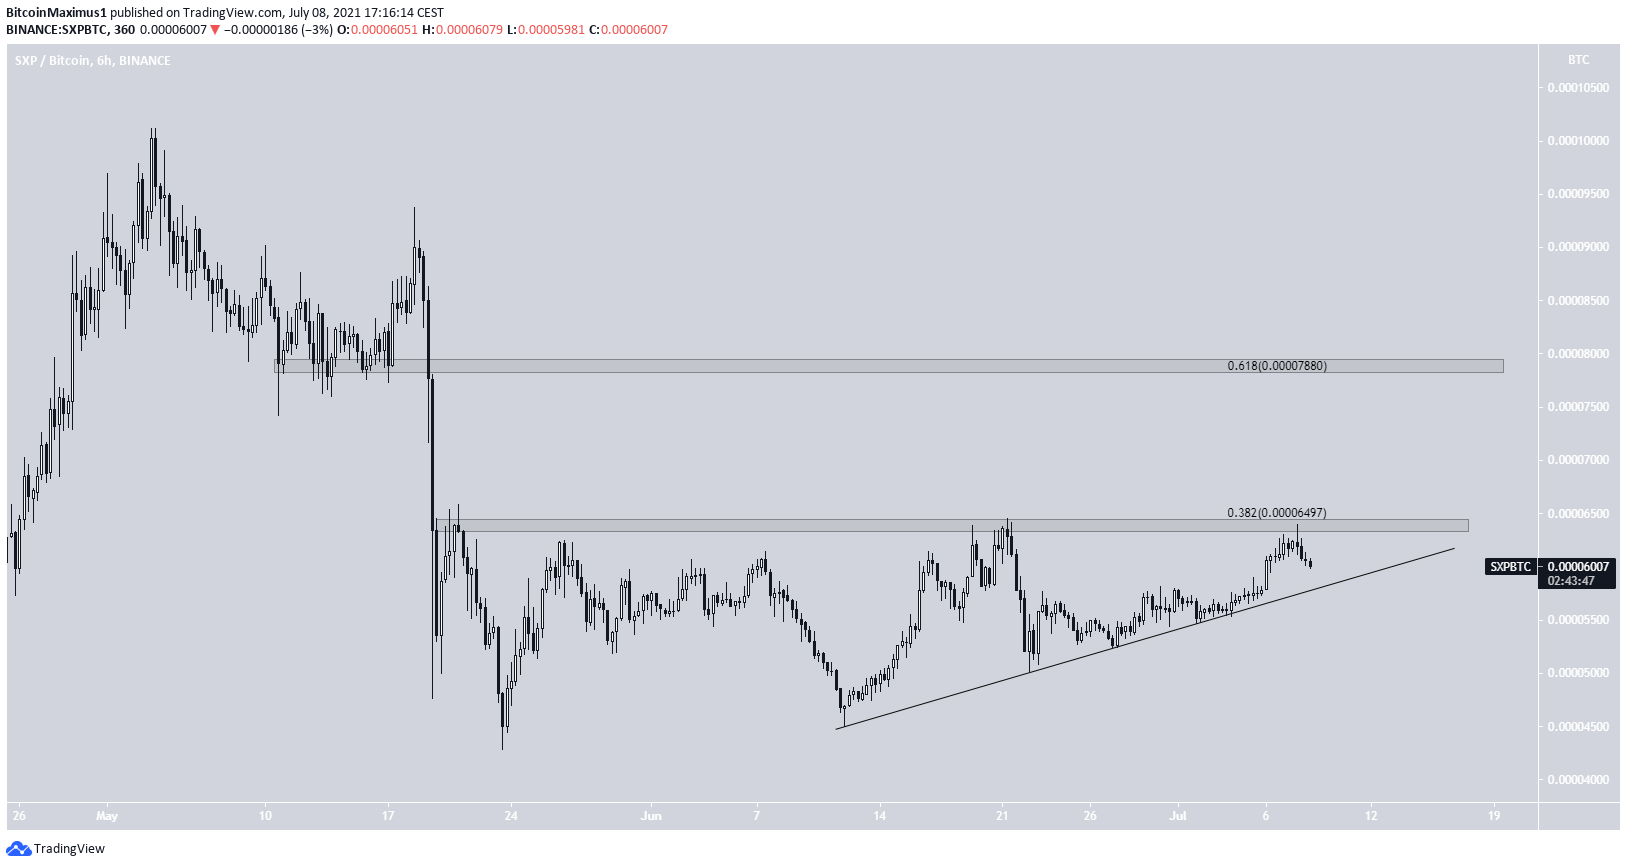
SXP/BTC has been moving upwards since May 23. On June 12, it created a higher low and resumed its upward movement.
It is potentially trading inside an ascending triangle, facing resistance from the 6400 satoshi area. This is close to the 0.382 Fib retracement resistance level.
If a breakout were to occur, the next resistance would be at 7880 satoshis, the 0.618 Fib retracement level and a horizontal resistance area.
For BeInCrypto’s latest bitcoin (BTC) analysis, click here.
