


The Swipe (SXP) price has reached the final support level before dropping towards its all-time lows.
While there are bullish signs in the short-term, indicating a potential breakout, the long-term trend remains bearish.
SXP Approaches Final Support
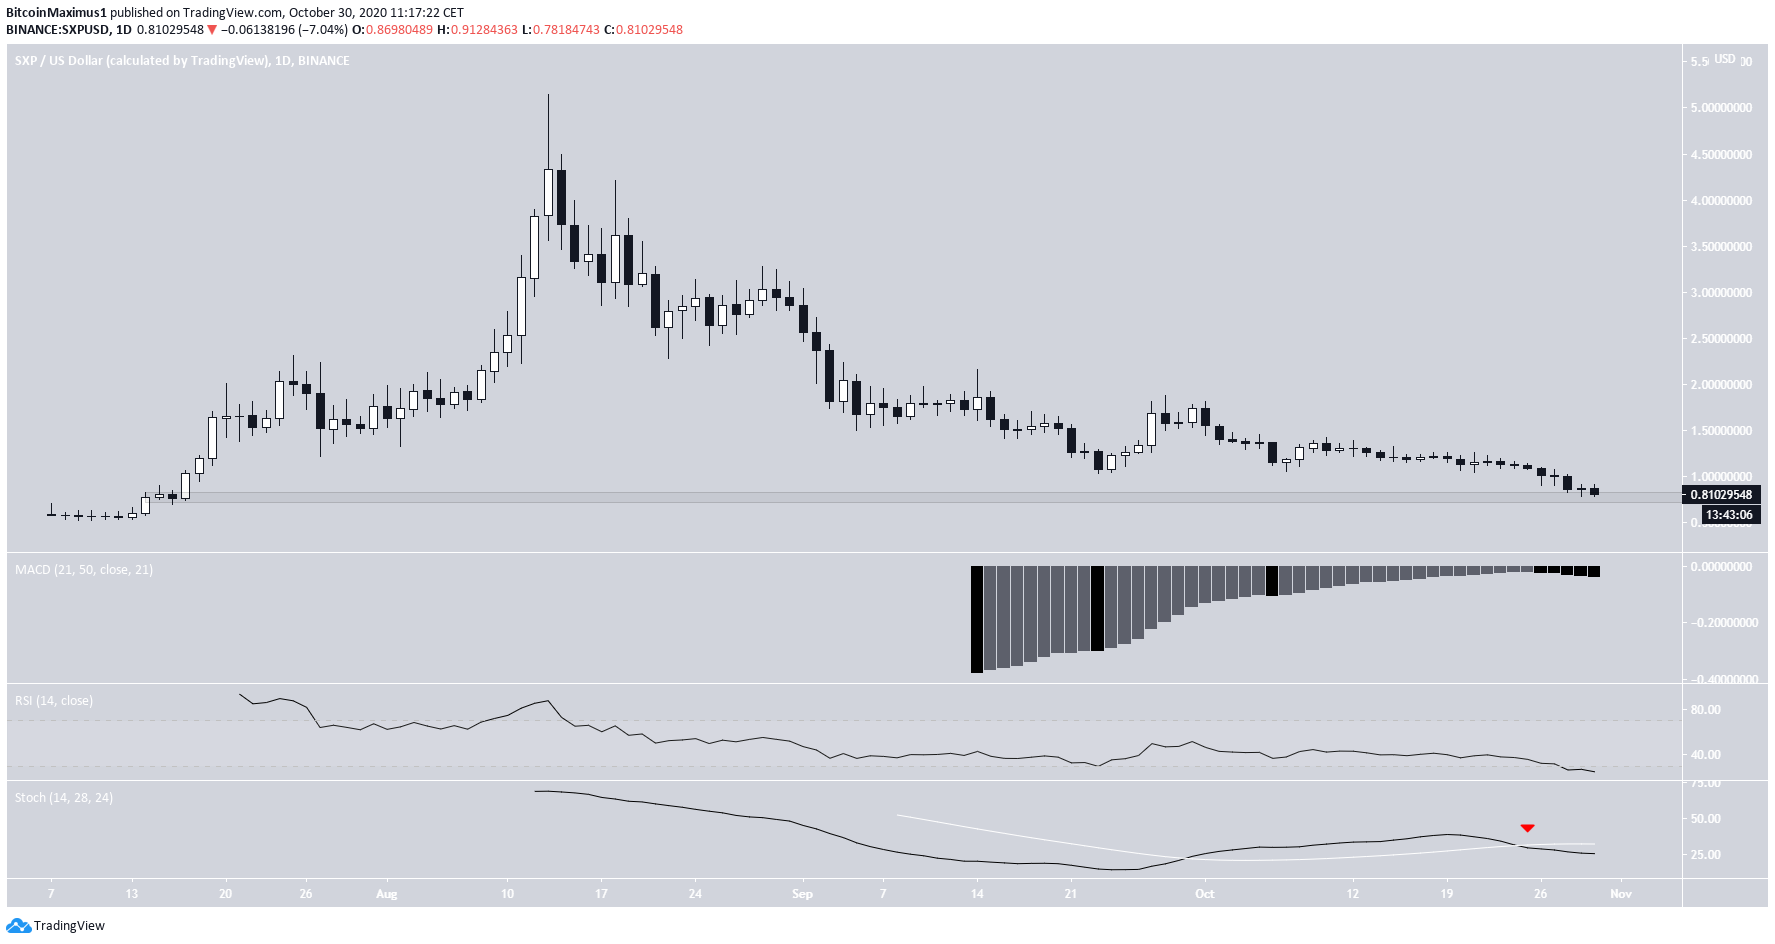
The SXP price reached a high of $5.15 on Aug 13 and has been declining since. The price has fallen through multiple support levels after initiating numerous failed bounces.
At the time of writing, the price was trading near $0.75, the final support level before SXP heads towards new all-time lows.
Despite this, there are no reversal signs yet. On the contrary, the Stochastic Oscillator has made a bearish cross and is falling, and so is the MACD. While the RSI is in oversold territory, it has yet to form any type of bullish divergence.
Short-Term Potential
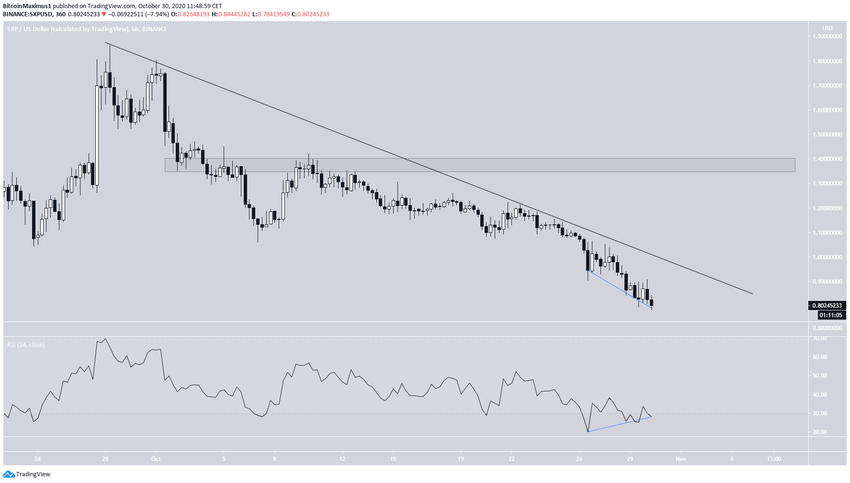
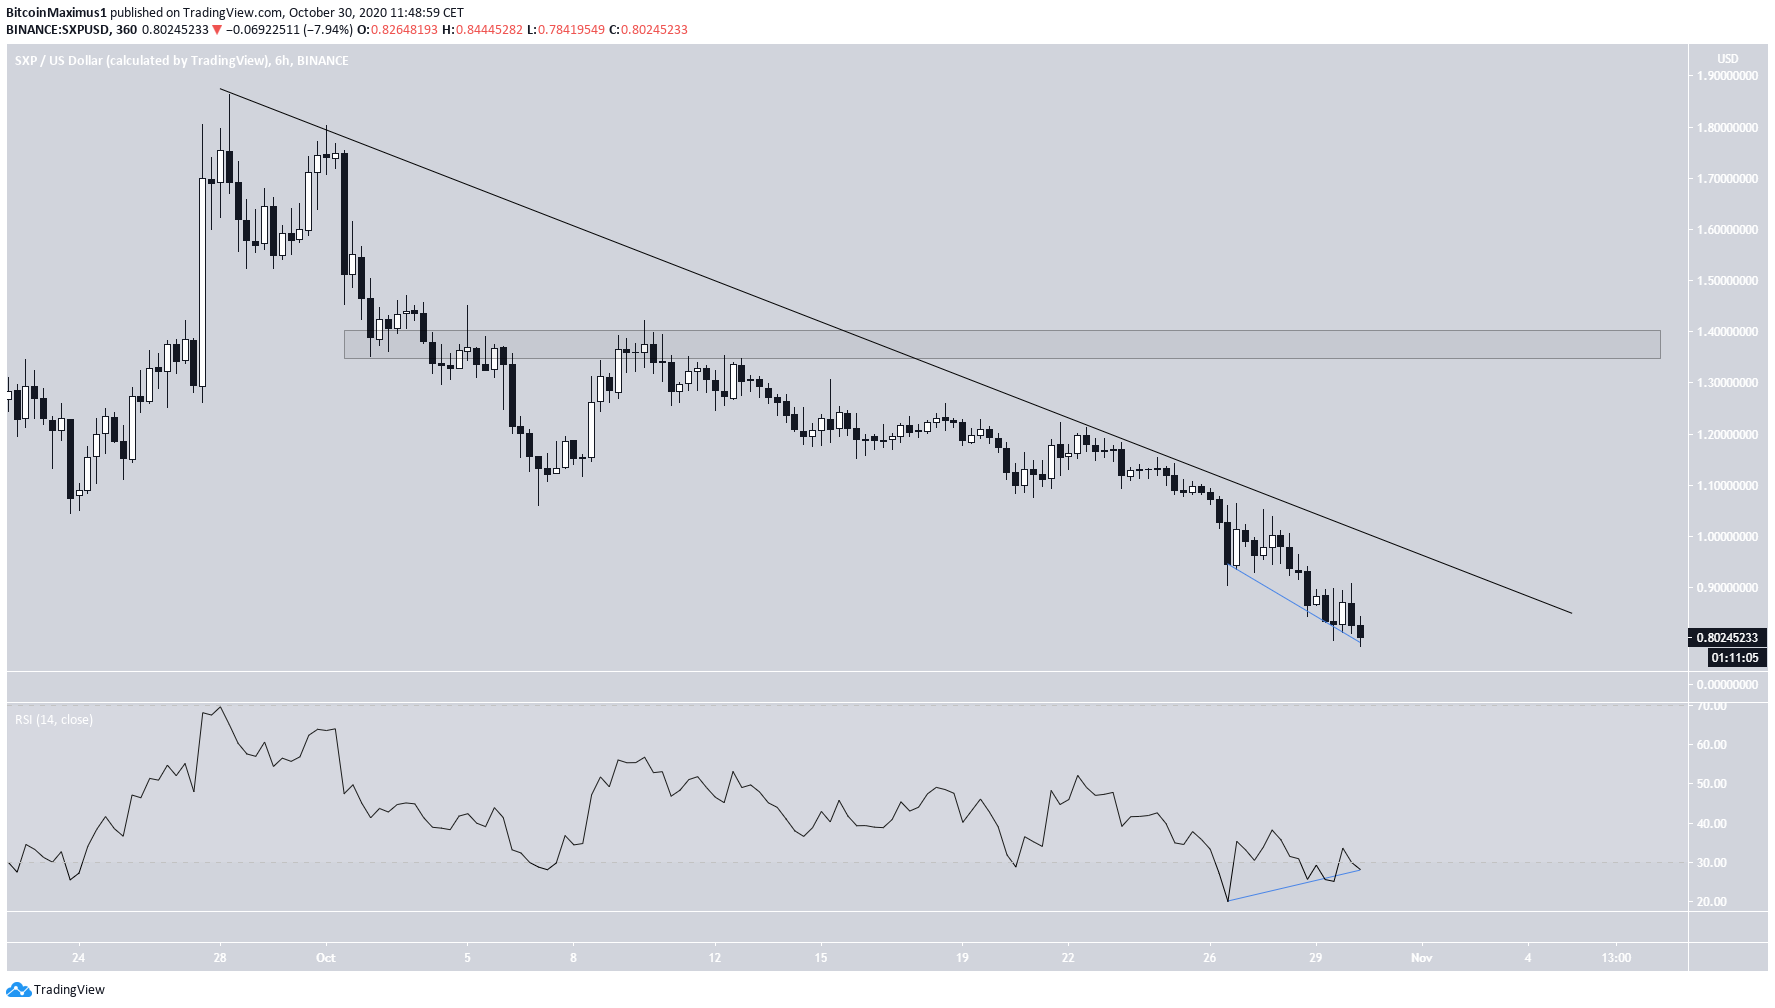
The shorter-term 6-hour chart shows that SXP has been following a descending resistance line since it reached a high on Sept 29. So far, the line has been validated four times.
There is some bullish divergence developing on the RSI that could cause a breakout. If the price were to break out, the closest resistance level would be found at $1.35.
However, until the price breaks out, the trend is bearish and SXP will likely continue lower.
The 2-hour chart also supports this possibility, since there is a pronounced bullish divergence on both the RSI and the MACD.
Therefore, an upward move towards the descending resistance line seems likely. However, due to the bearishness from the daily time-frame, we cannot yet suggest that a breakout will occur.
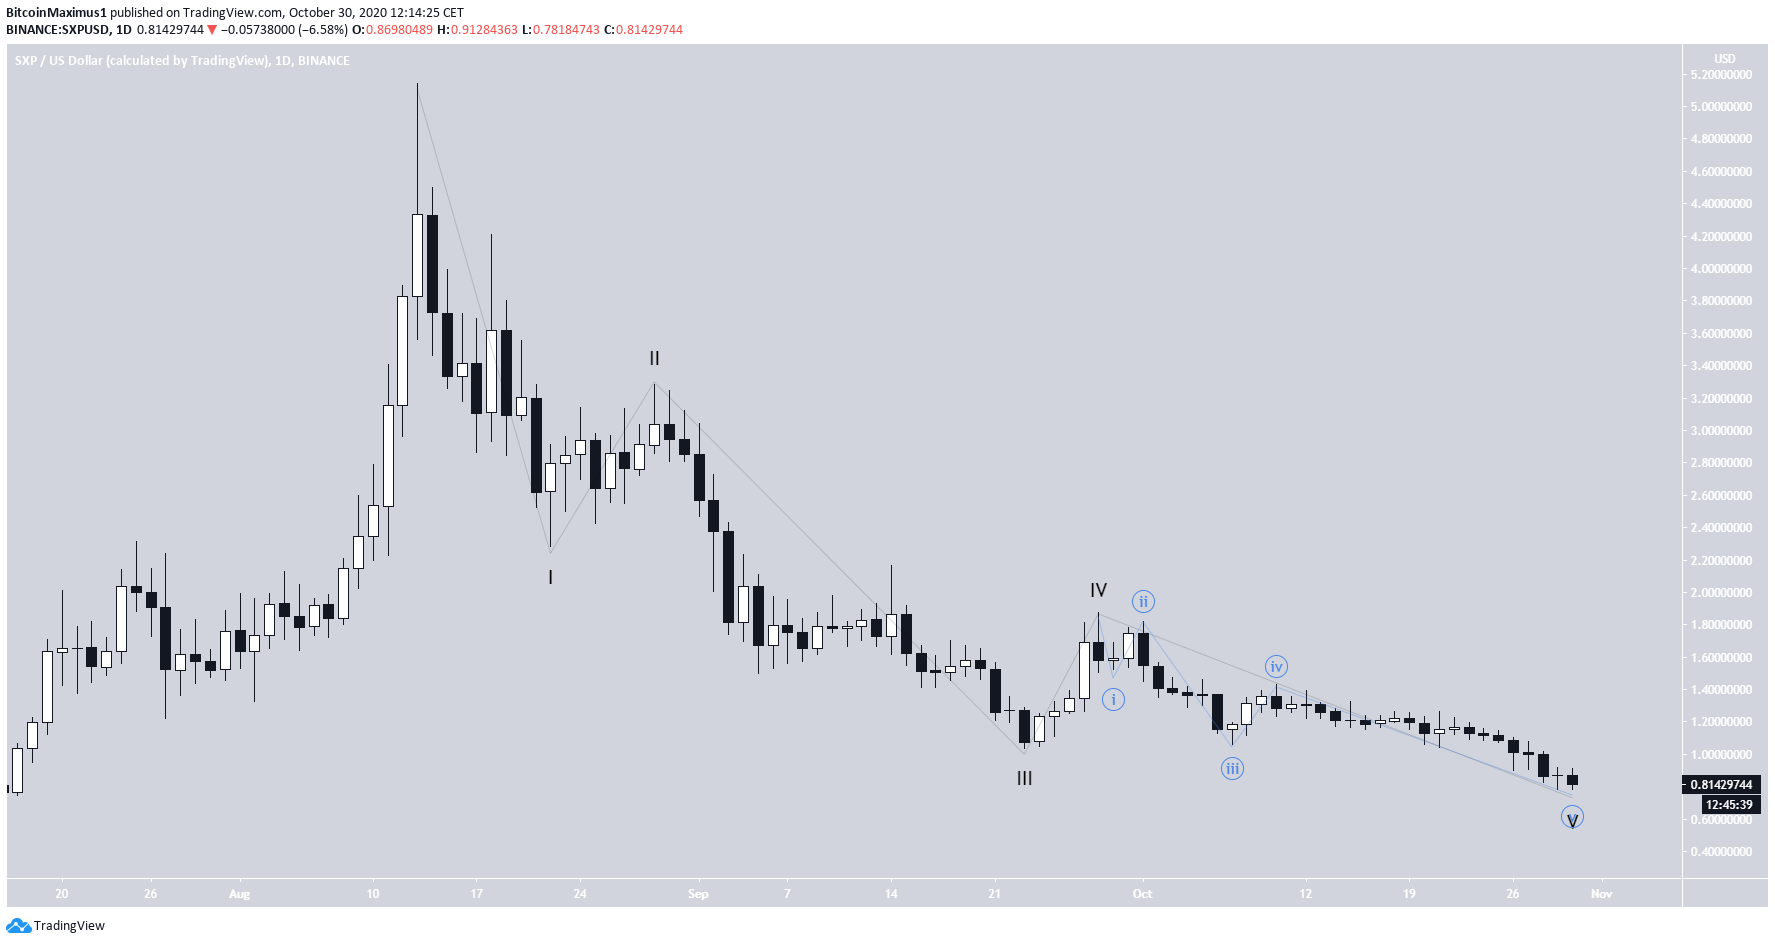
Wave Count
Cryptocurrency trader @TheEWguy outlined an SXP chart which shows a corrective structure that would take the price all the way to $1.90 – $2.
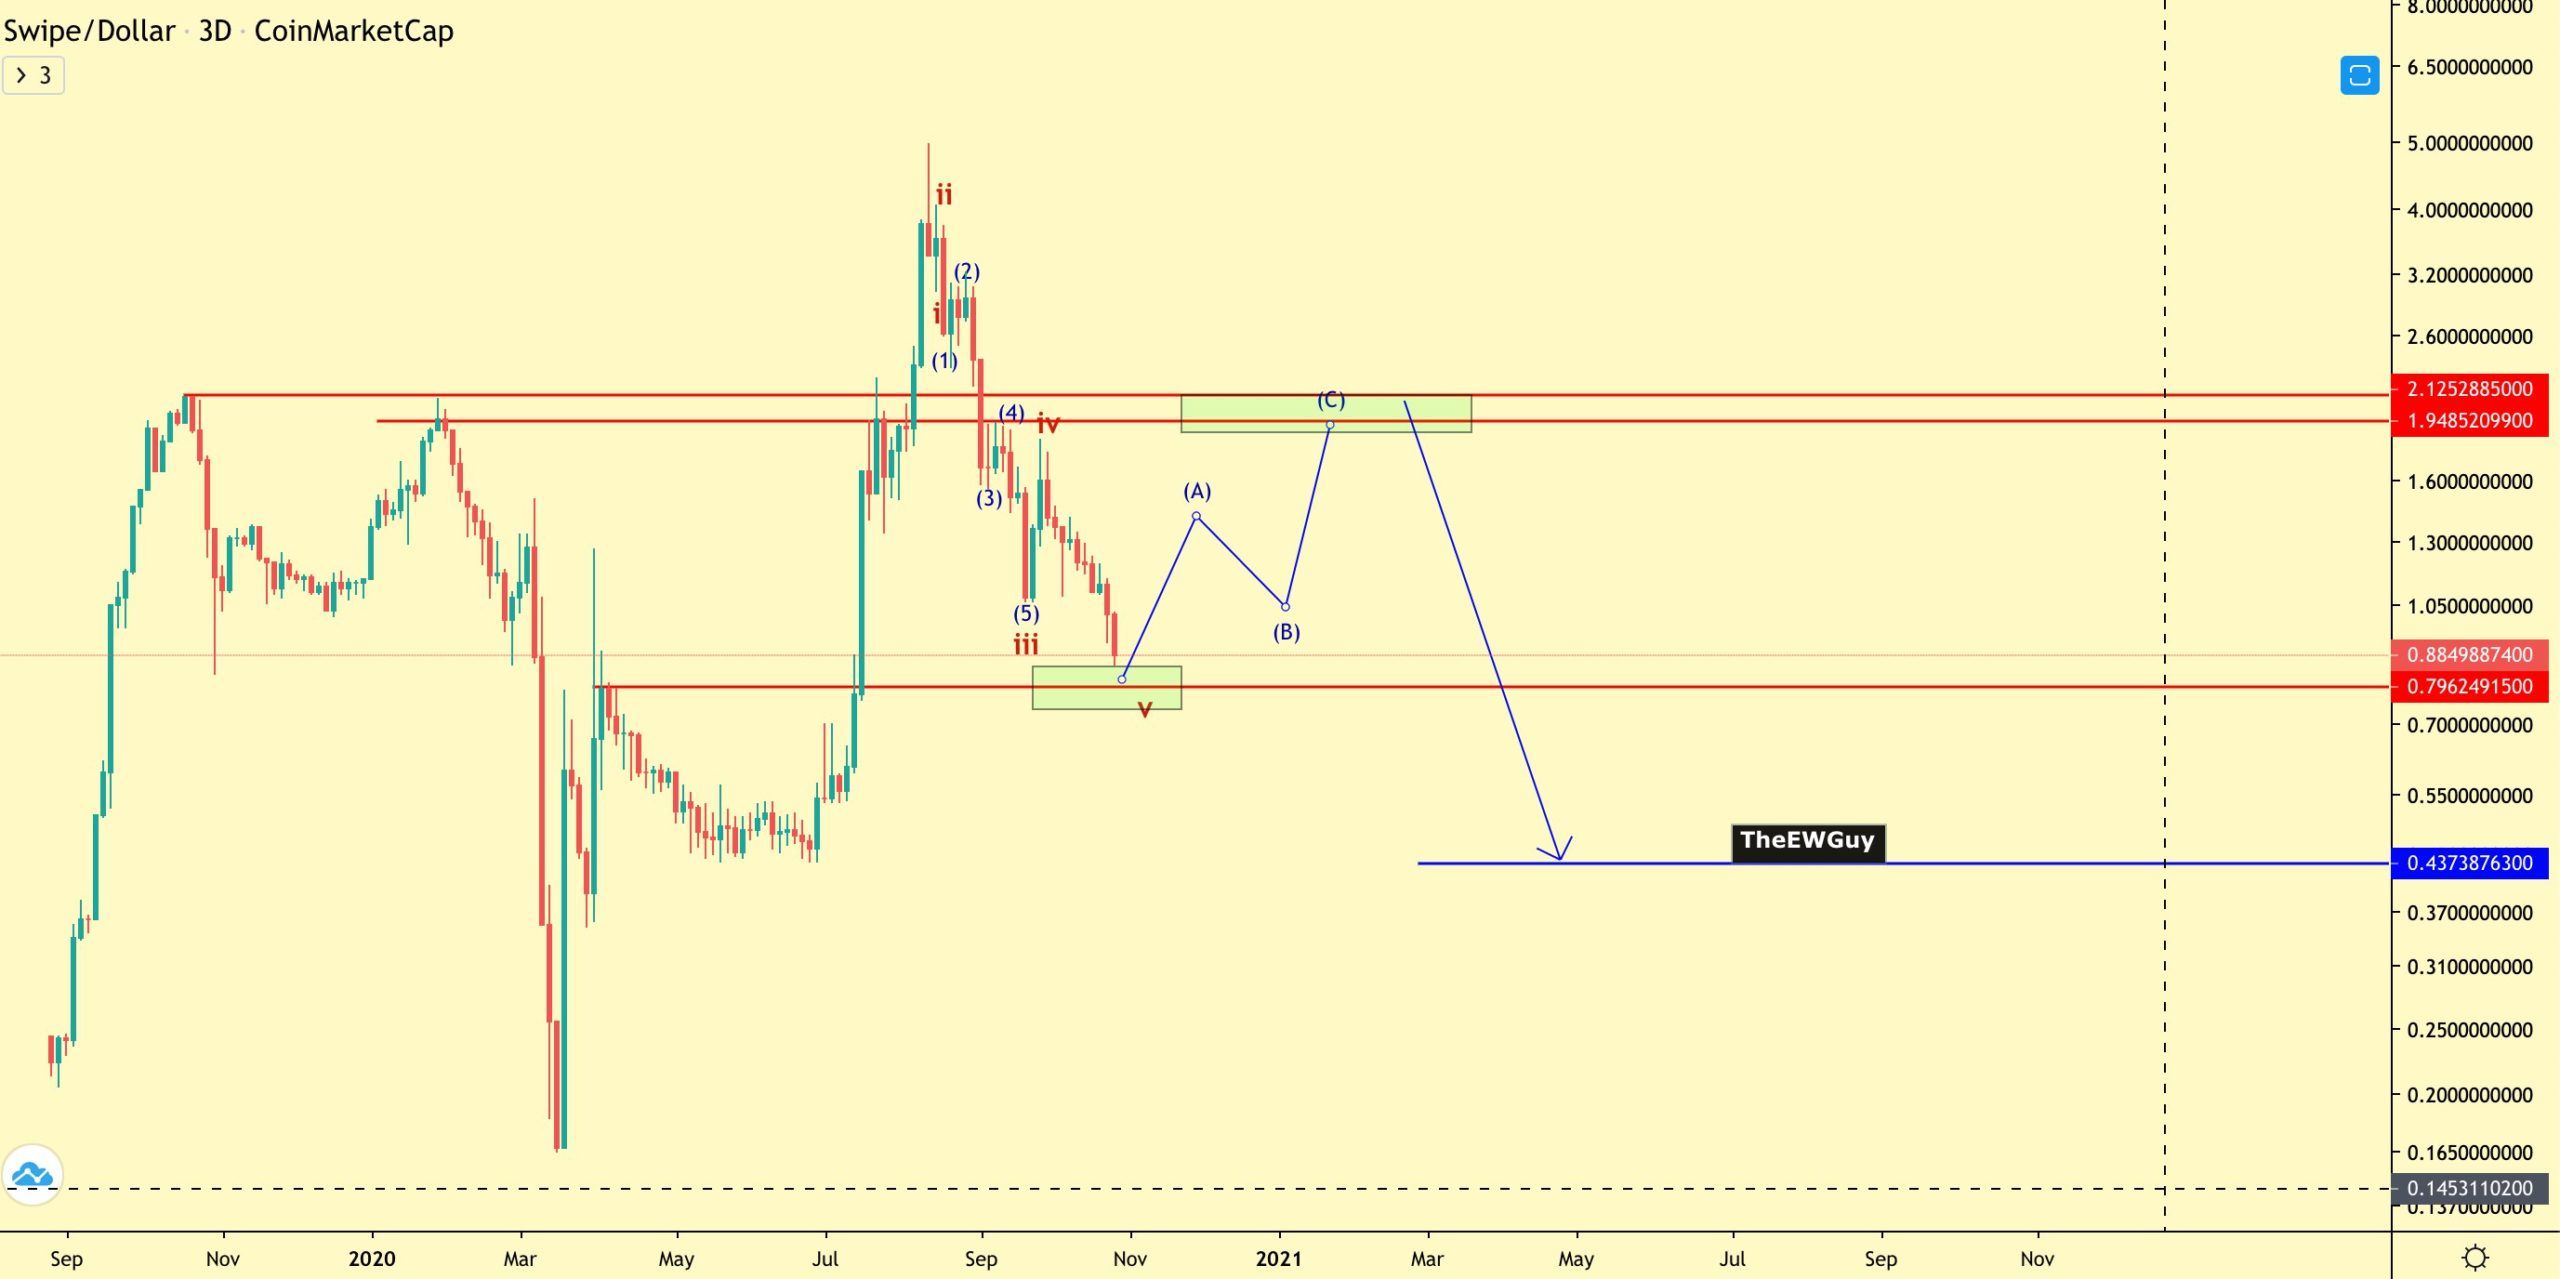
Since the previous Aug 14 all-time high, the price seems to be nearing the end of a bearish five-wave formation (shown in black bel0w). The sub-wave count for wave 5 (blue) suggests that the price is in sub-wave 5, after which a considerable rally should follow.
This fits with the long-term support level outlined in the first section and the bullish short-term indicators and would be confirmed by a breakout above the descending resistance line.
If so, the price could rally towards the $1.90 – $2 target given in the tweet.
To conclude, the SXP price should eventually break out from the current descending resistance line and initiate a correction towards $2.
For BeInCrypto’s latest Bitcoin analysis, click here!
Disclaimer: Cryptocurrency trading carries a high level of risk and may not be suitable for all investors. The views expressed in this article do not reflect those of BeInCrypto.


