It is possible that the Swipe (SXP) correction that has been going on since May has come to an end. A breakout from the current pattern would confirm this possibility.
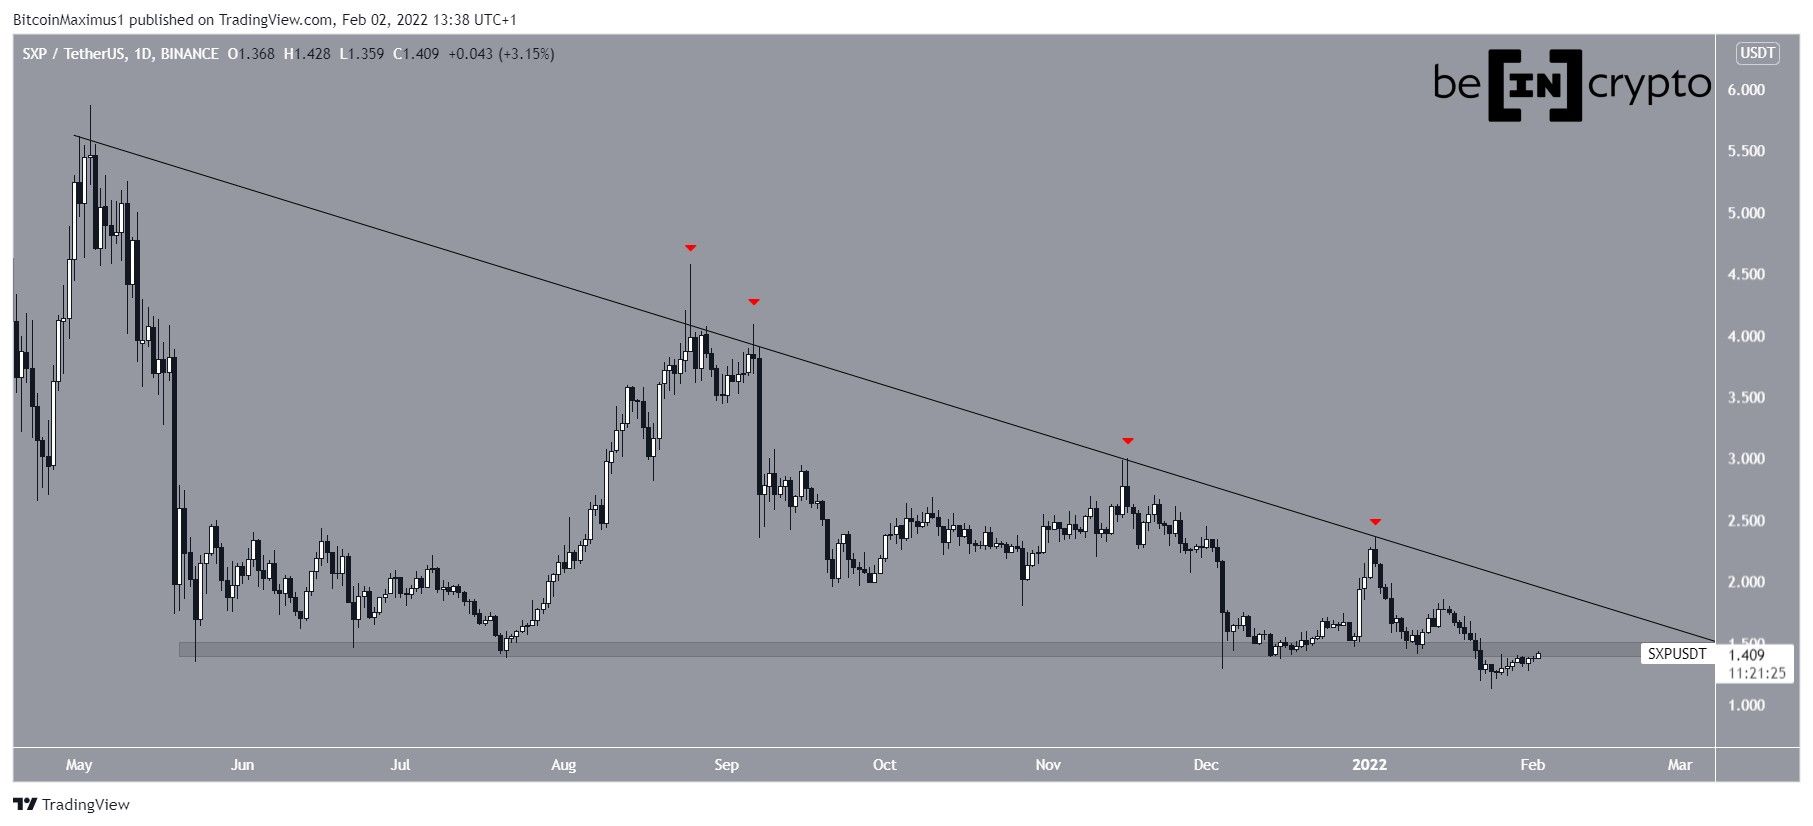
SXP has been decreasing alongside a descending resistance line since reaching an all-time high price of $5.87 on May 3. So far, the line has rejected SXP four times, most recently on Jan 2 (red icons). The rejection led to a low of $1.11 on Jan 24.
SXP has been moving upwards since and is currently trading inside the $1.45 horizontal area. This is a crucial area that acted as support since May 2021. Therefore, its reclaim would be a very important development, since it would render the previous breakdown as only a deviation. This would also likely lead to a breakout above the aforementioned descending resistance line.
Potential SXP breakout
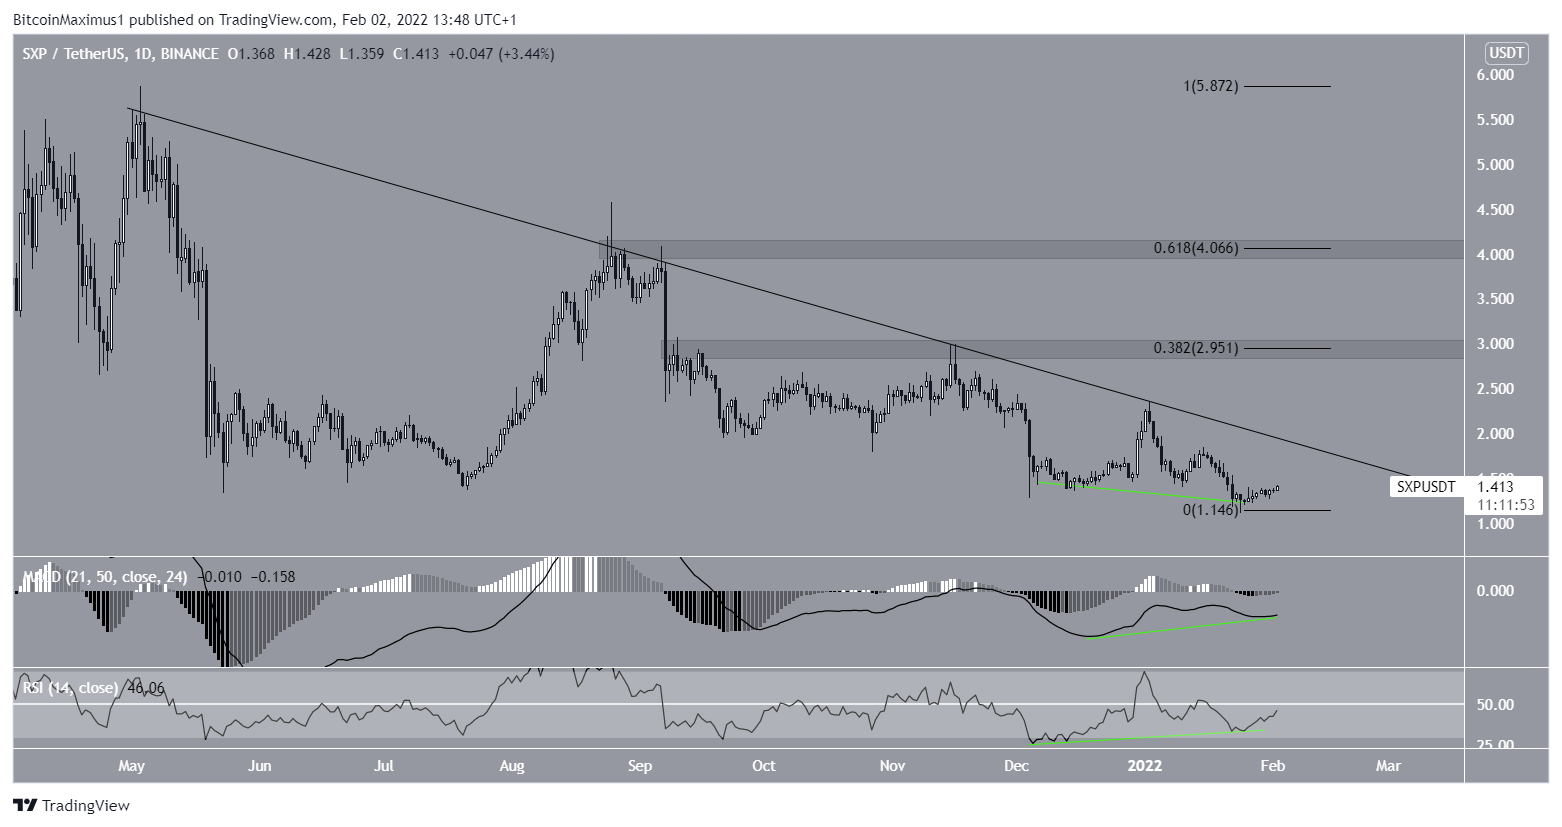
Technical indicators in the daily time-frame are bullish. This is especially evident in the considerable bullish divergence that has developed in both the RSI and MACD. Such significant divergences very often precede upward movements.
Therefore, both indicators suggest that an eventual breakout from this descending resistance line is likely.
The main resistance levels are found at $2.95 and $4.05. These are the 0.382 and 0.618 Fib retracement resistance levels, respectively.
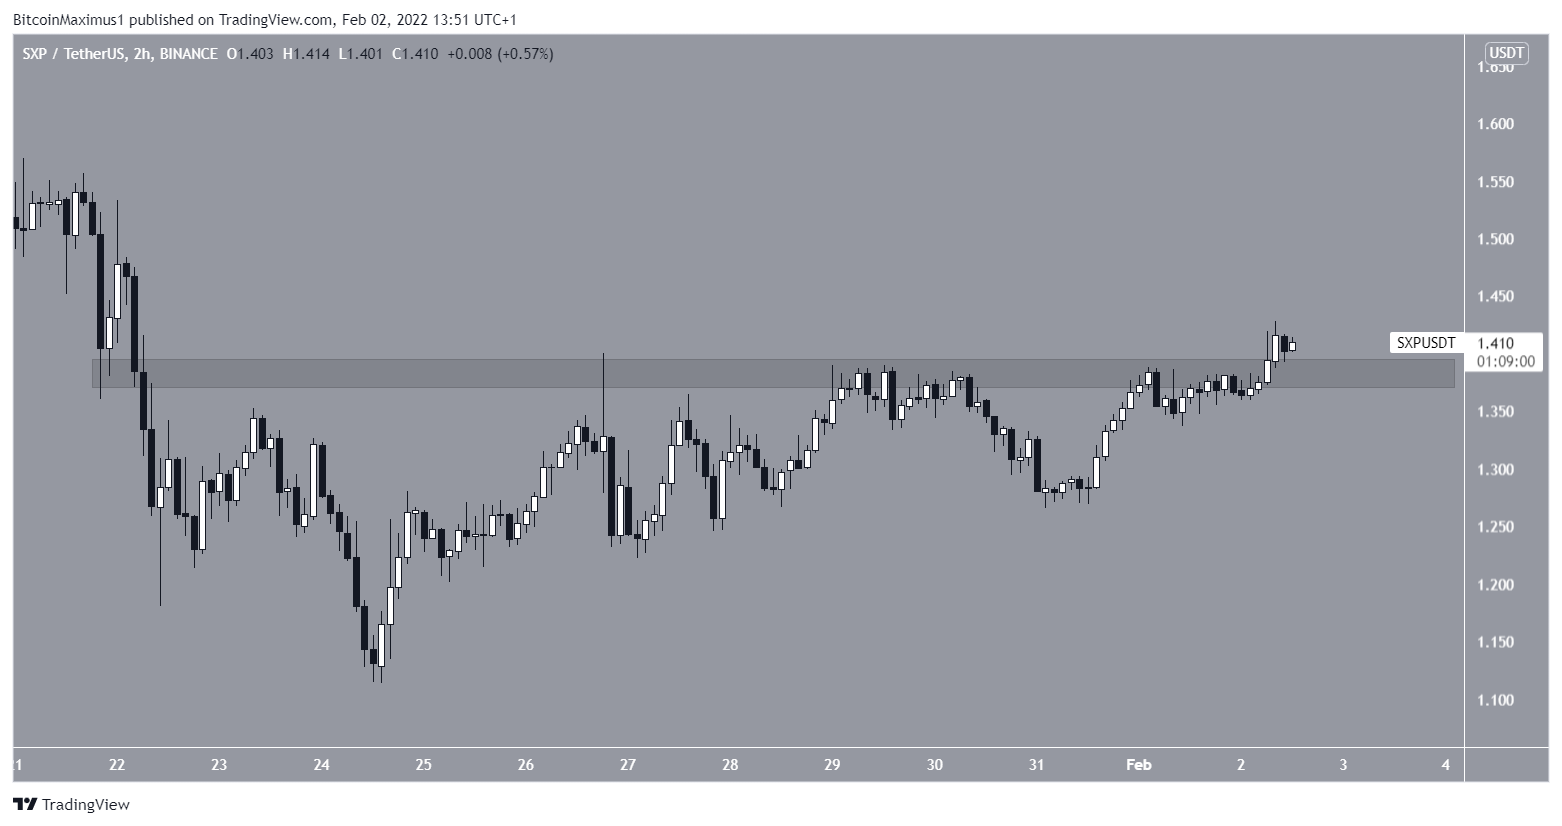
The two-hour chart also shows that SXP has broken out from the $1.38 horizontal area. This area is now expected to provide support in the future.
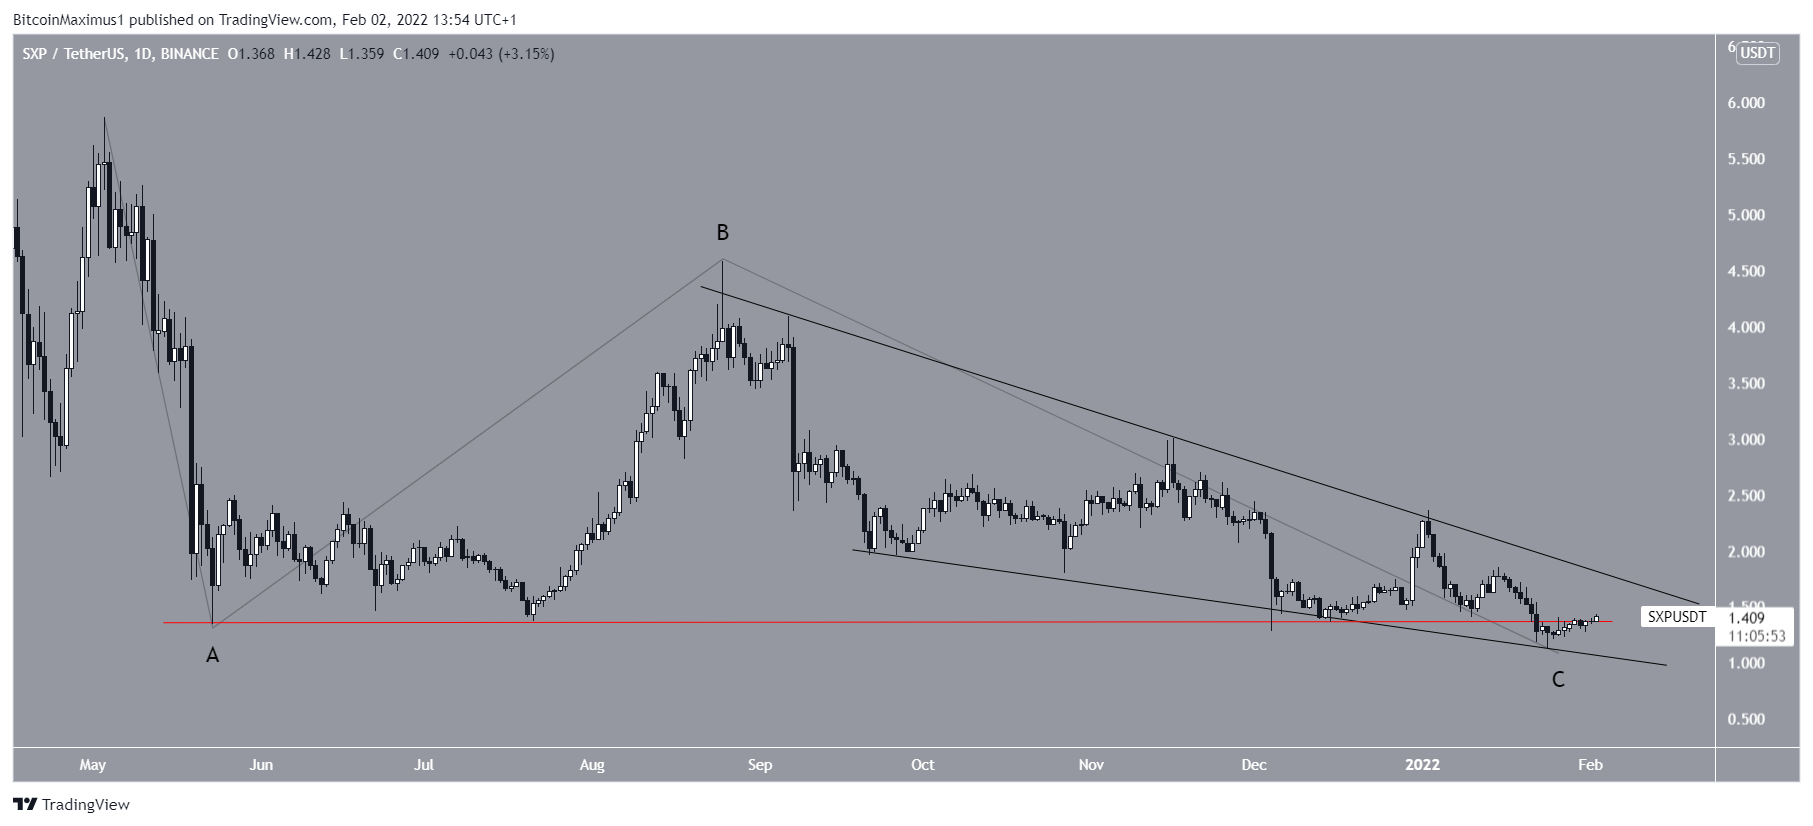
Wave count analysis
The most likely count does suggest that SXP is correcting inside a large A-B-C structure. If so, it is nearing the end or has completed the C wave, which has taken the shape of an ending diagonal.
The fact that SXP has swept the May 13 lows (red line) further supports this possibility. A breakout from the wedge would confirm that the correction is complete