

SushiSwap (SUSHI) has likely completed a long-term corrective phase and would confirm this with a breakout from the current long-term descending resistance line.
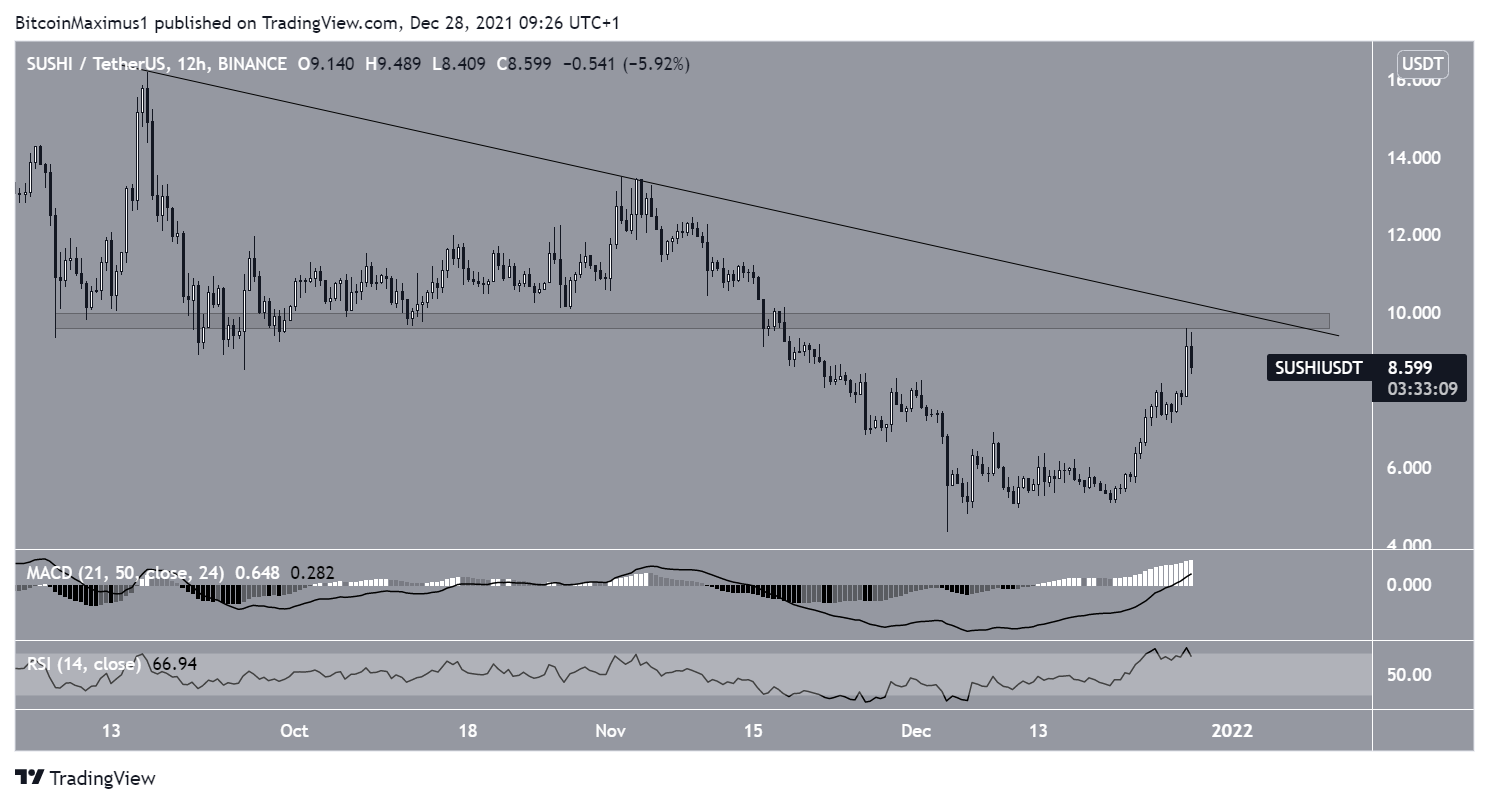
SUSHI had been decreasing under a descending resistance line since reaching a high of $22.50 on May 18. The line rejected the price multiple times, most recently on Nov 3. This led to a new low of $4.33 on Dec 4.
However, SUSHI has been moving upwards since and reclaimed the $6.30 level on Dec 22.
It’s currently approaching the resistance line once again. A breakout above this line would likely confirm that the correction is complete.
Technical indicators are bullish, supporting the continuation of the upward movement.
The MACD, which is created by short and long-term moving averages (MA), is moving upwards and is nearly positive. This means that the short-term trend is moving faster than the long-term average, and is a sign of bullish trends.
The RSI, which is a momentum indicator, has already moved above 50. This is another indicator of a bullish trend.

SushiSwap rebounds
The six-hour chart shows that SUSHI is following another short-term descending resistance line, which is near $9, coinciding with the $8.85 resistance area.
It reached the resistance line on Dec 26 and was rejected in the short term.
Despite the short-term drop, both the MACD and RSI are moving upwards, supporting the continuation of the upward movement.
Therefore, SUSHI is likely to break out from this horizontal level and the longer-term descending resistance line.
Wave count analysis
Cryptocurrency trader @TheTradingHubb outlined a SUSHI chart that shows a completed correction. This would be confirmed by reclaiming the $6.50 area.

Since the tweet, SUSHI has moved above the horizontal area and continued moving upwards. Therefore, it’s likely that the correction is complete.
When looking at the entire upward move since October, it seems that SUSHI has completed a long-term wave one (white), and completed a W-X-Y correction (black).
Therefore, it seems that it has begun a long-term wave three.
If correct, SUSHI could increase to a new all-time high and beyond.
The closest resistance area is found at $16.20, created by the 0.618 Fib retracement resistance level and a horizontal resistance area.

For BeInCrypto’s latest Bitcoin (BTC) analysis, click here
Disclaimer
In line with the Trust Project guidelines, this price analysis article is for informational purposes only and should not be considered financial or investment advice. BeInCrypto is committed to accurate, unbiased reporting, but market conditions are subject to change without notice. Always conduct your own research and consult with a professional before making any financial decisions. Please note that our Terms and Conditions, Privacy Policy, and Disclaimers have been updated.
