
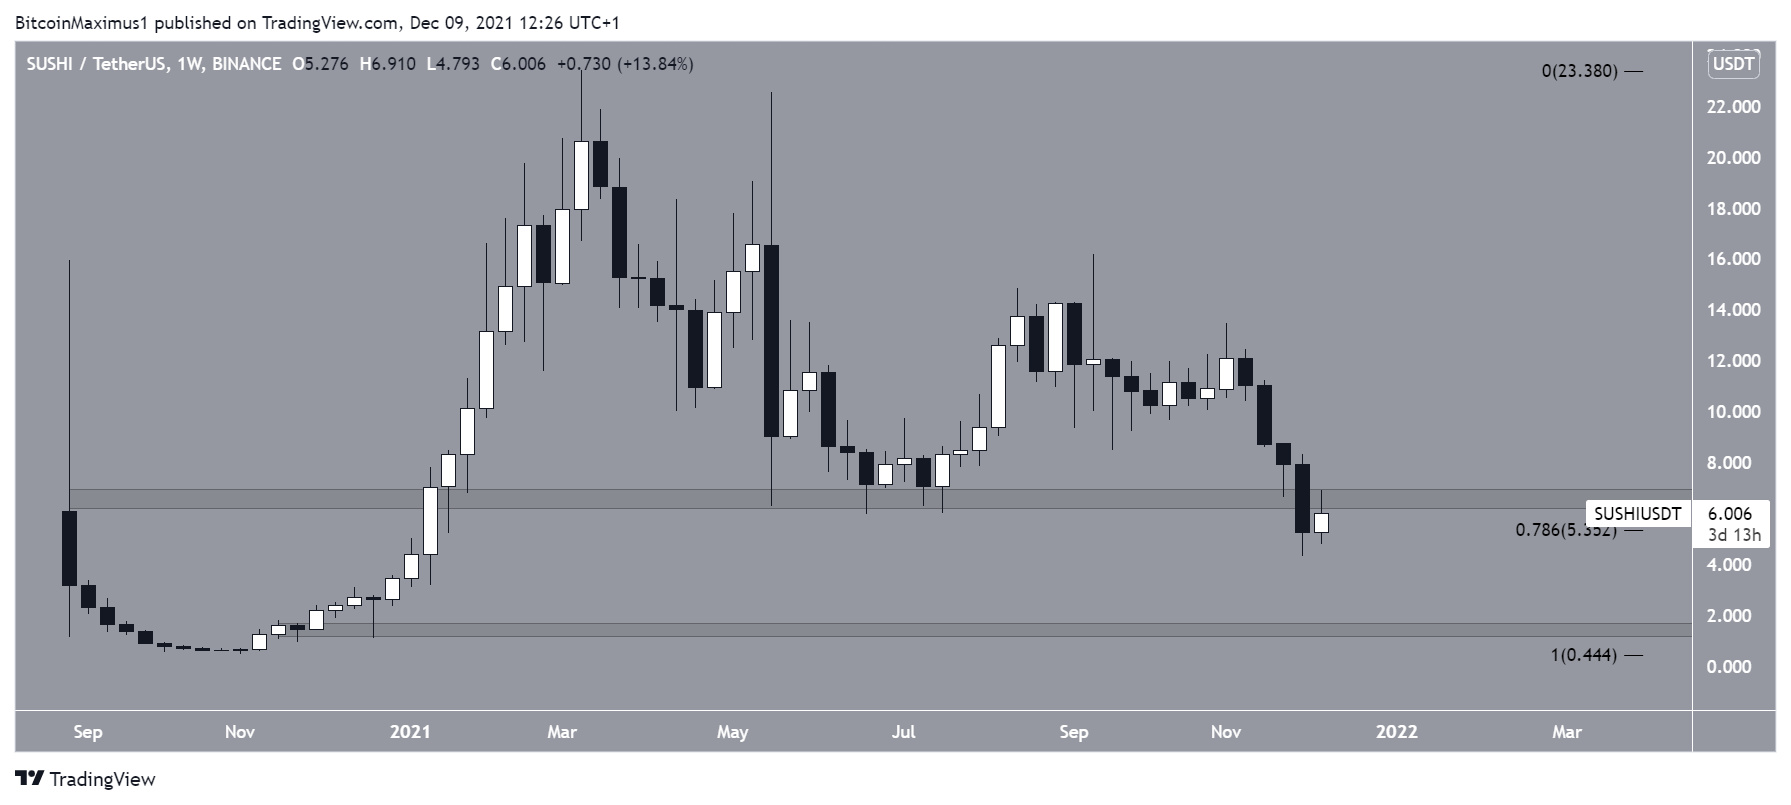
Until SushiSwap (SUSHI) manages to reclaim the $6.50 horizontal area, the long-term trend is considered bearish.
The weekly chart shows that SUSHI has fallen below the $6.50 area, above which it had previously traded since Sept.
While it is trading just above the 0.786 Fib retracement support level at $5.30, the $6.5t0 area holds crucial importance, thus the breakdown is an extremely bearish sign.
Cryptocurrency trader @ByzGeneral outlined a SUSHI chart, stating that the token is likely to continue its descent.
As outlined above, if SUSHI fails to reclaim the $6.50 area, the next support would be all the way down at $1.40.
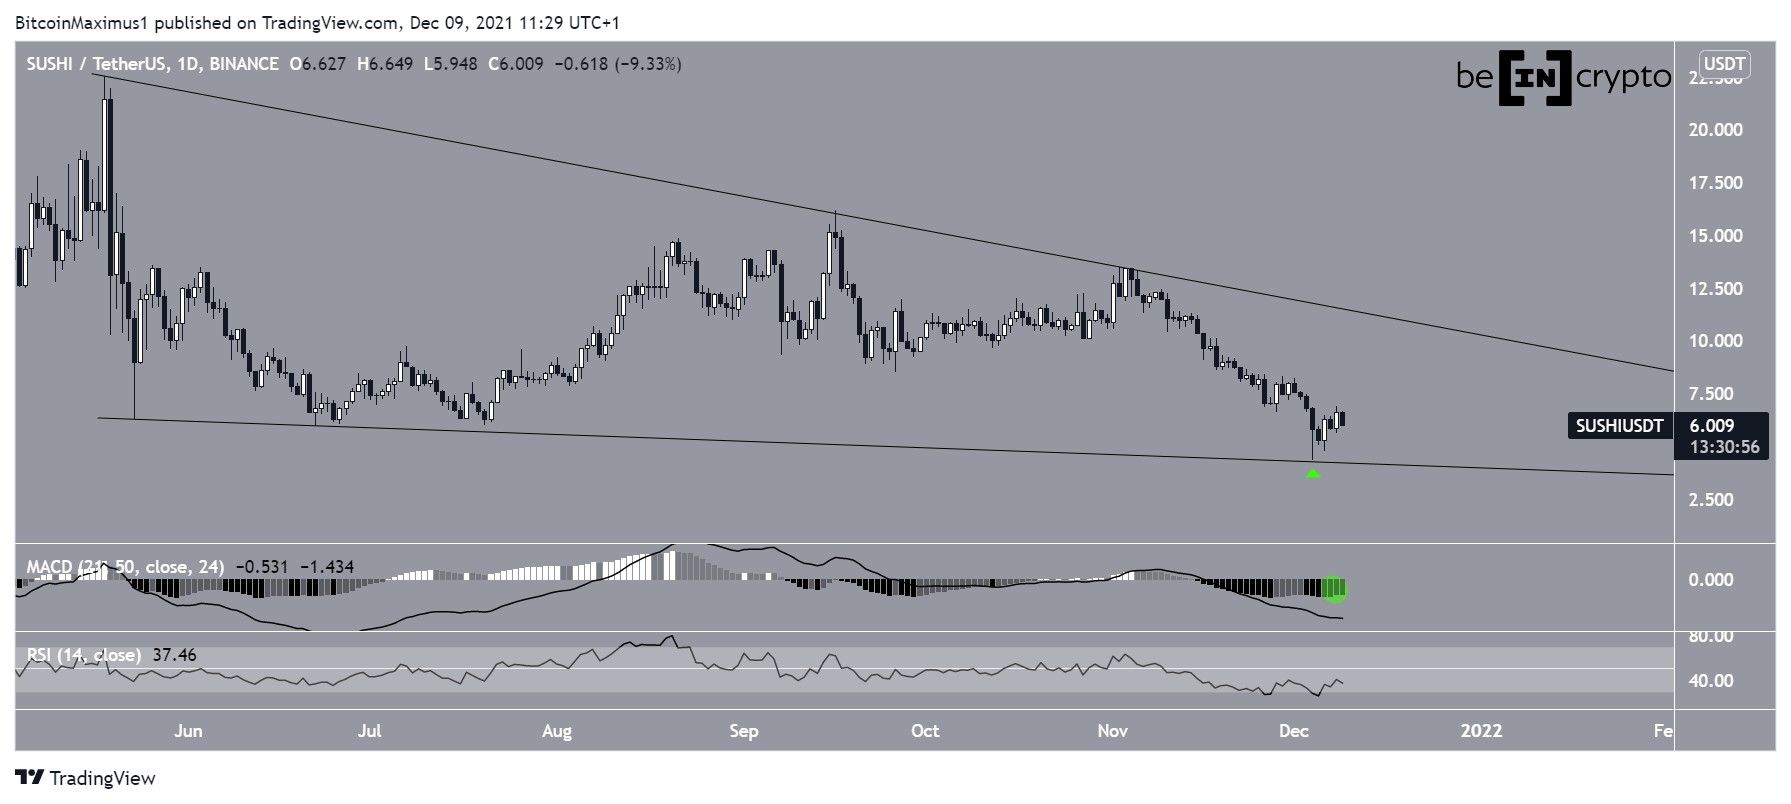
Descending wedge
The daily chart shows that SUSHI has been falling since May 18, when it had just reached a new all-time high price of $22.53. The downward movement led to a low of $4.33 on Dec 4. The token bounced afterwards.
The bounce validated a descending support line that has been in place since late May. Since SUSHI is also following a descending resistance line, it is possible that it is trading inside a descending wedge, which is considered a bullish pattern.
However, technical indicators are still bearish. The MACD, which is created by a short- and a long-term moving average (MA), is negative and decreasing. This means that the short-term MA is moving slower than the long-term one. On a more positive note, its histogram has created three consecutive (green circle) higher momentum bars, a sign that the MA is beginning to move faster.
The RSI, which is a momentum indicator, is below 50. This is also a sign of a bearish trend.
Therefore, the daily time-frame provides a generally bearish outlook.
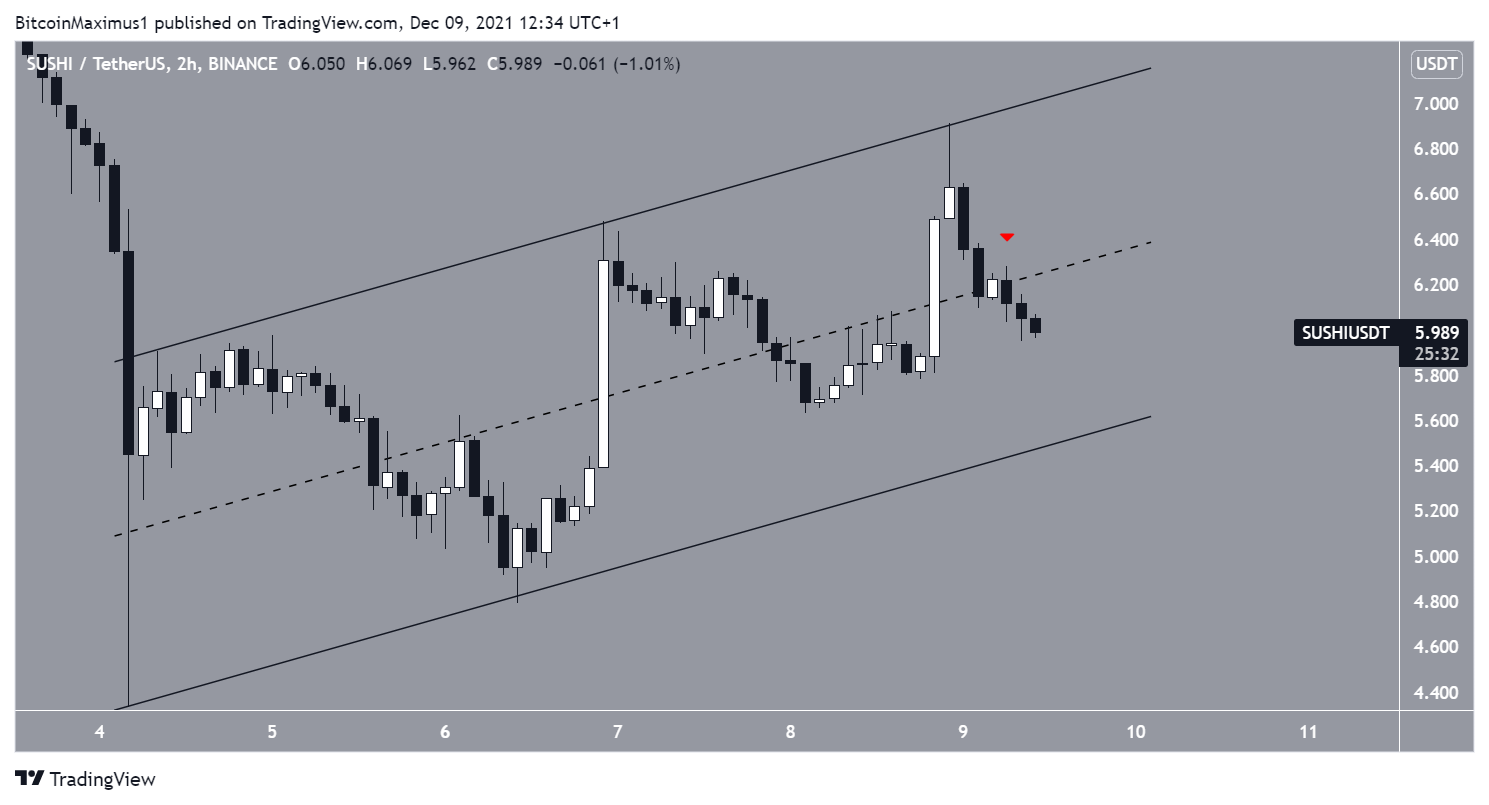
Short-term SUSHI movement
The shorter-term two-hour chart shows that SUSHI is trading inside an ascending parallel channel. It has been doing so since the Dec 4 low.
The ascending parallel channel is considered a bearish pattern, meaning that a breakdown from it would eventually be expected.
Furthermore, SUSHI is trading in the bottom portion of the channel, after validating the middle as resistance (red icon).
As a result, a breakdown from this pattern would be the most likely scenario.
For BeInCrypto’s latest Bitcoin (BTC) analysis, click here.
