
Sushiswap (SUSHI) has been moving upwards since bouncing on May 23.
It has broken out from a short-term descending resistance line and is approaching a crucial resistance area.
Sharp drop for SUSHI
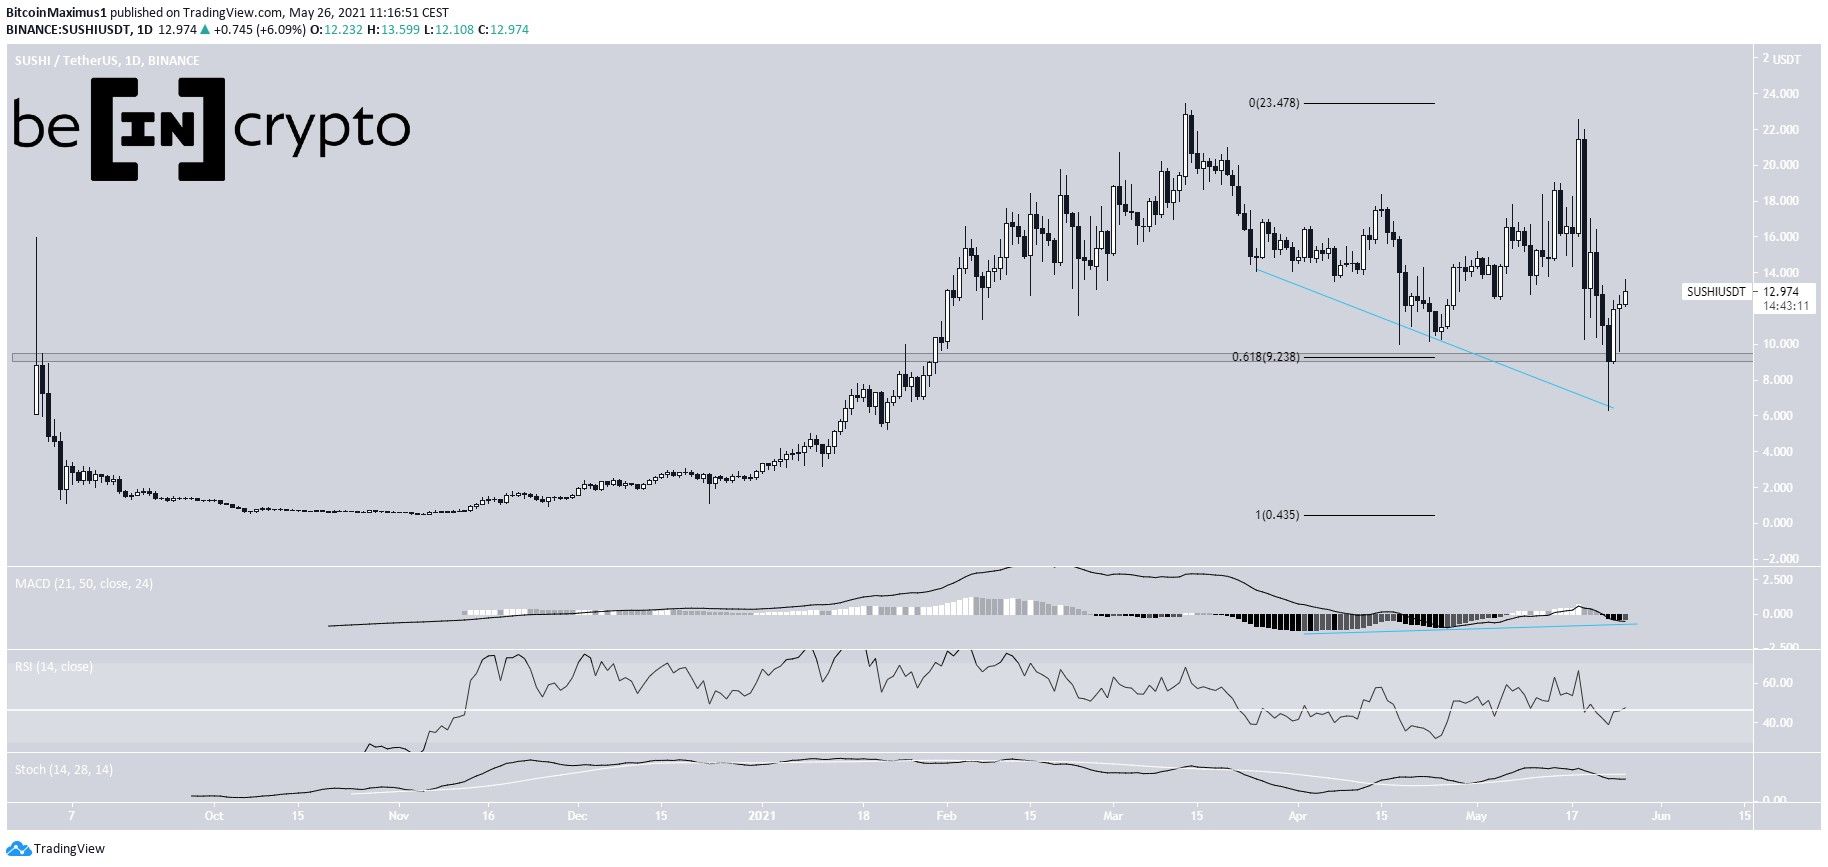
SUSHI has been gradually moving downwards since March 13, when it reached an all-time high price of $23.43.
The decrease accelerated after a lower high was made on May 18. It culminated with a low of $6.29, which was reached on May 23. However, the token has been moving upwards since.
The decrease seemed to validate the $9.25 area as support. This is both the 0.618 Fib retracement level of the entire previous upward movement and a previous resistance area.
Despite the bounce, technical indicators provide mixed signals. While the MACD is negative, it has been generating bullish divergence since the middle of March.
The RSI is right at the 50 line and the Stochastic oscillator has a neutral slope. Therefore, the trend cannot be determined by only looking at the daily time-frame.
Short-term movement
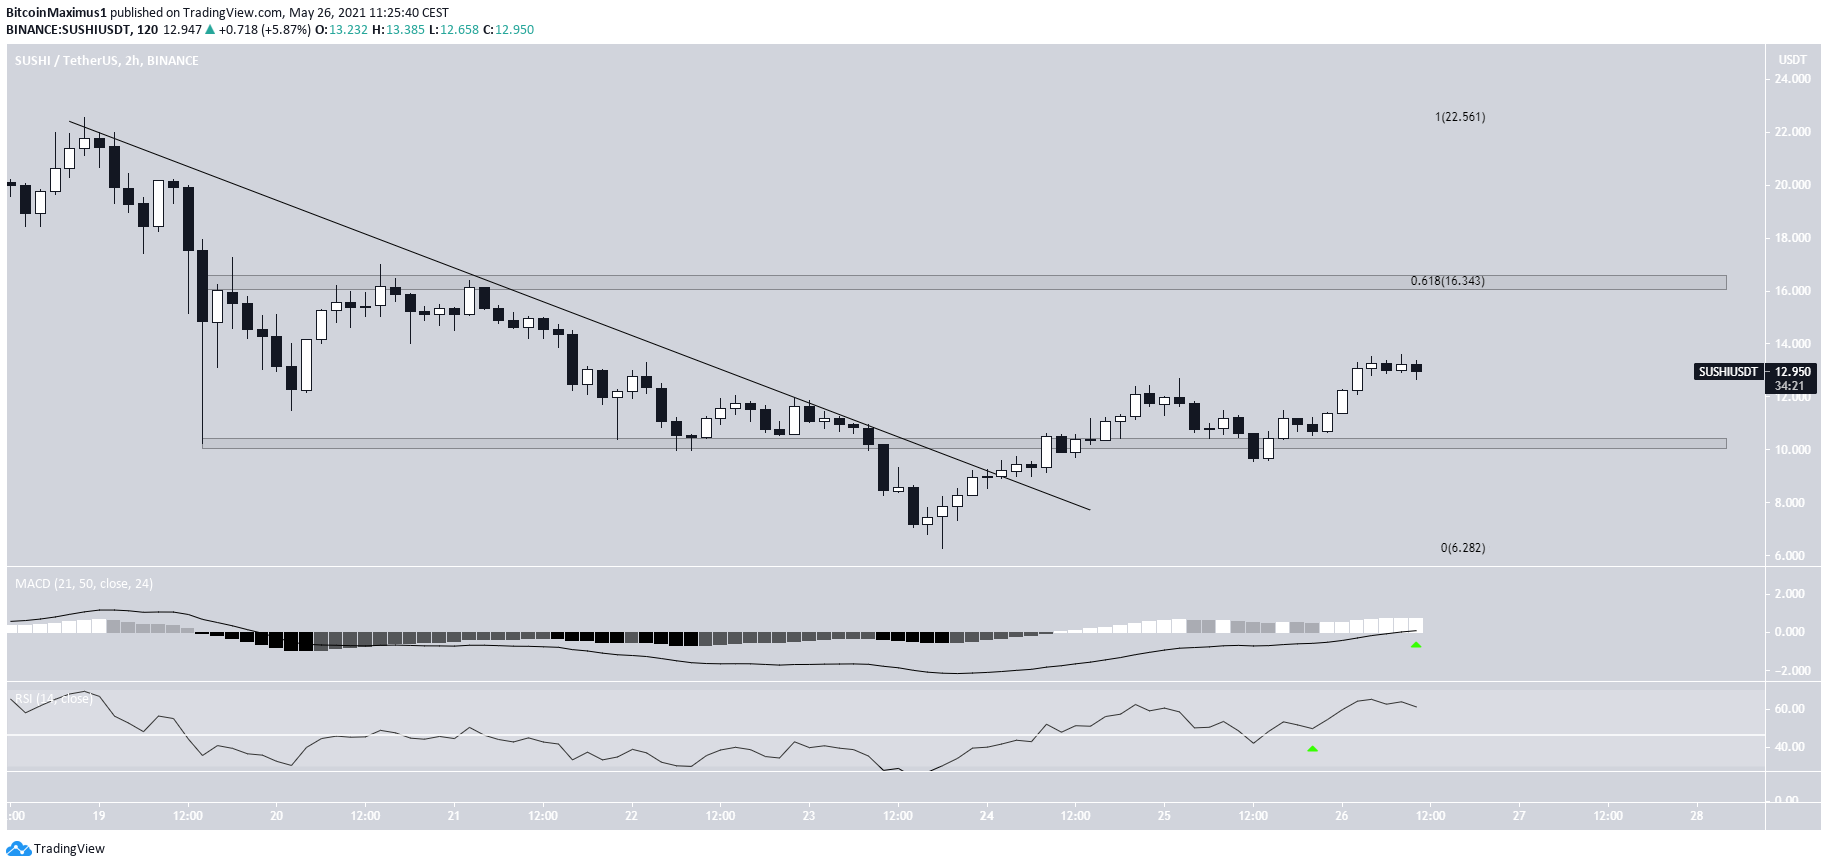
The shorter-term two-hour chart is more bullish. It shows that SUSHI has broken out from a descending resistance line that had previously been in place since May 18.
After the breakout, the token created a higher low and reclaimed the $10.25 area. The next resistance is found at $16.35, being the 0.618 Fib retracement level. A reclaim of the latter would confirm that the trend is bullish.
Both the RSI and MACD are bullish, supporting the continuation of the upward movement.
SUSHI wave count
Cryptocurrency trader @altstreetbet outlined a SUSHI chart, stating that the current impulse and its ensuing correction are now complete.
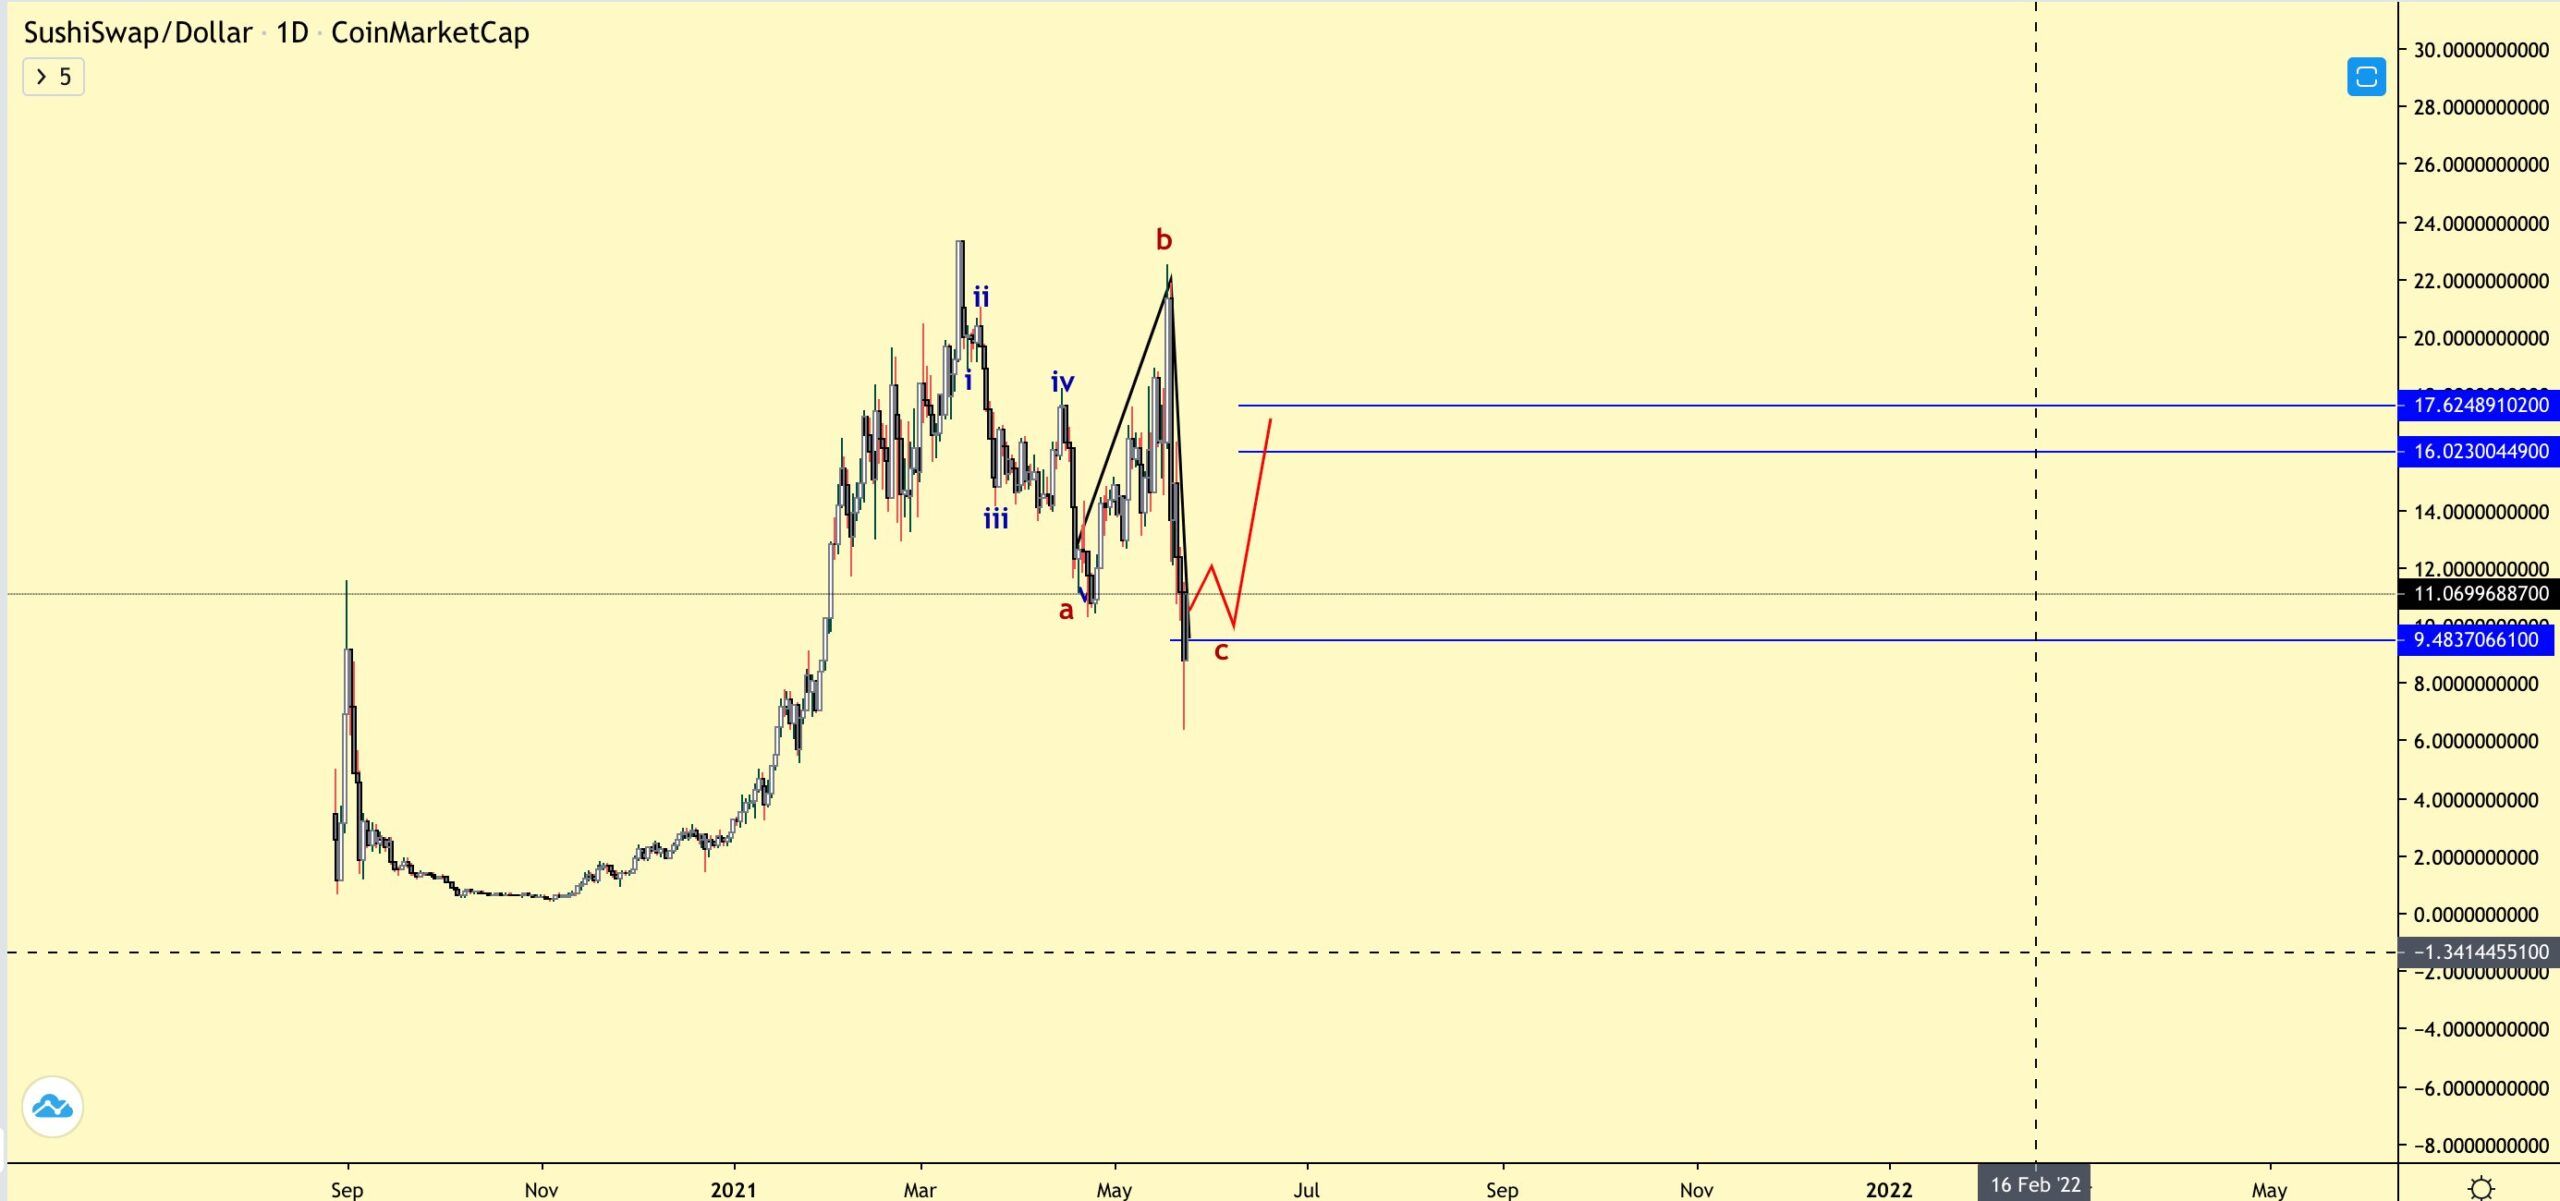
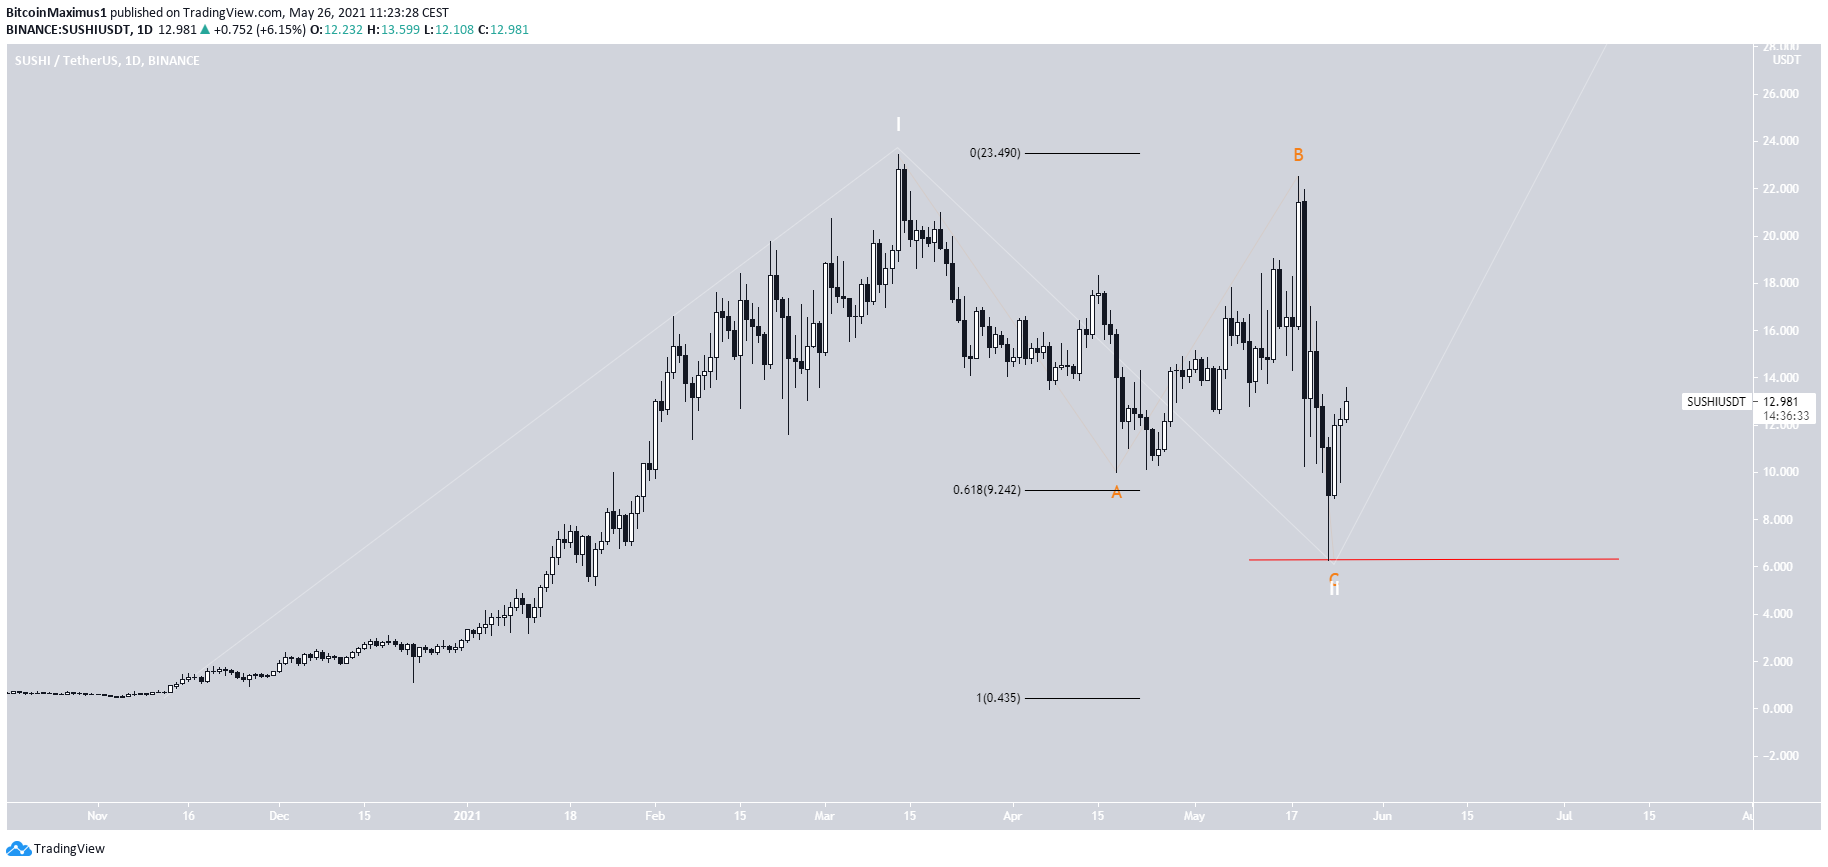
It is possible that the bullish impulse, that began in November 2020, ended with the aforementioned all-time high of March 13. If so, the ensuing movement would have been an A-B-C corrective structure.
As outlined previously, this would be confirmed with a reclaim of the 0.618 Fib resistance at $16.35. Conversely, a decrease below the May 23 low of $6.29 (red line) would invalidate this possibility.
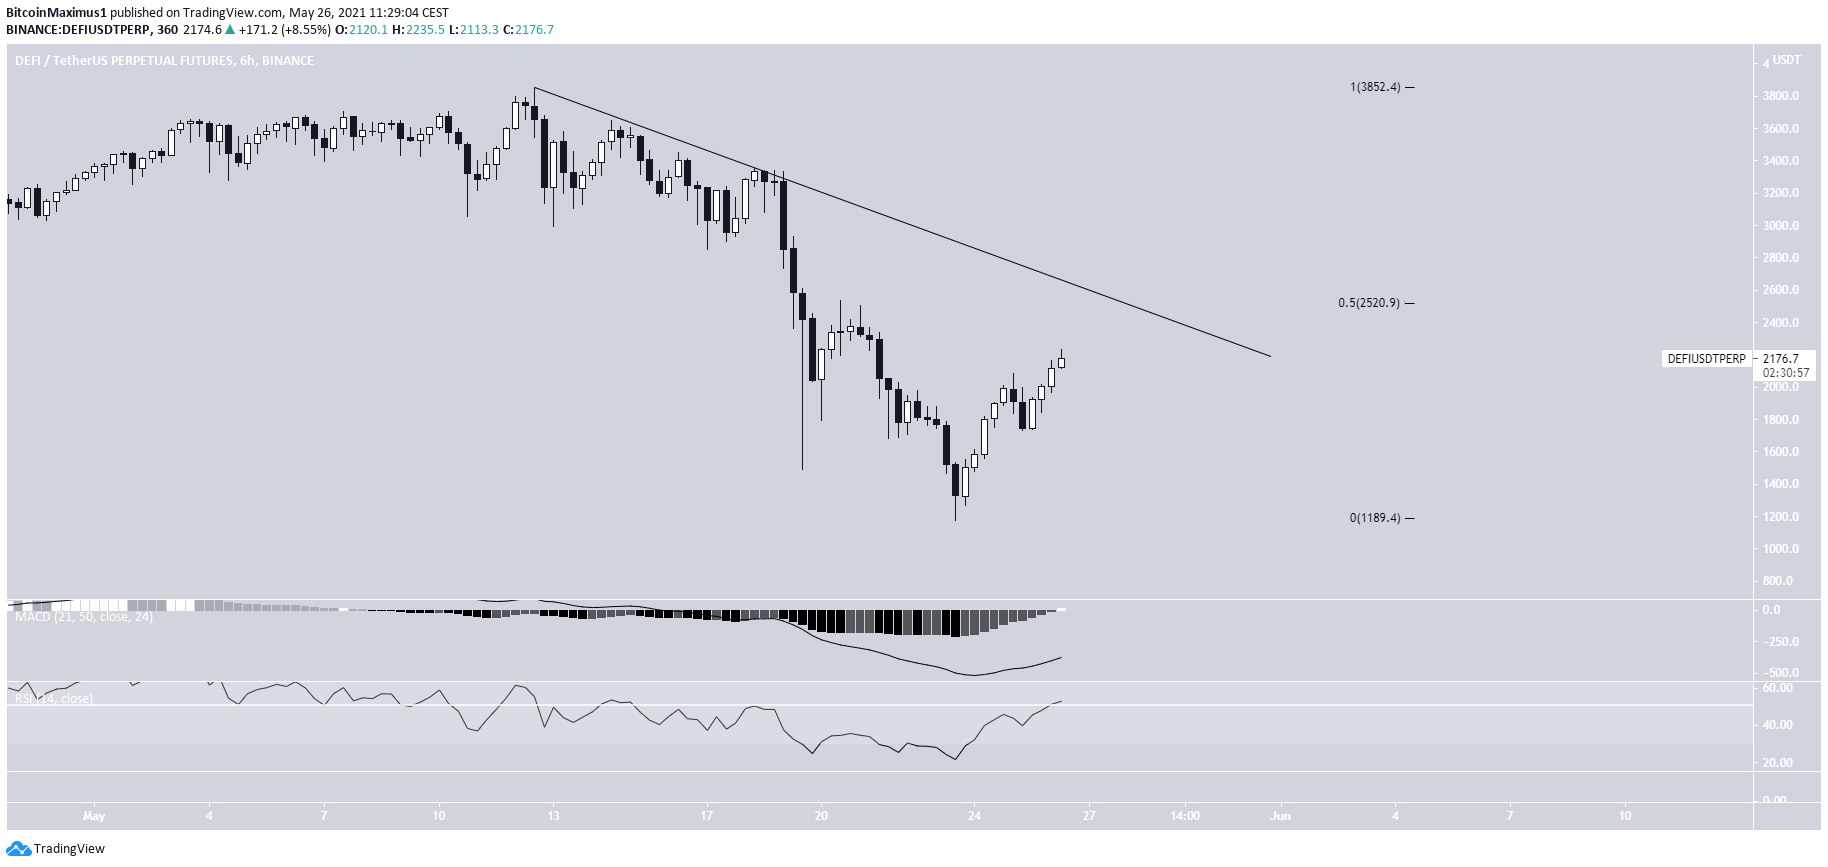
DeFi Index
The DeFi Index shows a descending resistance line in place since May 12. The line coincides with the $2,520 resistance area, which is the 0.5 Fib retracement resistance level.
Until the index is successful in breaking out above this level, we cannot consider the trend bullish.
For BeInCrypto’s latest bitcoin (BTC) analysis, click here.
