


The Sui (SUI) fell below a short-term structure, signaling that a decrease in the future price is on the cards.
The breakdown came after a rejection from a long-term resistance, increasing its validity. Moreover, the RSI movement supports the ongoing descent.
Sui Descent Accelerates After the Breakdown
The SUI price has decreased under a descending resistance line since May 4. The drop took it to the $1 horizontal support area on May 8 and has fallen since.
If the decrease continues, the closest support will be at $1. Whether the price breaks down below $1 or breaks out above the resistance line will be crucial in determining the future trend.
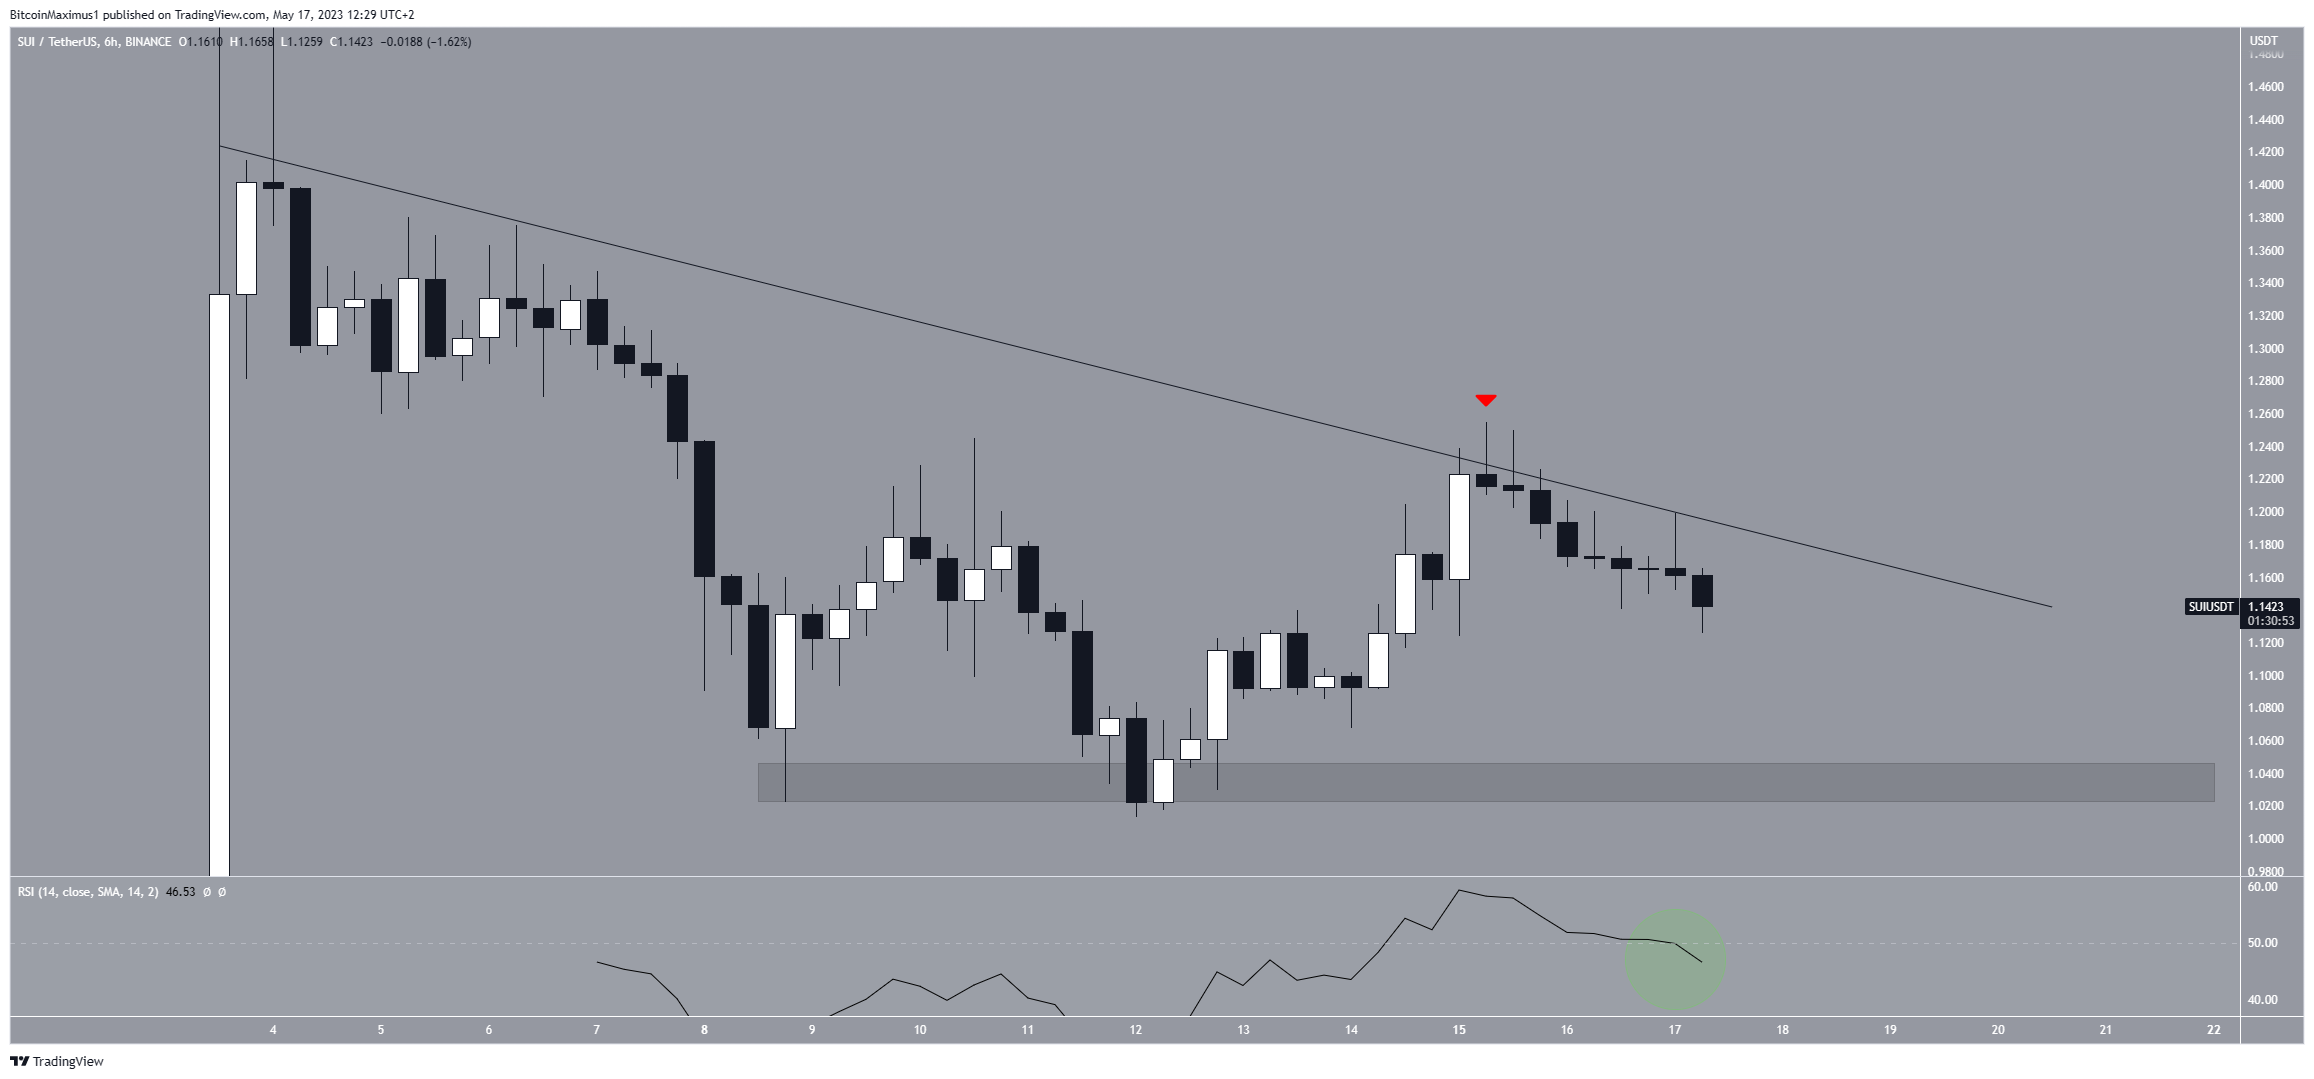
The six-hour Relative Strength Index (RSI) gives a bearish reading. When evaluating market conditions, traders use the RSI as a momentum indicator to determine if a market is overbought or oversold and to decide whether to accumulate or sell an asset.
If the RSI reading is above 50 and the trend is upward, bulls still have an advantage, but if the reading is below 50, the opposite is true. The indicator fell below 50 and is moving downwards (green circle), a sign of a bearish trend.
SUI Price Prediction: Will Price Return to Support?
The technical analysis from the short-term 1-hour chart supports the possibility of a decrease. The main reason for this is that the price broke down from an ascending parallel channel on May 17.
This indicates that the previous structure is not valid anymore and a decrease will follow. So, it aligns with the bearish readings from the six-hour time frame.
Additionally, the hourly RSI is below 50 and falling, suggesting that the drop is expected to continue. If so, the SUI price will likely fall to the $1 horizontal resistance area.
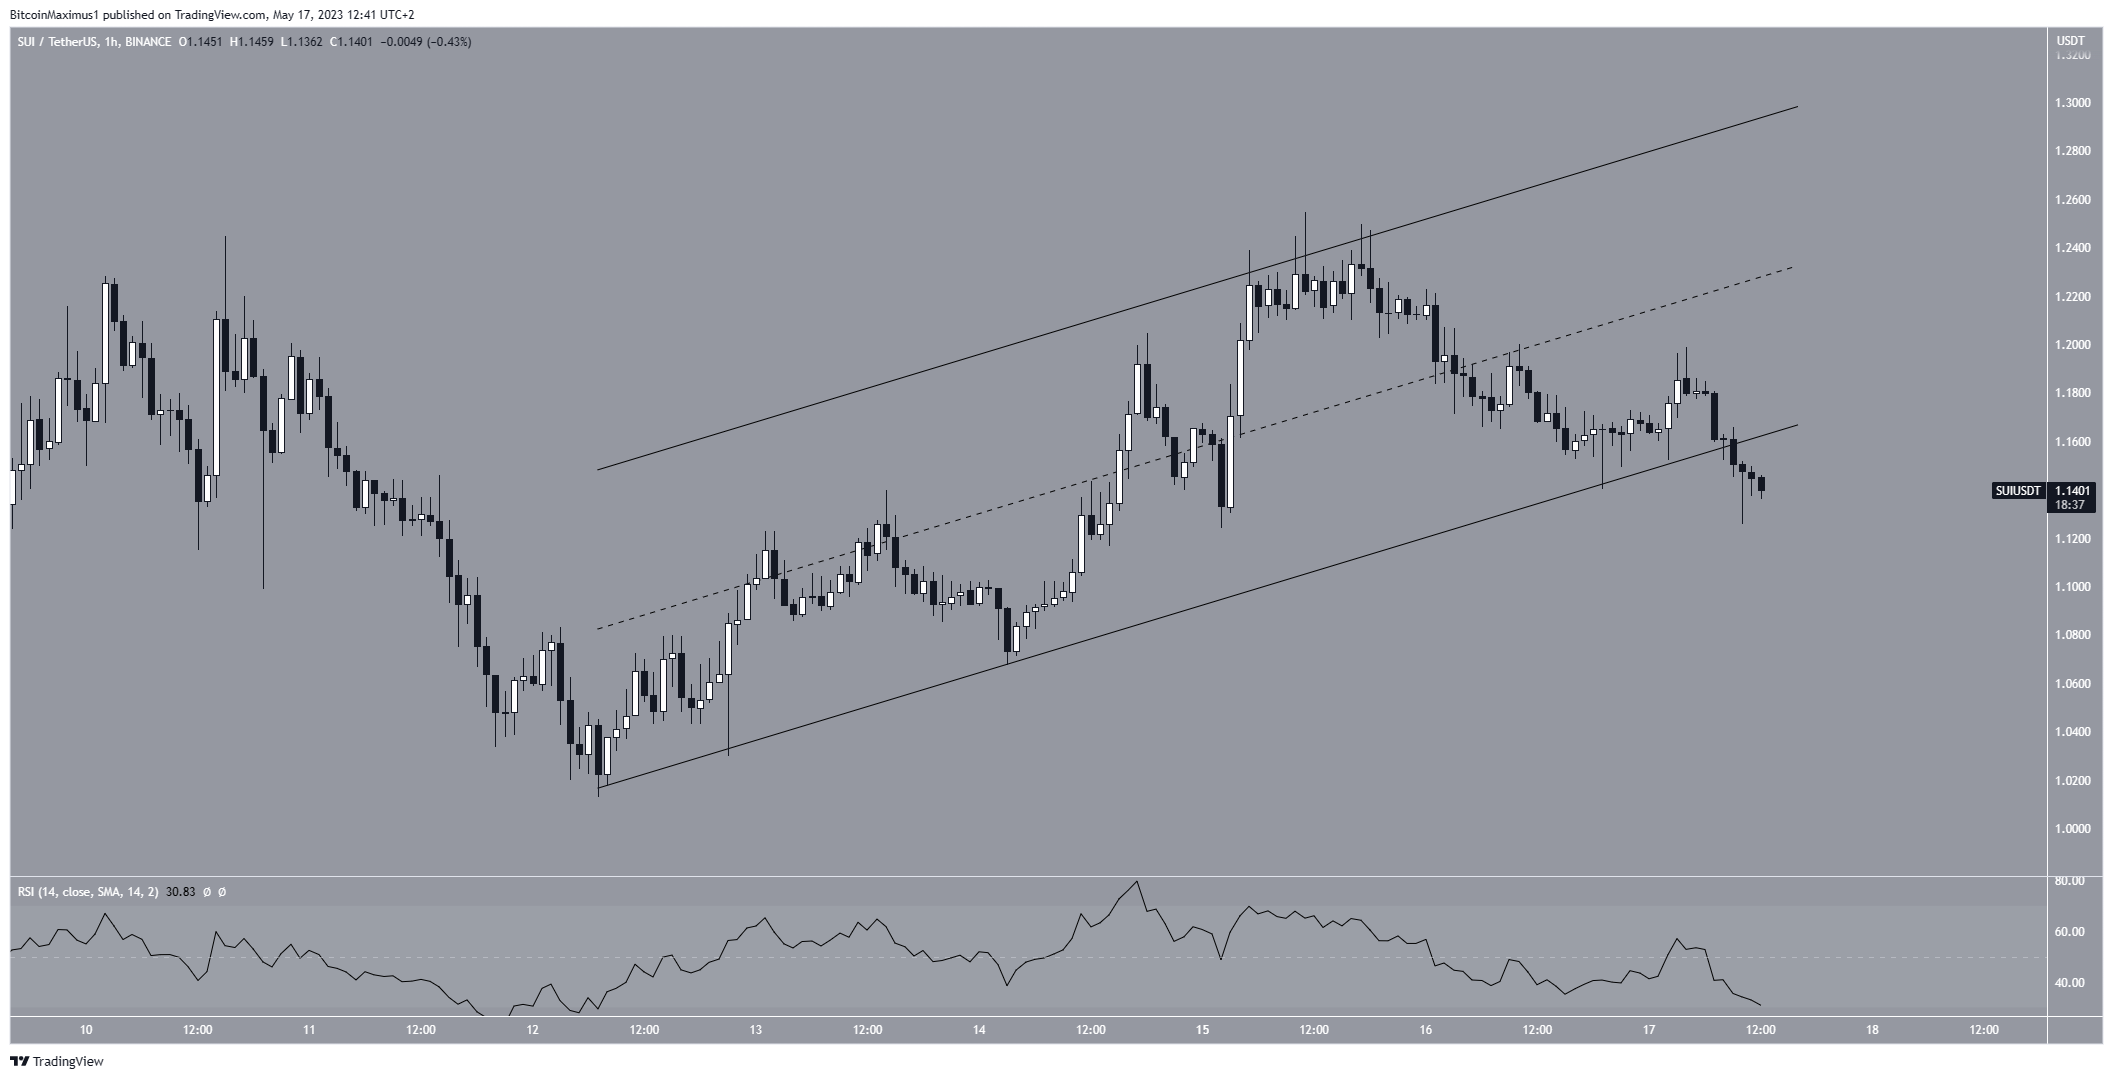
On the other hand, moving above the channel’s support line will invalidate the short-term bearish price forecast. In that case, an increase to the channel’s resistance line at $1.30 will be expected.
Since this would cause a breakout from the long-term resistance, it could accelerate the rate of increase.


