
The Stratis price has been accumulating since August 2019. Its price action is possibly following the Wyckoff distribution schematic.
Stratis Highlights
- STRAT has been accumulating since August 19, 2019.
- Daily moving averages support a price increase.
- The price is trading inside a short-term ascending channel.
- Price targets are given at 8800 & 11,200 satoshis.
Full-time trader @CryptoMichNL tweeted a Stratis price chart with the short caption “wonderful bounce”. Indeed, the price bounced on February 9 and has been moving upwards since. He gave targets of 5200 and 6200 satoshis for the future movement.
Wonderful bounce. pic.twitter.com/0vgrcVJa6V
— Michaël van de Poppe (@CryptoMichNL) February 11, 2020
Where will this bounce lead the price towards? Continue reading below if you want to find out.
Accumulation
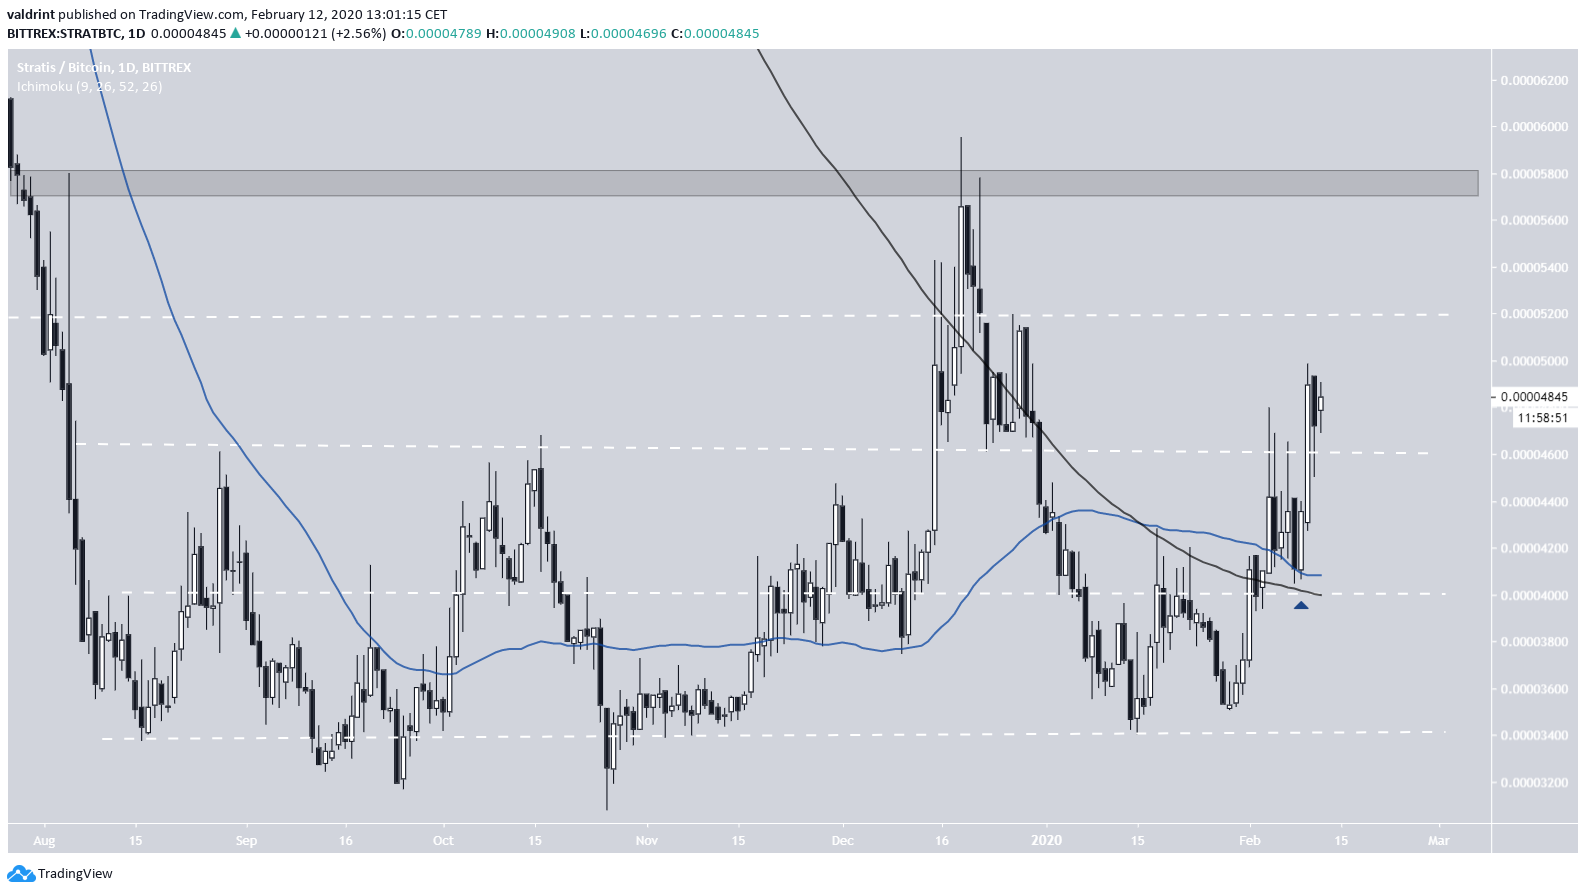
The Stratis price has been accumulating inside a range between 3200-5800 satoshis since the beginning of August 2019. The minor support areas inside this range have been present in increments of 600 satoshis, being at 3400, 4000, 3600 and 5200 satoshis, respectively.
The price is currently heading towards the range highs. The relationship between the price and its daily moving averages (MA) suggests that STRAT will reach this high.
STRAT is trading above its 50- and 200-day MAs, which have previously made a bullish cross. The “Wonderful bounce” outlined in the tweet happened near 4000 satoshis, right at the confluence of these two MAs. During this bounce, the STRAT price confirmed the use of the MAs as support.
Wyckoff Distribution
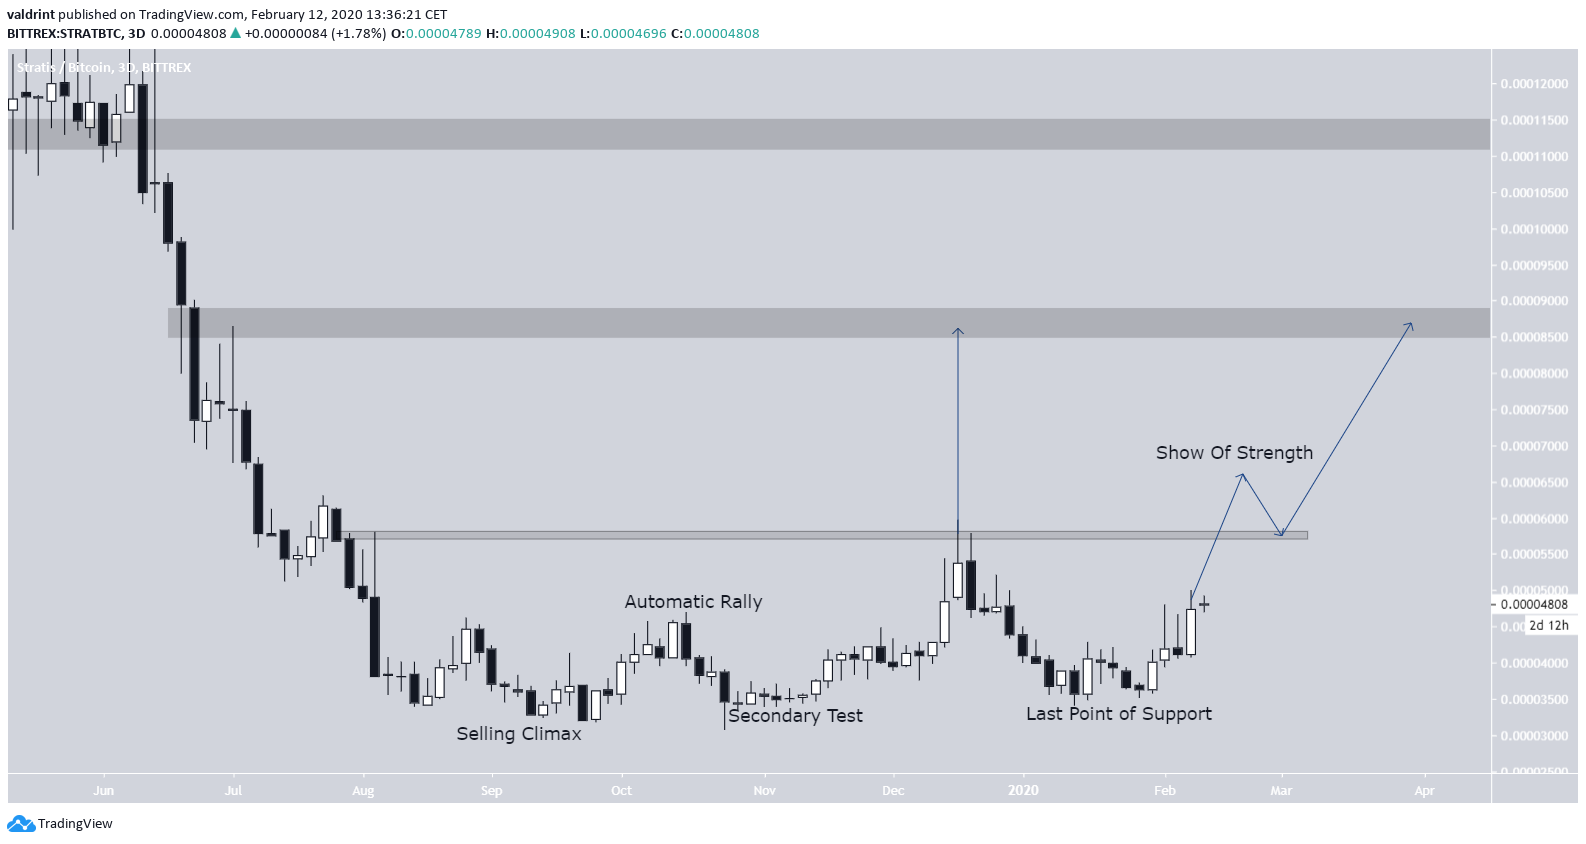
The accumulation phase and movement inside it can be explained by the Wyckoff distribution.
After the selling pressure peaked at the “selling climax”, the price retested the same level shortly afterward. The previously mentioned bounce could have been the “Last point of support”.
We will have confirmation that this distribution is completed if the price breaks out above the 580 satoshi resistance area and validates it as support afterward. This movement is known as the “Show of Strength”.
Then, the next closest resistance areas are found at 880 and 1100 satoshis. A breakout that travels the entire height of the current trading range would take the price to the former.
Stratis Ascending Channel
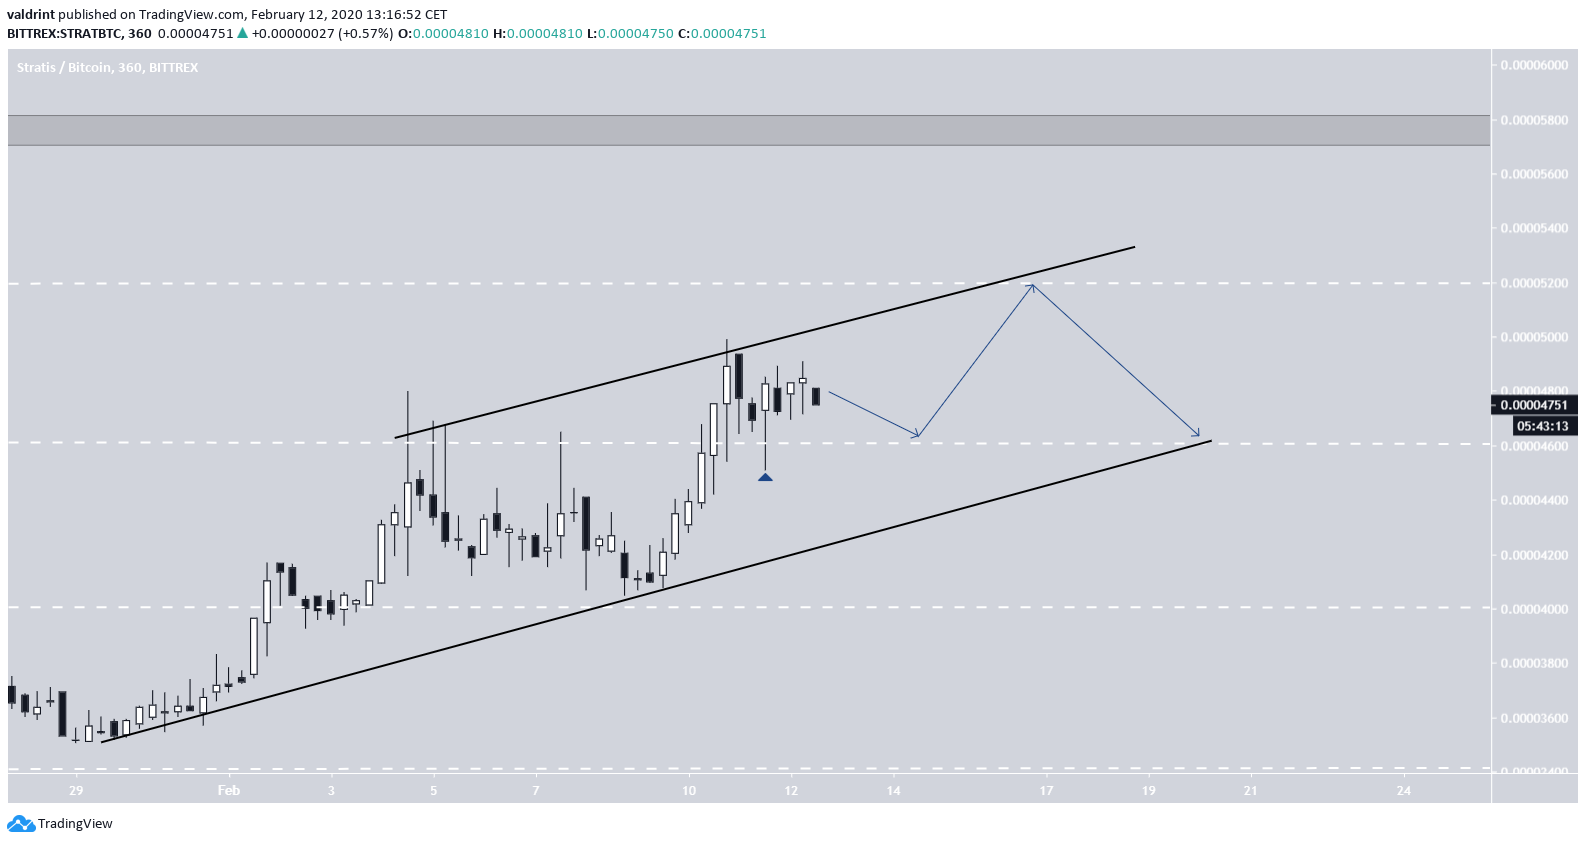
In the shorter-term, it seems that the price is trading inside an ascending channel. The bullish hammer candlestick (blue arrow) served to validate the 4600 satoshi area as support.
So, continuing the trend of gradual increases, we would expect this area to hold until the support line catches up. So, the price could increase all the way to 5200 satoshis before decreasing to support.
Determining by the confluence of the ascending support/resistance lines and the previously mentioned minor support/resistance areas the price could reach 5200 by February 16 and 4600 by February 18.
To conclude, the Stratis price is possibly accumulating following the Wyckoff distribution method. The price is expected to eventually break out from its range and head towards the resistance areas outlined above.
However, its movement inside the current range has been gradual, so as long as the price remains within the short-term ascending channel, we are expecting them to remain so.
