![Stellar’s Lack of Volume Is Concerning for Future Price Movement [Premium Analysis]](/_mfes/post/_next/image/?url=https%3A%2F%2Fassets.beincrypto.com%2Fimg%2FVji-jBTuJqC1RZmecIR0hH4sI1g%3D%2Fsmart%2F9abf553ec66e435c8aaa6ef611705a3c&w=1920&q=75)
On December 16, the XLM price broke down from its trading pattern and has reached a significant support area. An upward bounce is expected to follow — preventing the price from breaking down below the support area.
While the Stellar foundation has given a positive outlook for 2019, listing the significant increase in Stellar accounts, tier-one validations and the initiation of the first “Stellar Meridian” conference, the price action has not been as favorable. The XLM/USD price has decreased by 60 percent, while the XLM/BTC pair has fared even worse, decreasing by 80 percent.
73% increase in #Stellar accounts
5-fold increase in Tier 1 validators
First-ever #StellarMeridian conferenceThese are a few of our favorite things from 2019. @DenelleDixon highlights an incredible year and an exciting 2020 for SDF and #blockchain:https://t.co/OdjDavfxK6 pic.twitter.com/TTGBBskwBn
— Stellar (@StellarOrg) December 20, 2019
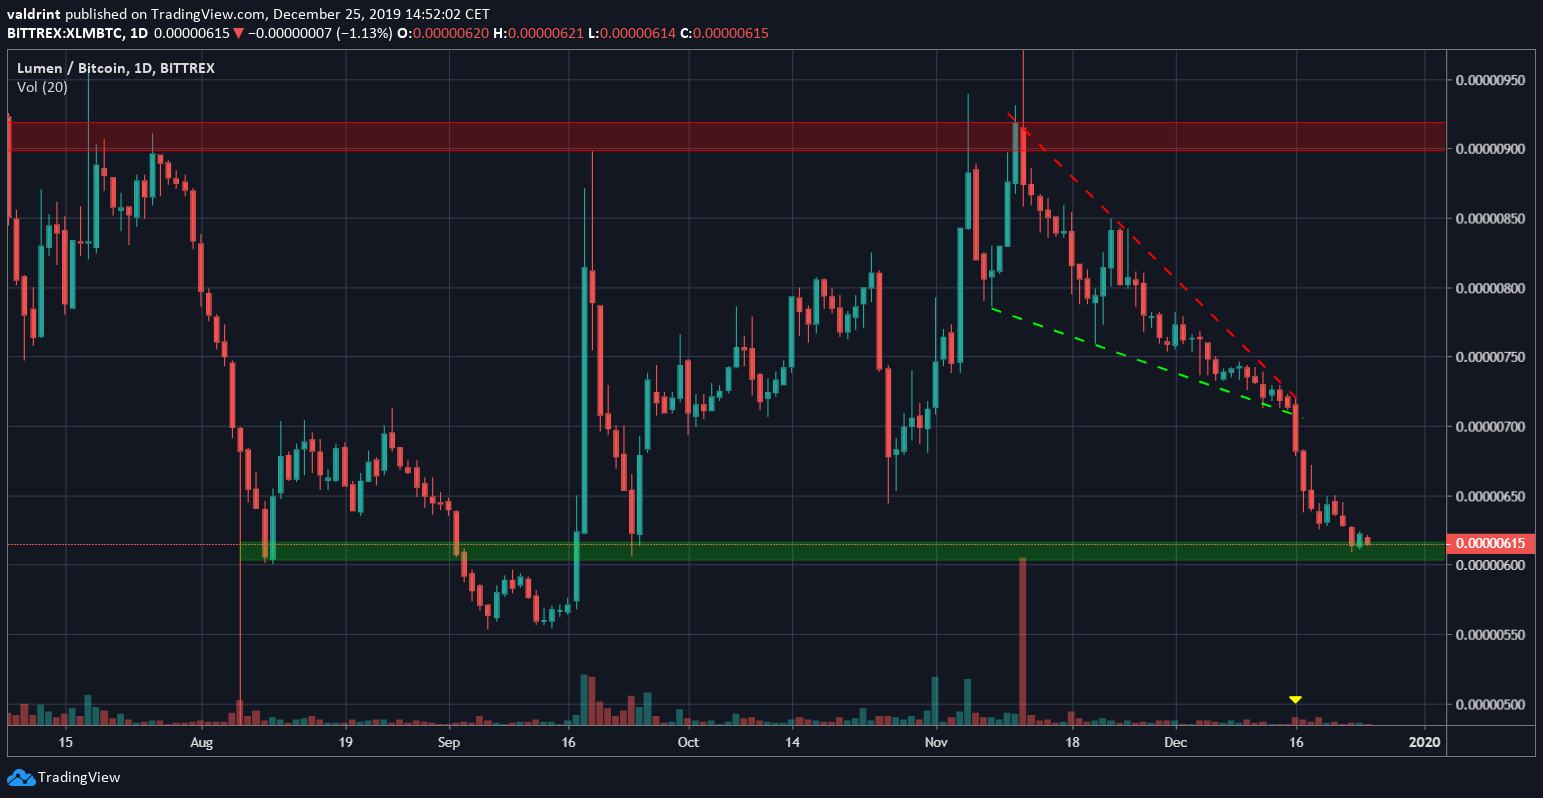
It’s short-term price movement was outlined perfectly by the institutional trader and analyst WenBenko, who stated that the XLM price has been trading inside a descending wedge since November. While it is approaching a strong support area and is nearing the end of the wedge, it needs to have more volume in order to initiate a decisive move.
https://twitter.com/WenBenko/status/1206472632838705152
Since the tweet, the XLMprice has actually broken down below this descending wedge. Where will it go next? Keep reading below if you are interested in finding out.
Descending Wedge Breakdown
The XLM price had been decreasing since reaching a high of 931 satoshis on November 11. Afterwards, it began trading inside the outlined descending wedge, from which it broke down on December 16.
Currently, the XLM price is very close to reaching the 600-610 support area. A breakdown below this area would take the price to the September lows at 550 satoshis.
As stated in the tweet, the volume has been low, again discounting the volume which was recorded on the November 12 wick.
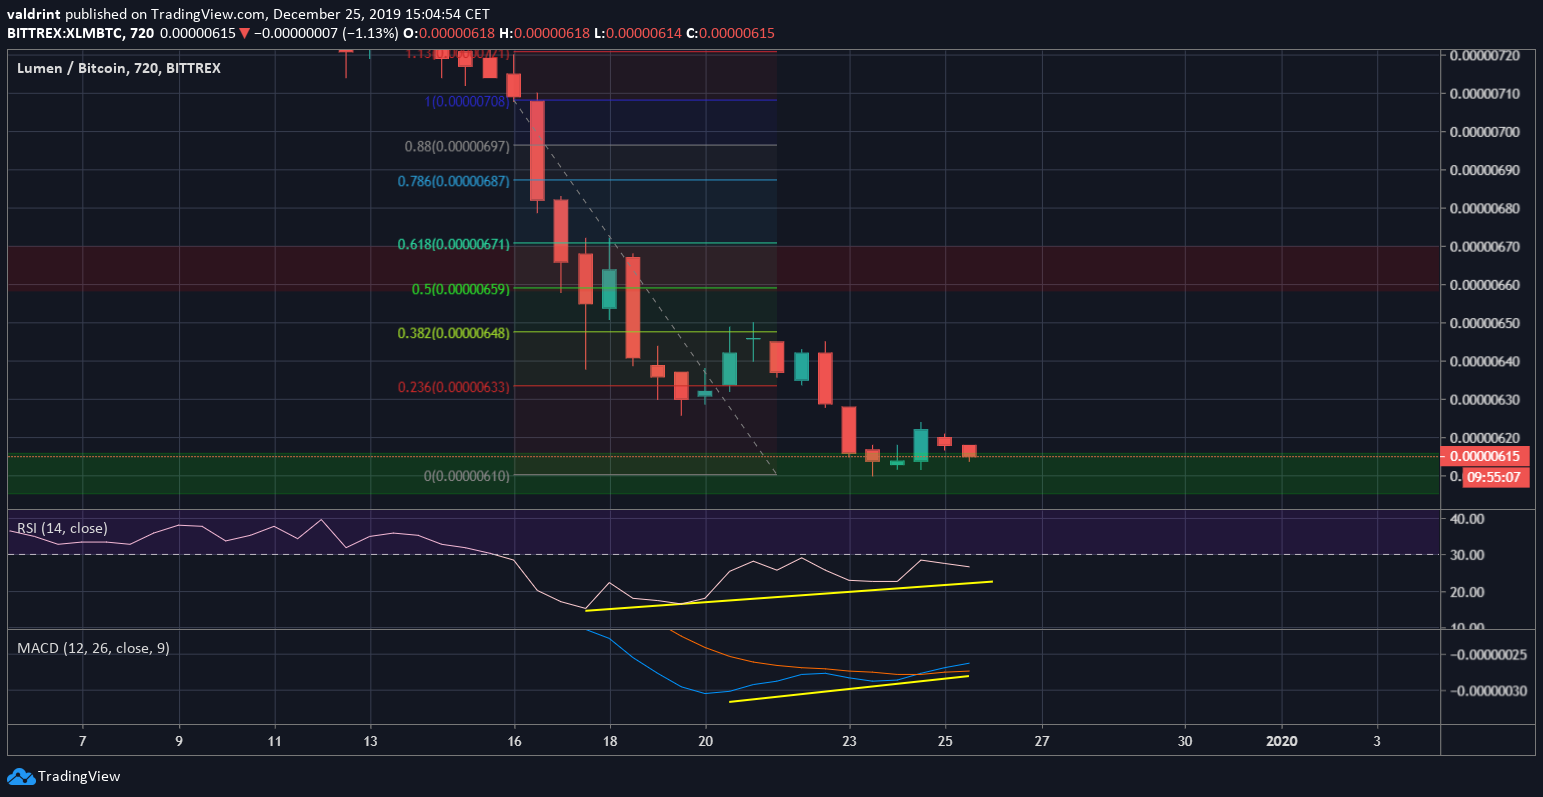
Looking closer at the movement, we can see that both the RSI & MACD have been generating bullish divergence, visible up to the daily time-frame.
Since this divergence is occurring inside a significant support area, we believe it will be sufficient in initiating an upward bounce. The target for this bounce is between 660-670 satoshis, found between the 0.5 and 0.618 Fib levels.
However, we need to look at a longer-term time-frame in order to determine whether this will be a retracement in response to the prior downward move or the beginning of a new upward trend.
Long-Term XLM Support
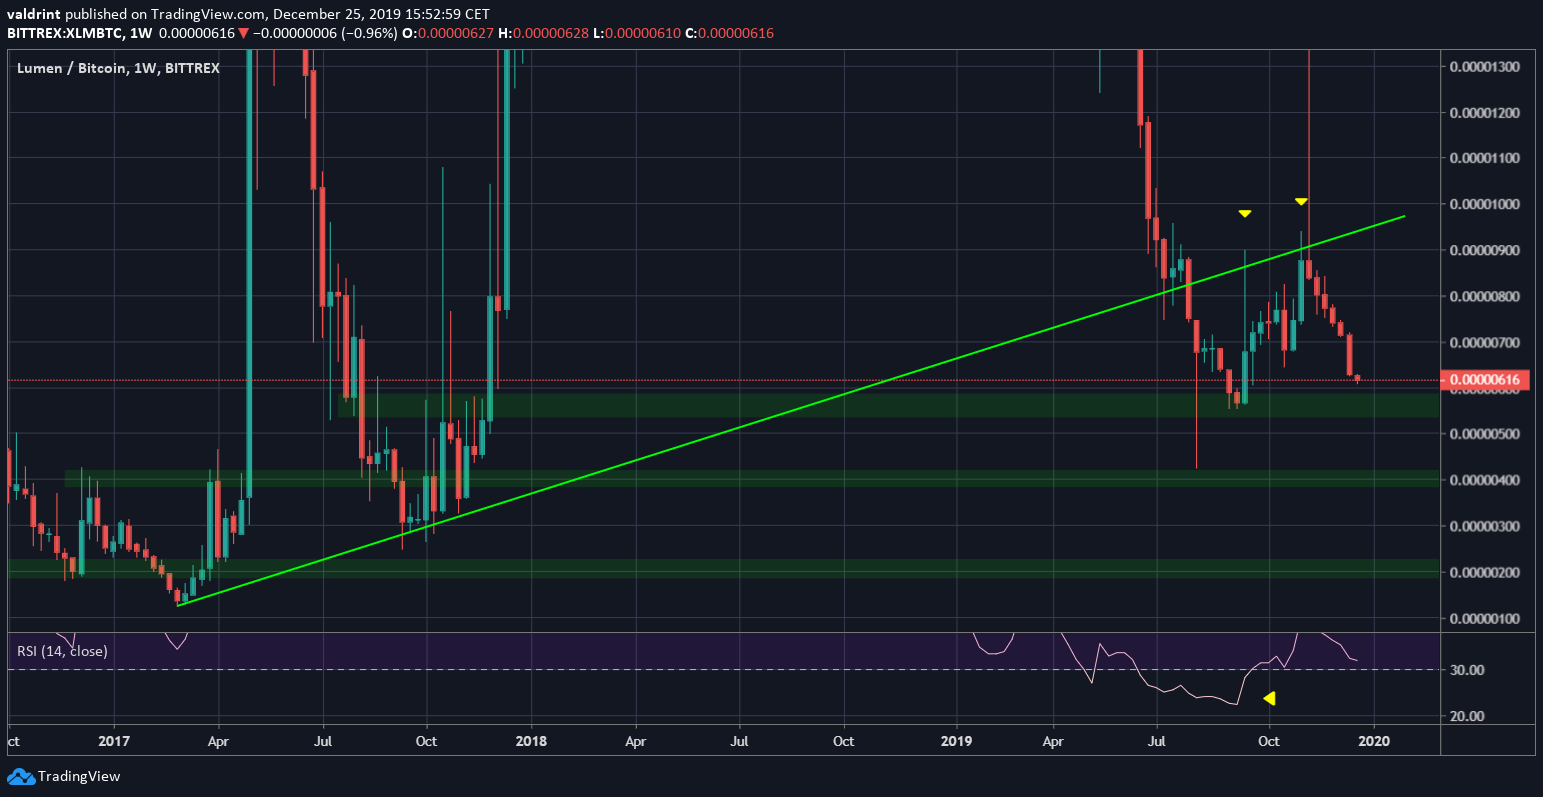
The XLM price had been following an ascending support line since March 2017. The price broke down in August 2019 and, afterward, retested it twice. We can see that the November 11 high validated the ascending support line.
The most likely scenario after such a movement is that the XLM price decreases towards the next support areas — which are found at 550, 400 and 200 satoshis, respectively.
However, the weekly RSI reached a low of 22 satoshis in September, the lowest value ever recorded. This suggests that the price is likely to begin a new market cycle. The possibility of this would be strengthened if the price makes a double bottom at 550 satoshis, combined with a bullish divergence in the RSI.
Future Movement
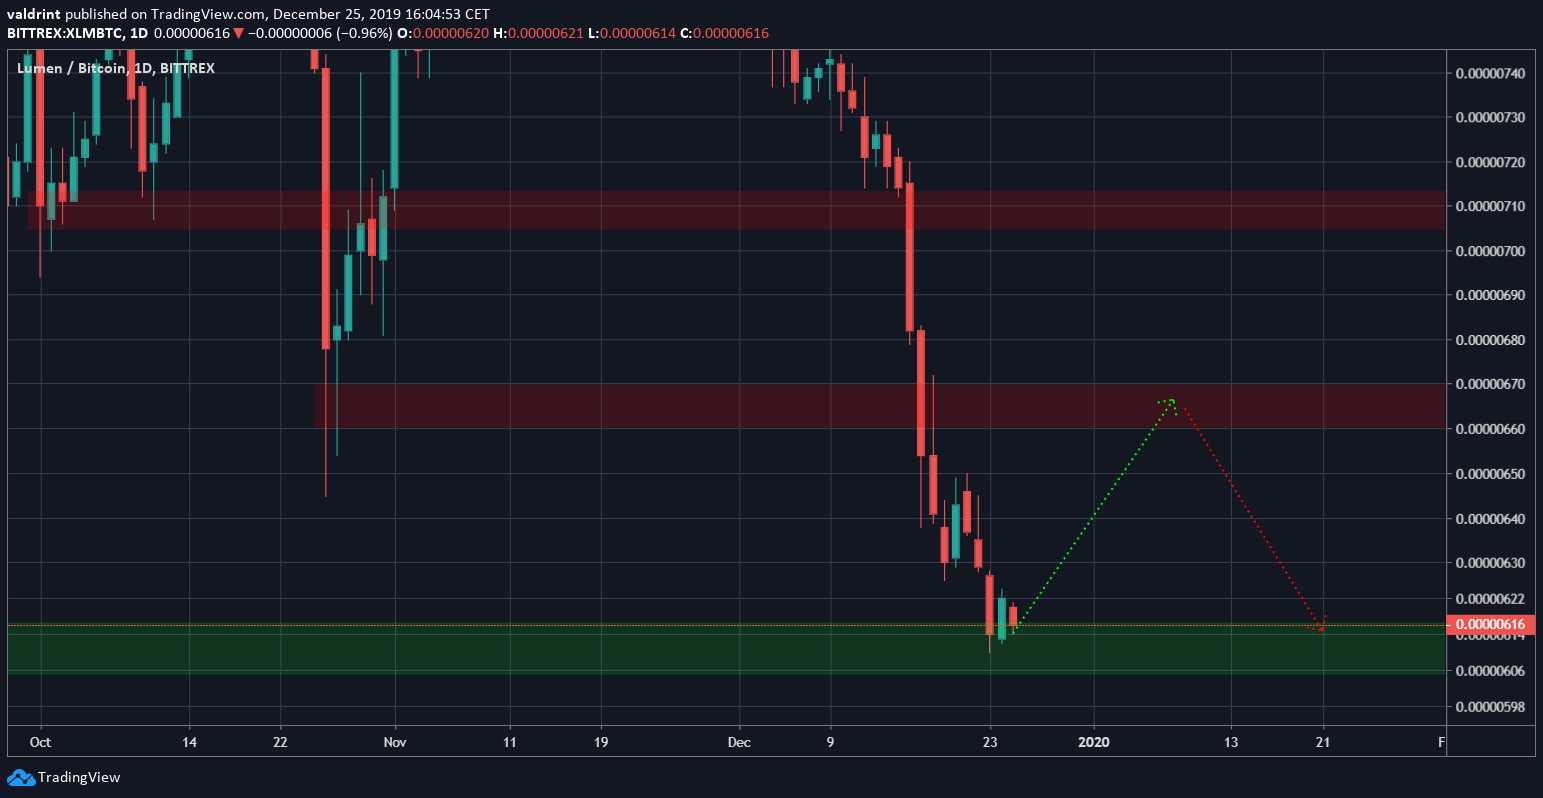
In lieu of the conflicting outlook from the weekly chart and the lack of volume, we believe the most likely move is a consolidation between the two outlined areas below. While it is possible that the bounce will go above the current resistance area and reach the breakdown level at 710, the first scenario seems more likely.
A decisive attack of the resistance area with a strong volume would make the second scenario more likely. In any case, we are expecting the price to consolidate.