


Despite a significant rally in 2021, the Stellar (XLM) price has yet to break out above the long-term $0.42 resistance area.
Due to ambiguity in both technical indicators and the wave count, it’s not yet clear if XLM has completed a correction and will now resume its upward momentum or if there’s another low ahead.
Long-Term Resistance
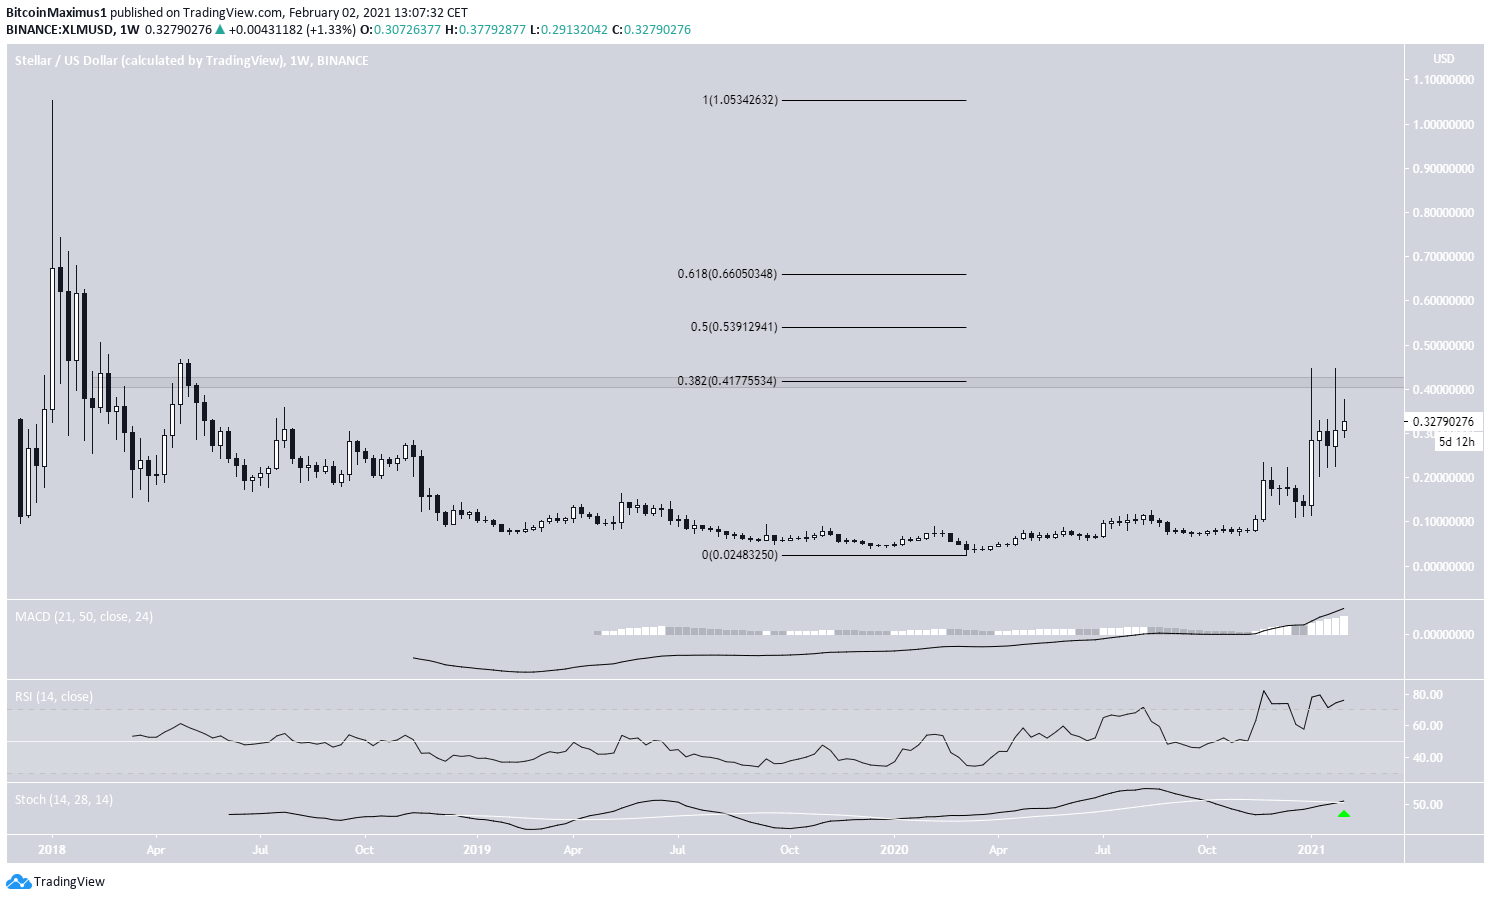
XLM has been moving upwards at an accelerated pace since the beginning of the year. In January alone, it twice touched a high near $0.45. However, it has failed to reach a weekly close above the 0.382 Fib retracement level resistance at $0.42.
If successful in doing so, the next closest resistance areas would be at $0.54 and $0.66, respectively, the 0.5 and 0.618 Fib retracement levels of the downward move measured from the all-time high price.
Technical indicators on the weekly time-frame are bullish, supporting the possibility of a continued upward move.
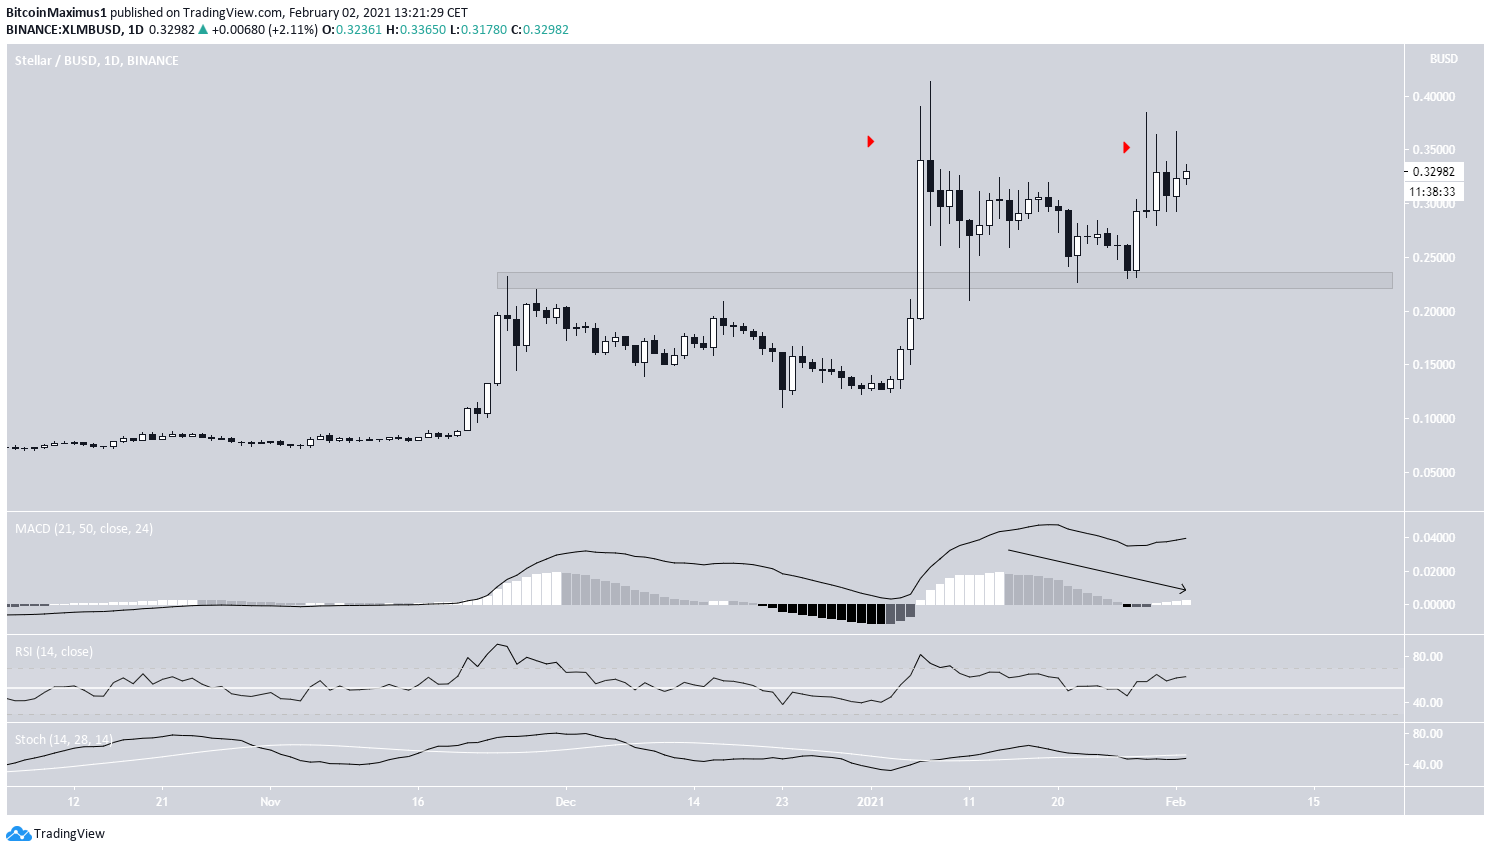
The daily chart provides mixed signs and does little to determine whether XLM will break out above the long-term $0.42 resistance area.
For the bearish case, it has created numerous long upper wicks, a sign of significant selling pressure. Furthermore, the MACD, RSI, and Stochastic Oscillator seem to have lost momentum.
However, the RSI is above 50, and the MACD is above 0, which are signs of a bullish trend. Furthermore, XLM has bounced several times at the $0.24 support area.
Therefore, the direction of the trend remains unclear. But the possibility of an upward continuation remains high as long as it’s trading above $0.24.
Wave Count
Cryptocurrency trader @TheTradingHubb outlined an XLM chart, stating that it has begun wave 5 of a bullish impulse and is likely an increase towards $0.055.
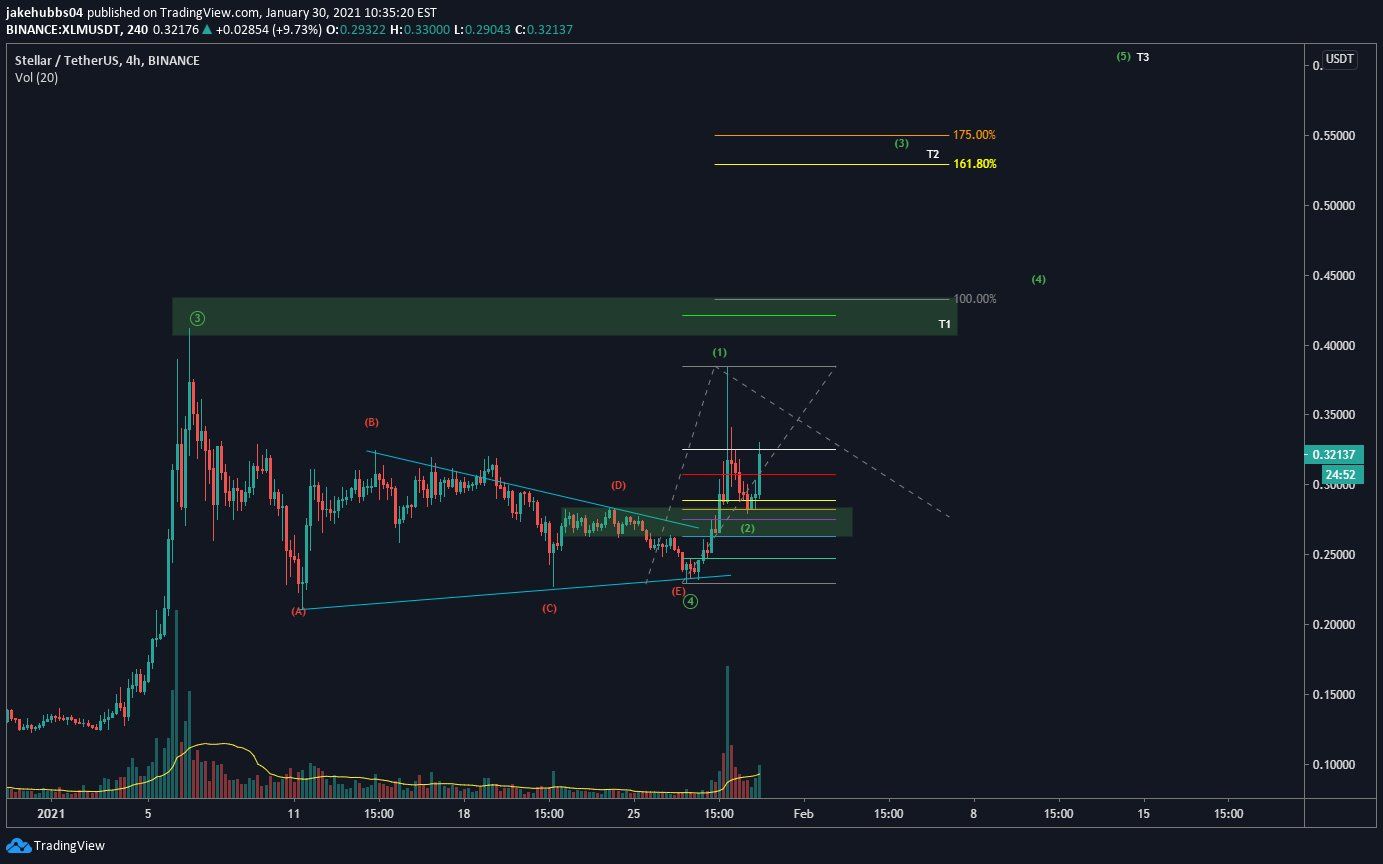
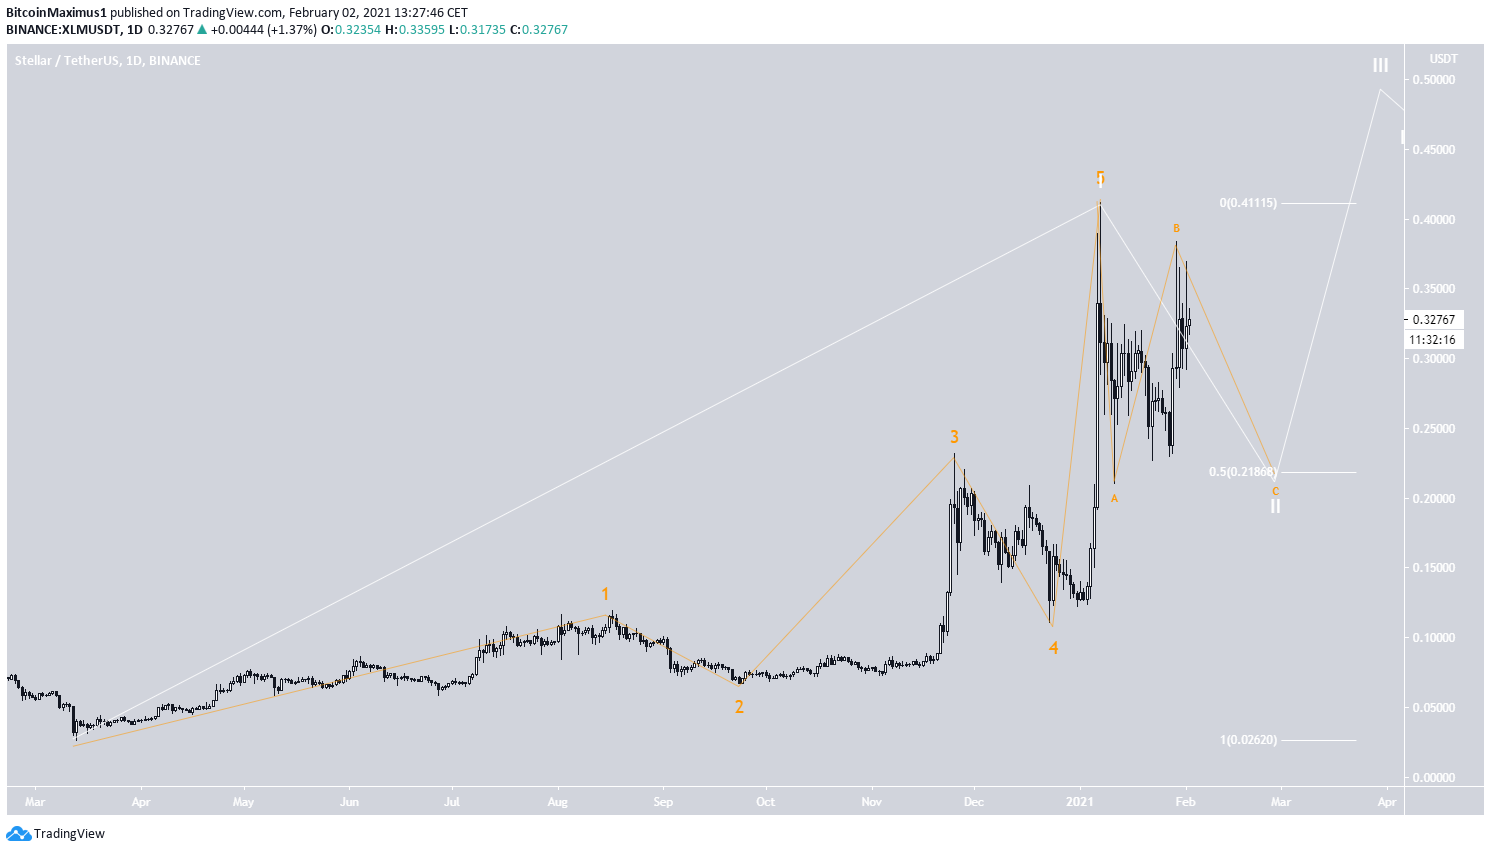
At the current time, several wave counts are still valid. While the bullish one presented in the tweet is certainly valid, it’s possible that the entire bullish impulse was a leading diagonal, and XLM is now correcting in what is wave 2 (shown in white below).
This and the ambiguity from technical indicators provides little clue to the direction of the trend. The sub-wave count is given in orange.
If XLM completes this bearish count, it’s likely to retest the $0.24 support once more and possibly drop to $0.21, the 0.5 Fib retracement level of the entire upward move.
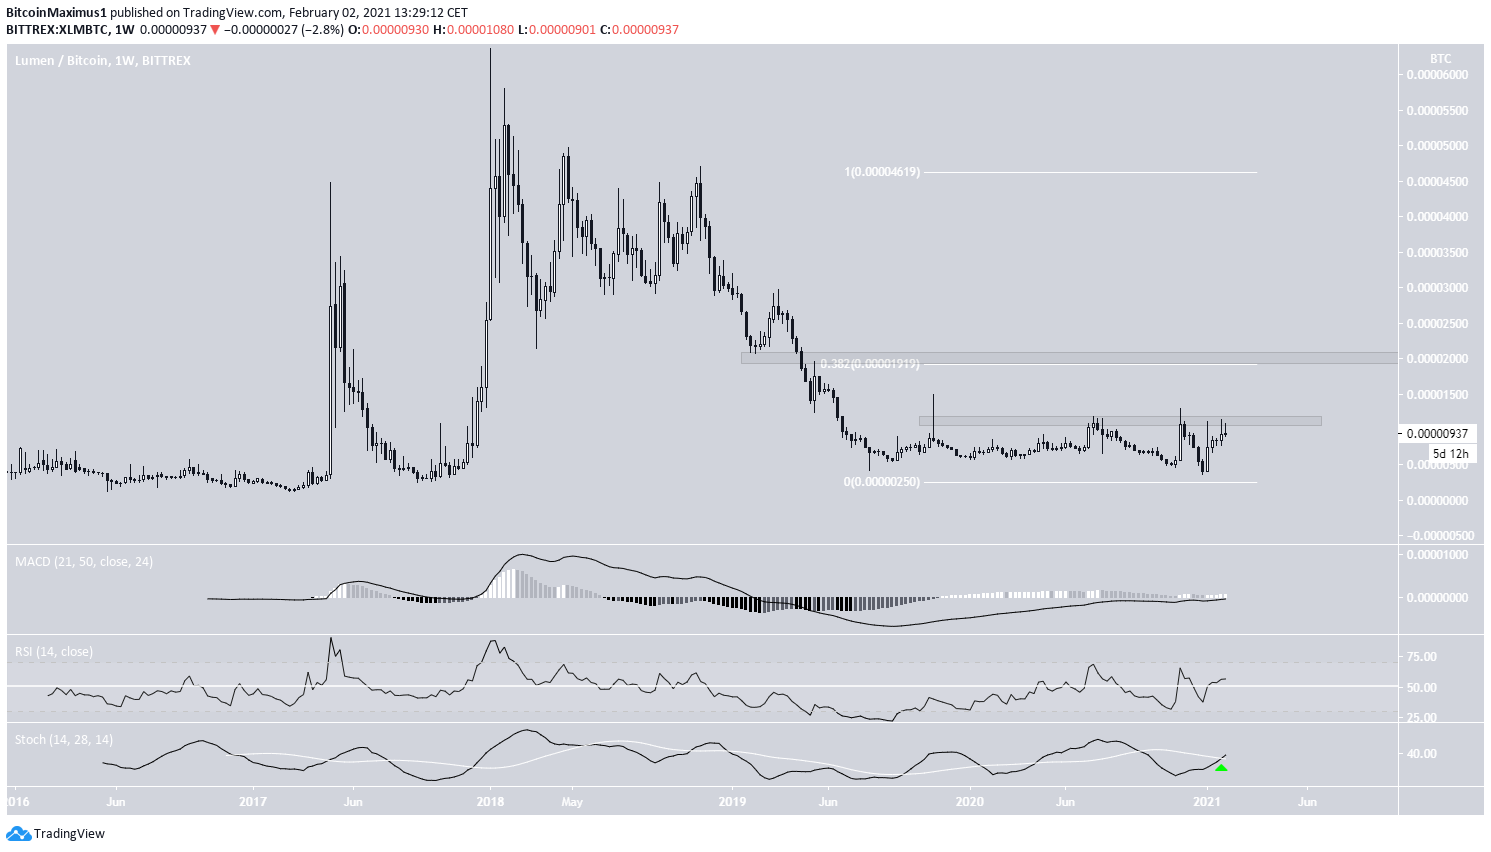
XLM/BTC
Similar to its USD counterpart, the weekly indicators for XLM/BTC are bullish and support the continuation of the upward movement.
However, XLM has been facing resistance at the 1,100 satoshi area since Dec. 2020, and the trend isn’t bullish until the area is reclaimed.
If that occurs, the next resistance would be at 2,000 satoshis, the 0.382 Fib retracement level of the most recent downward move.
Conclusion
To conclude, it’s not yet clear if XLM has completed its correction or if there is another low ahead. While technical indicators are bullish, both XLM/USD and XLM/BTC need to clear their respective resistance areas to confirm the bullish trend.
For BeInCrypto’s latest Bitcoin (BTC) analysis, click here


