


The Stellar Lumens (XLM) price has bounced at a long-term support area, but shows no bullish reversal signs.
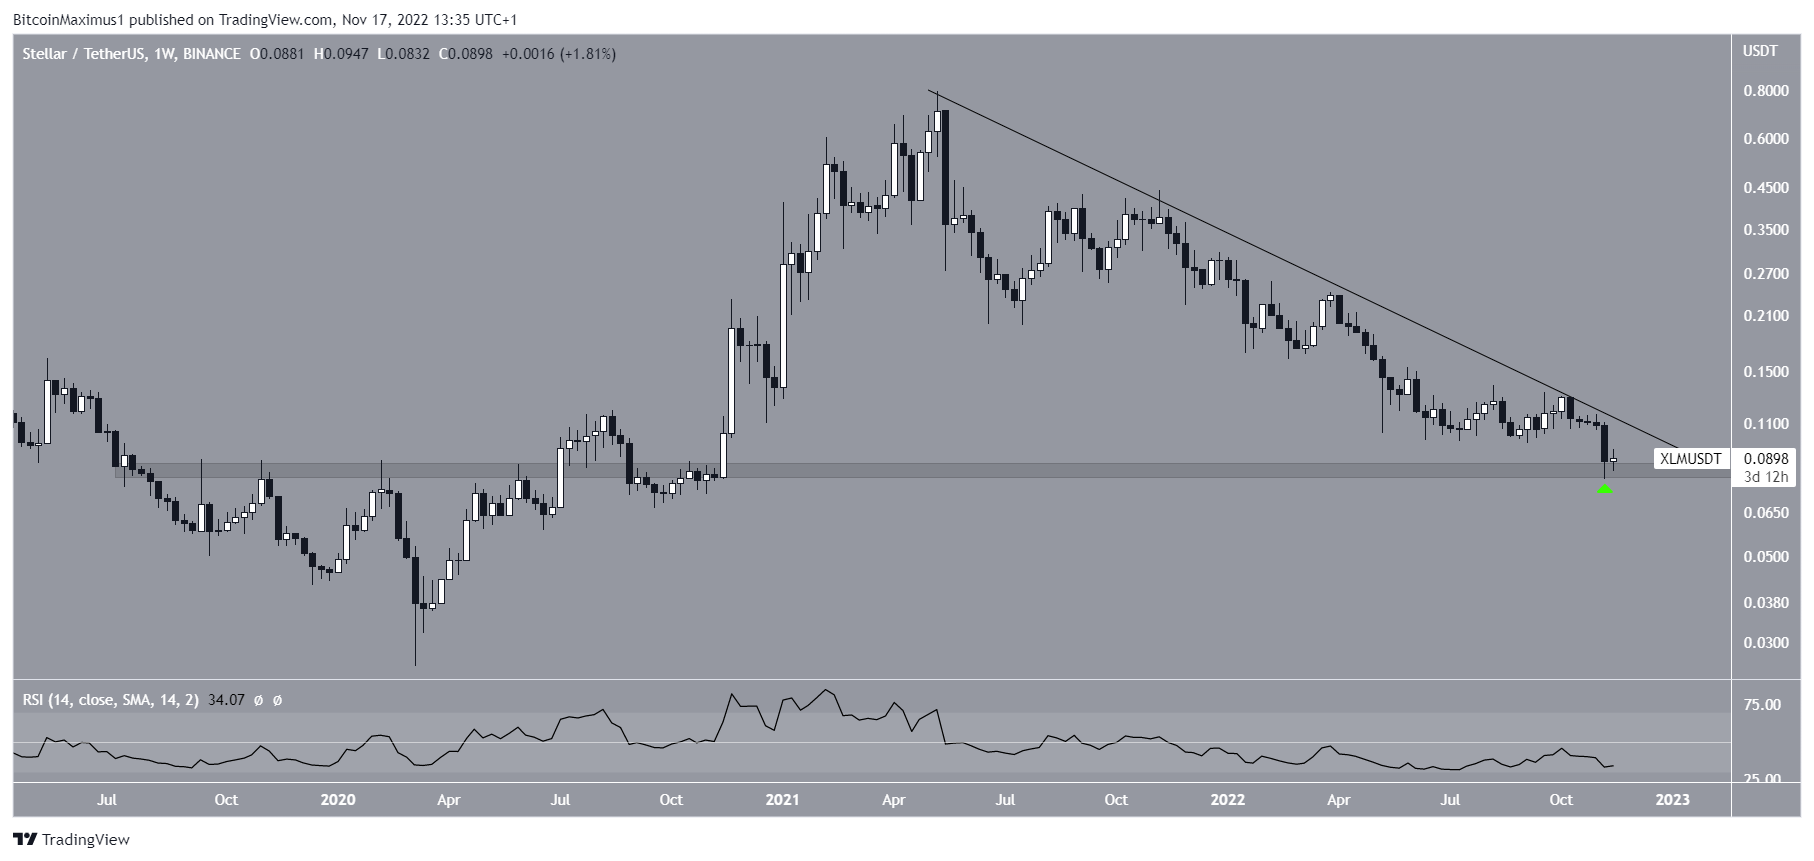
The XLM price has fallen below a descending resistance line since reaching an all-time high price of $0.798 in May 2021. The decrease led to a low of $0.079 in Nov. 2022. It accelerated during the week of November 7-13, even though no direct negative XLM news was preceding it. The low and ensuing bounce validated the $0.085 horizontal area as support (green icon).
Despite the bounce, the weekly RSI is still bearish. It is trading below 50 and has not generated any bearish divergence.
So, due to the lack of decisive signs, whether the XLM price breaks out from the resistance line or breaks down from the $0.085 support area will likely determine the XLM price prediction.
XLM Price Breakdown Leads to New Yearly Low
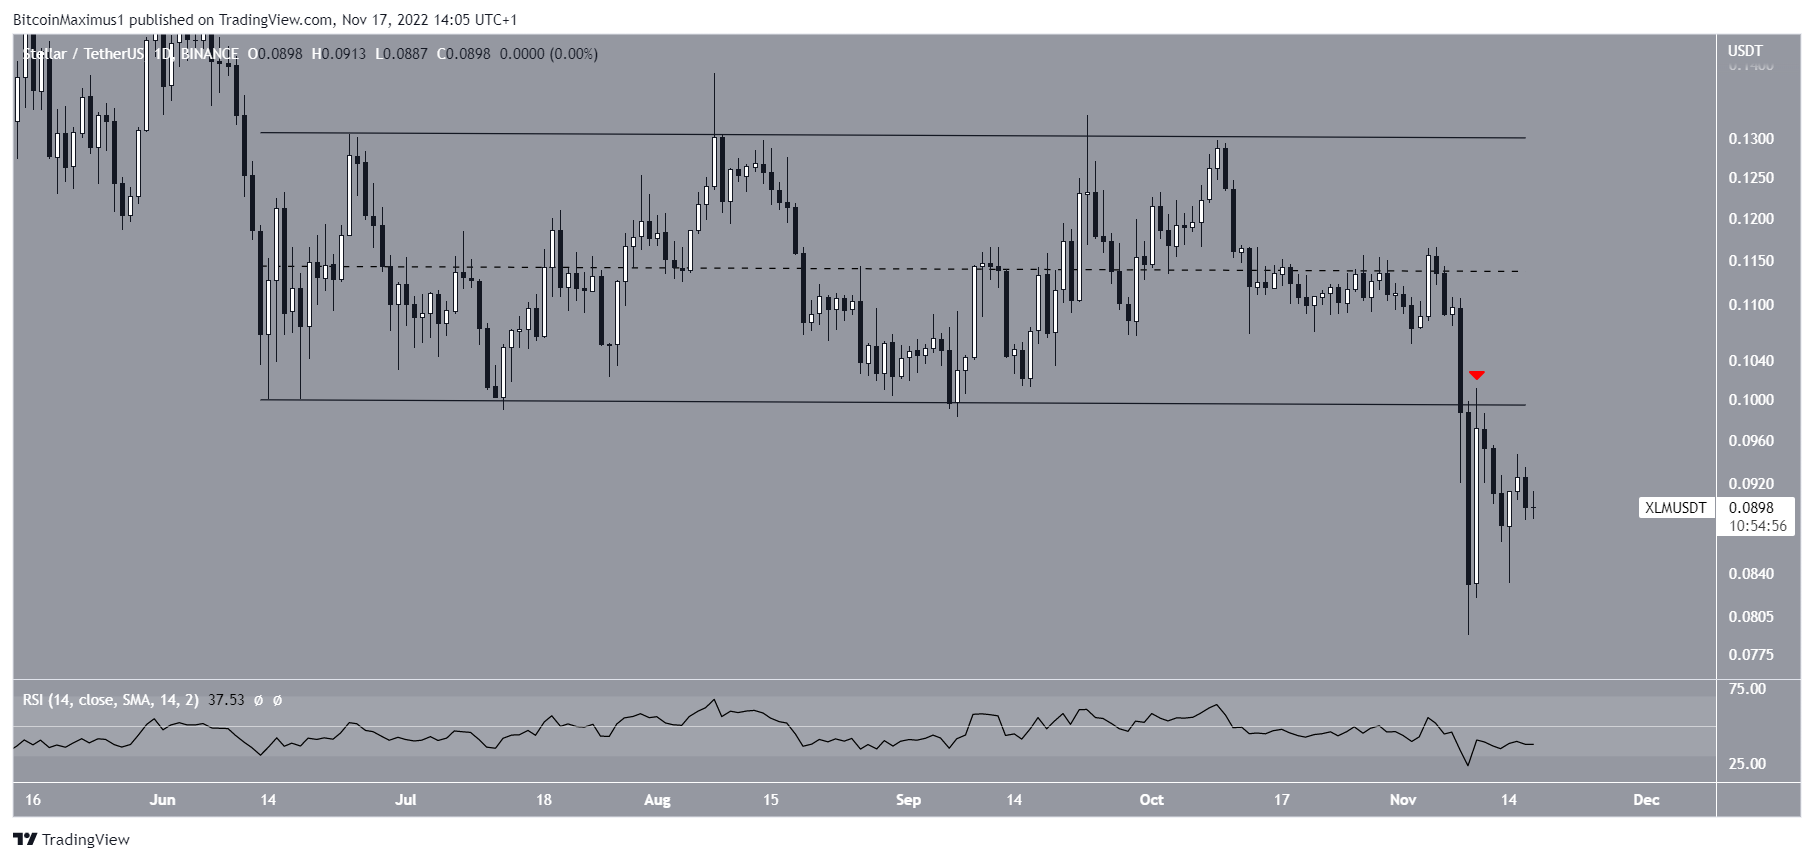
The technical analysis from the daily time frame shows that XLM broke down from a short-term horizontal channel on Nov. 8. It reached a new yearly low of $0.082 the next day.
Afterward, it bounced but was rejected by the channel’s support line (red icon). So, the line is now expected to provide resistance.
Similar to the weekly time frame, the daily RSI is trading below 50 and has yet to generate bullish divergence. As a result, the daily and weekly time frame readings both provide a bearish outlook for future prices.
Wave Count Suggests Bottom Is In
Even though the weekly and daily time frame outlook is bearish, the wave count suggests the bottom is in.
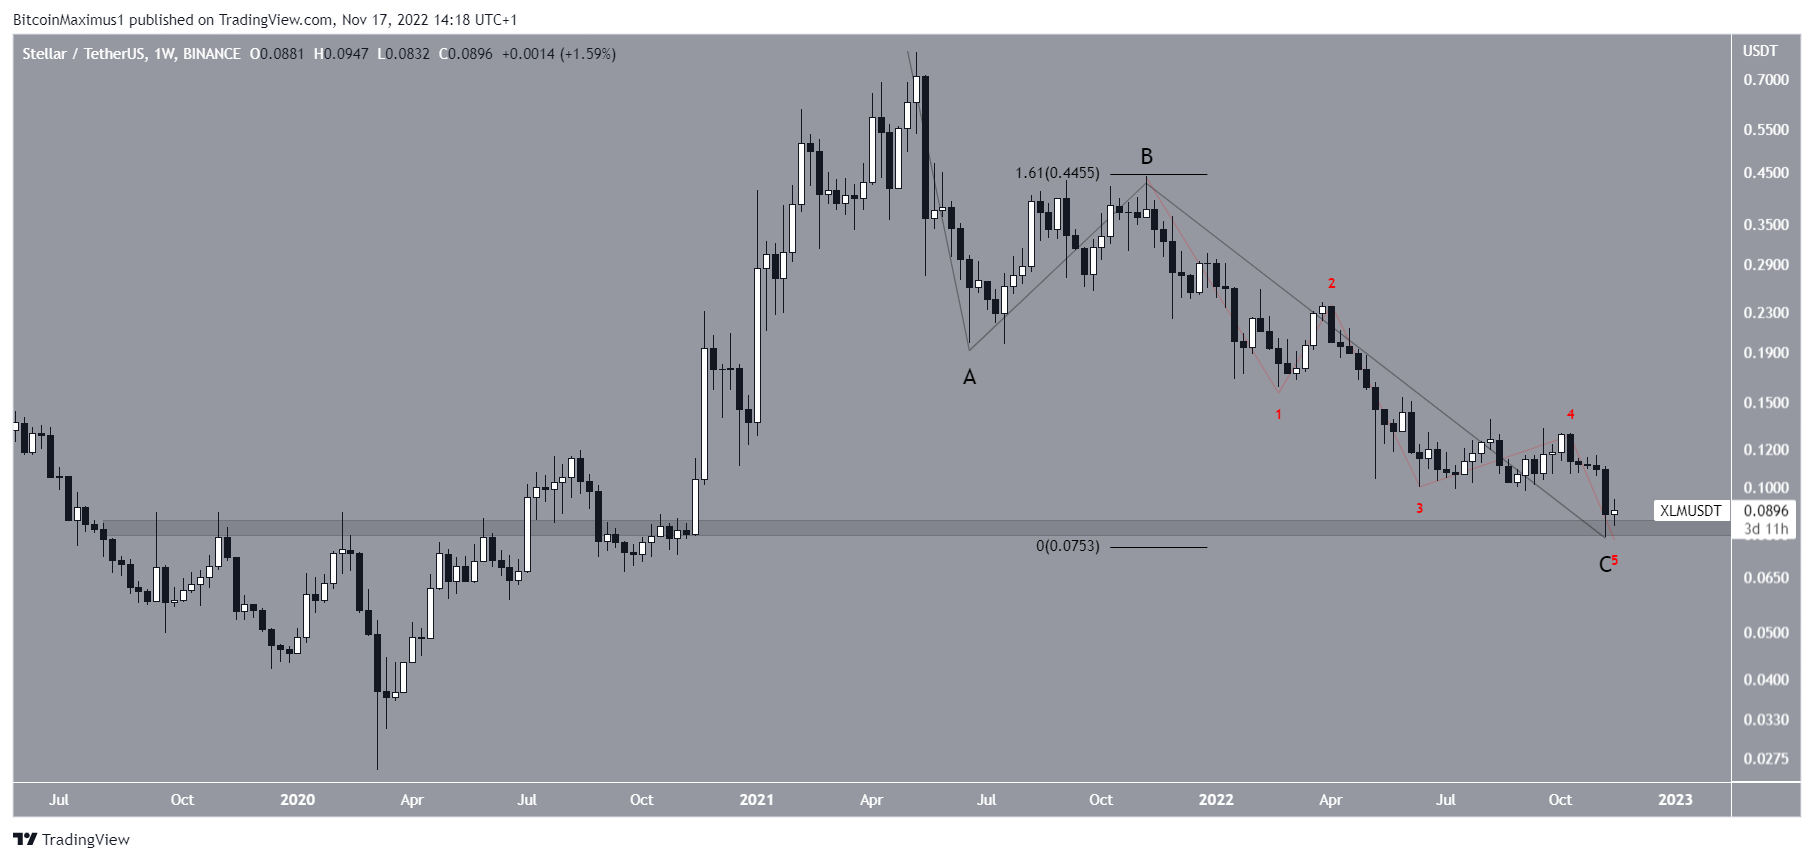
Since the all-time high, the XLM price might have completed an A-B-C corrective structure (black). The sub-wave count is given in red, suggesting that XLM has completed wave five.
Giving waves A:C a 1:1.61 ratio gives a price target near $0.075, coinciding with the current low and long-term horizontal support area.
Due to the mixed readings from the price action and wave count, whether the XLM price breaks down from the $0.085 support area or bounces will likely determine the direction of the future trend.
For BeInCrypto’s latest Bitcoin (BTC) analysis, click here.
Disclaimer: BeInCrypto strives to provide accurate and up-to-date information, but it will not be responsible for any missing facts or inaccurate information. You comply and understand that you should use any of this information at your own risk. Cryptocurrencies are highly volatile financial assets, so research and make your own financial decisions.


