

The Stellar (XLM) price is giving conflicting readings in different time frames. The resolution of its short-term pattern could determine the direction of the future trend.
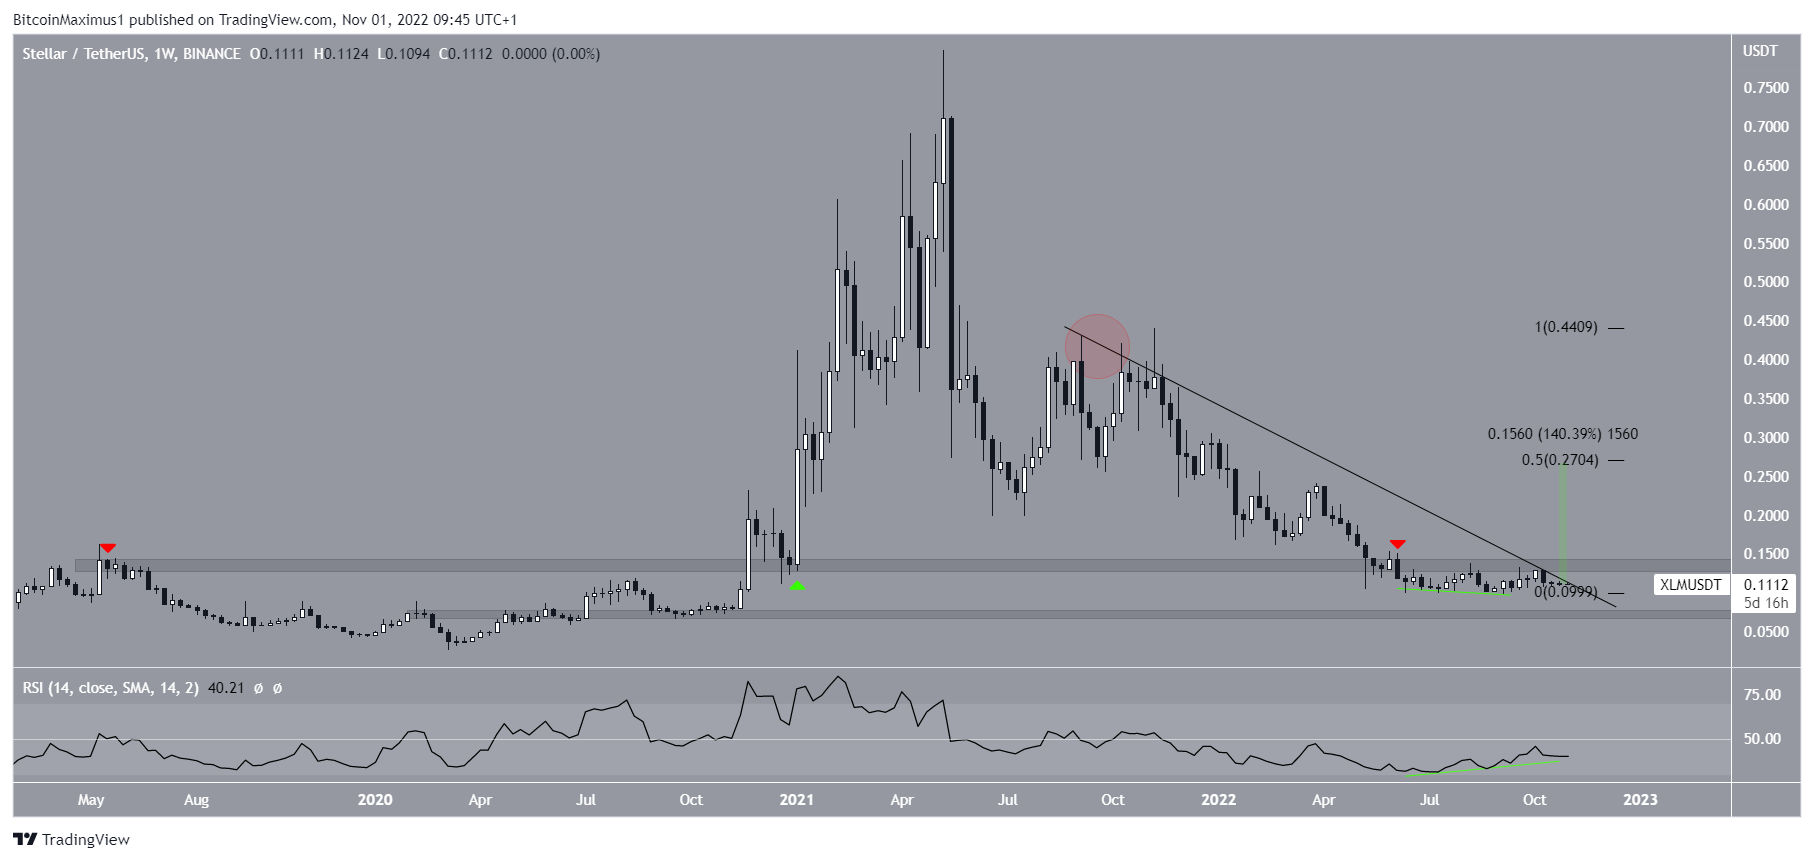
The XLM price has fallen since reaching an all-time high of $0.798 in May 2021. Since Sept. of the same year (red circle), it has fallen underneath a descending resistance line. The downward movement has led to a low of $0.098 in Sept. 2022.
Throughout this decrease, XLM also broke down from the $0.135 horizontal area (red icon). This is a crucial horizontal level since it has intermittently acted as both resistance and support (green icon) since May 2019. The area is expected to act as resistance once more and coincides with the aforementioned descending resistance line.
As a result, a XLM price breakout above it is required in order for the trend to be considered bullish.
The weekly RSI supports this possibility since it has generated bullish divergence (green line). However, the price action is not bullish since a breakout has not occurred yet.
If one occurs, the rate of increase would be expected to accelerate since there is no resistance until $0.27. Measuring from the current price, this would be an increase of 140%.
Conversely, if the downward movement continues, the Stellar price could decrease to $0.075.
Stellar Price Trades in Neutral Short-Term Pattern
Despite the bullishness from the weekly time frame, the daily price action is neutral.
Firstly, the XLM price has been following a descending resistance line since May 11. The line has been validated five times (red icons), increasing its legitimacy.
Since the beginning of Sept. the price has been following an ascending support line. Combined, these two lines create a symmetrical triangle, considered a neutral pattern.
Additionally, the daily RSI is moving freely above and below 50, a sign of a neutral trend. Furthermore, there has barely been any movement over the past 24 hours.
As a result of these readings, whether the Stellar price breaks out or down from the triangle will likely determine the direction of the future trend.

Wave Count Could Help Determine Future Trend
Since the weekly and daily time frames are not in agreement, a look at the wave count could settle the tie.
Measuring from the all-time high, it seems that XLM is completing an A-B-C corrective structure (black). The sub-wave count is given in red. Due to the presence of the triangle, the XLM price is possibly in wave four of this five-wave decrease.
Giving waves A:C a 1:1.61 ratio would lead to a low near $0.075, coinciding with the previously outlined long-term horizontal support area.
However, there is no alignment between readings from different timeframes or the wave count. As a result, the trend is still unclear, and both a reversal and continuation of the downward movement could occur.
Whether the Stellar price breaks out or down from the triangle could help determine which will occur.

For the latest BeInCrypto Bitcoin (BTC) and crypto market analysis, click here
Disclaimer: BeInCrypto strives to provide accurate and up-to-date information, but it will not be responsible for any missing facts or inaccurate information. You comply and understand that you should use any of this information at your own risk. Cryptocurrencies are highly volatile financial assets, so research and make your own financial decisions.
Disclaimer
In line with the Trust Project guidelines, this price analysis article is for informational purposes only and should not be considered financial or investment advice. BeInCrypto is committed to accurate, unbiased reporting, but market conditions are subject to change without notice. Always conduct your own research and consult with a professional before making any financial decisions. Please note that our Terms and Conditions, Privacy Policy, and Disclaimers have been updated.
