


The Stellar (XLM) price could soon break out from its short-term pattern and reach the $0.102 long-term resistance area.
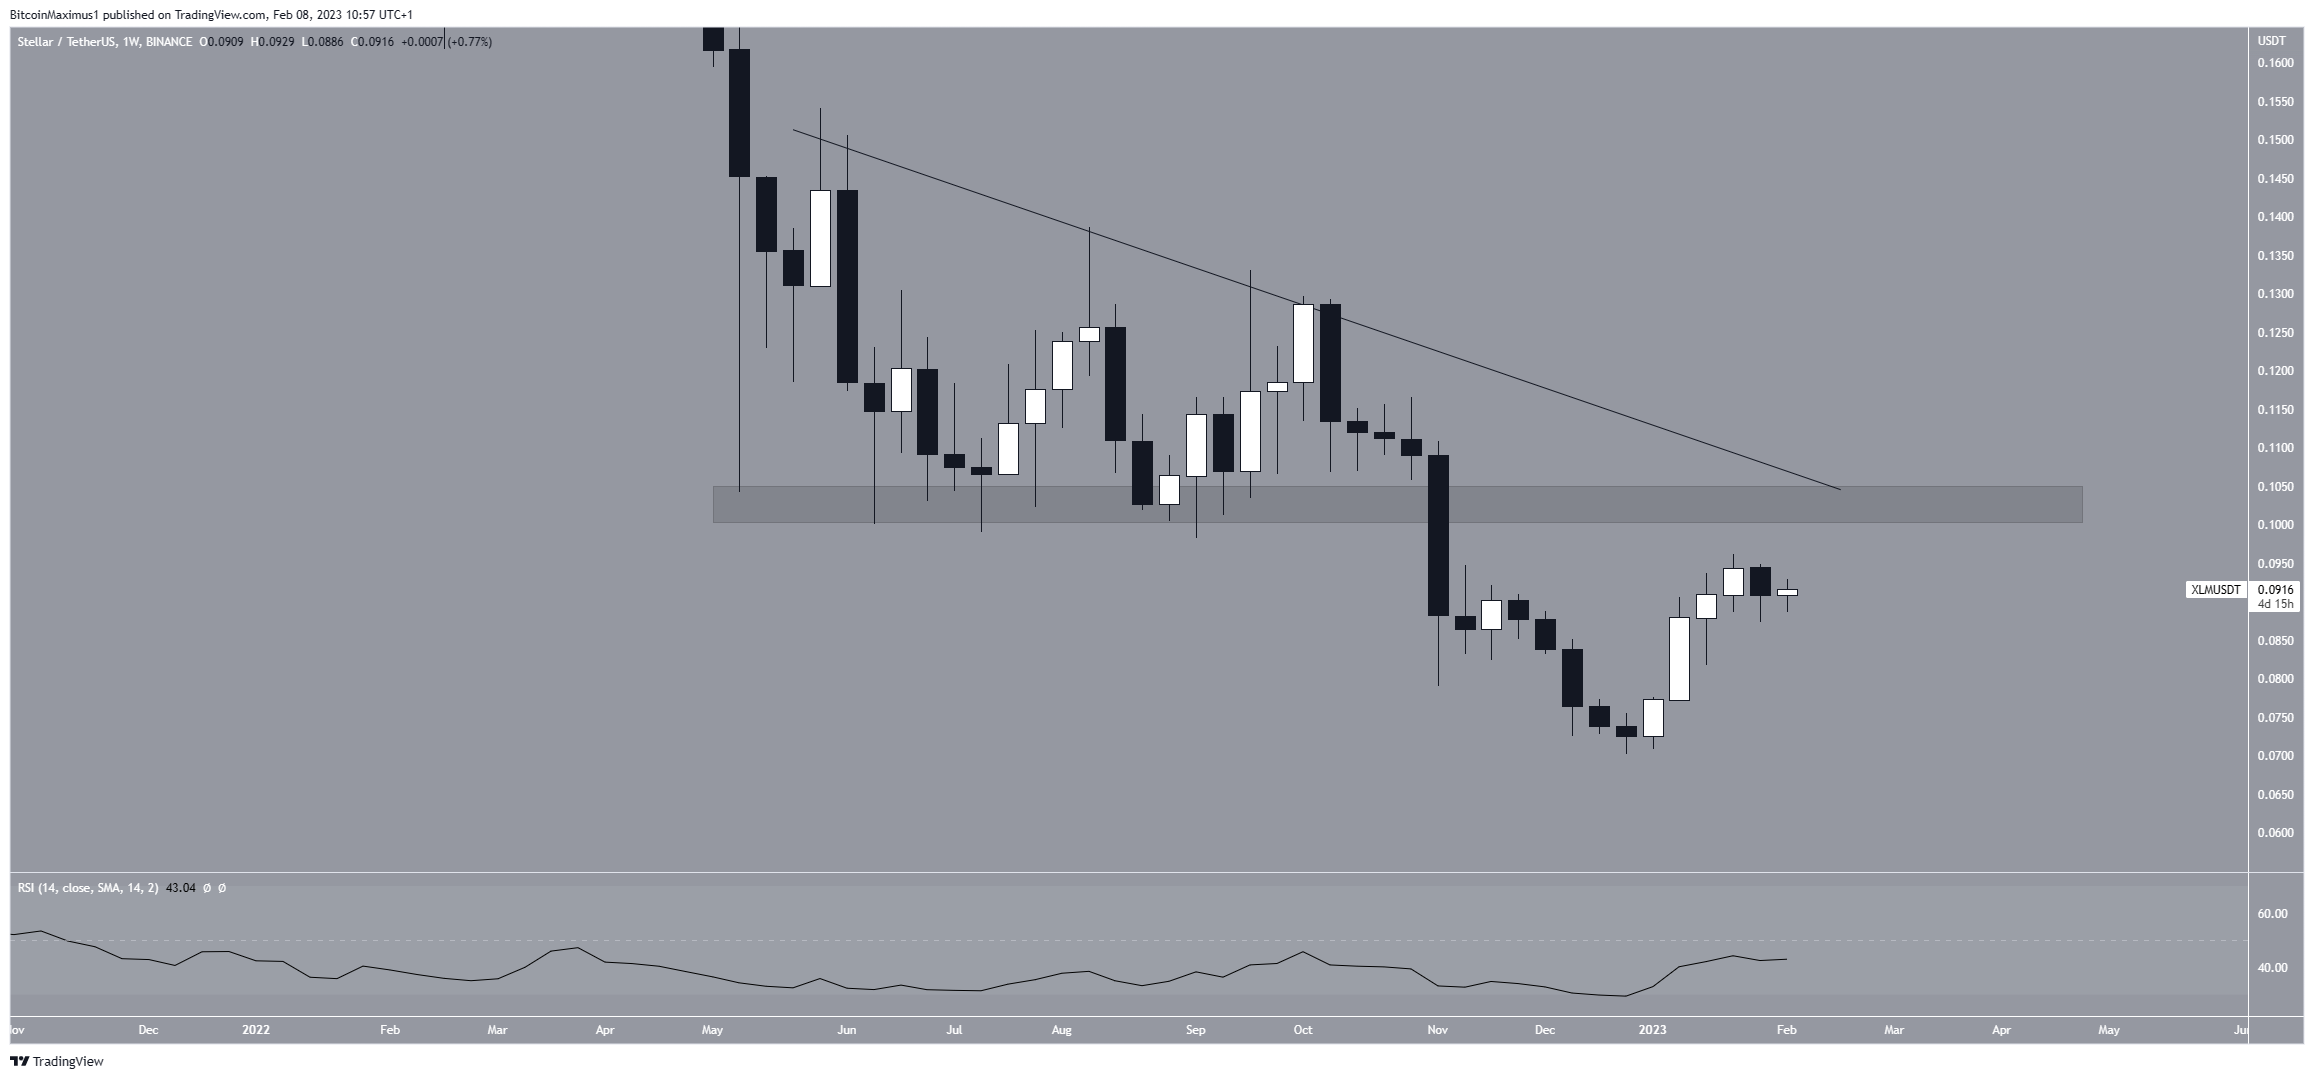
XLM is the native token of the Stellar network. Stellar aims to become a financial systems payment network that focuses on underdeveloped portions of the world. The weekly time frame shows that the Stellar price created four bullish candlesticks in Jan. The streak ended with a bearish candlestick last week.
However, the price has not reached the $0.102 resistance area or a descending resistance line in place since May 2021. If the price gets there, the area could cause a rejection. On the other hand, a decisive close above it would confirm the long-term bullish trend reversal.
The weekly RSI is increasing but is still below 50. This does not help in determining the direction of the long-term trend.
Stellar Price Consolidation Could Lead to Breakout
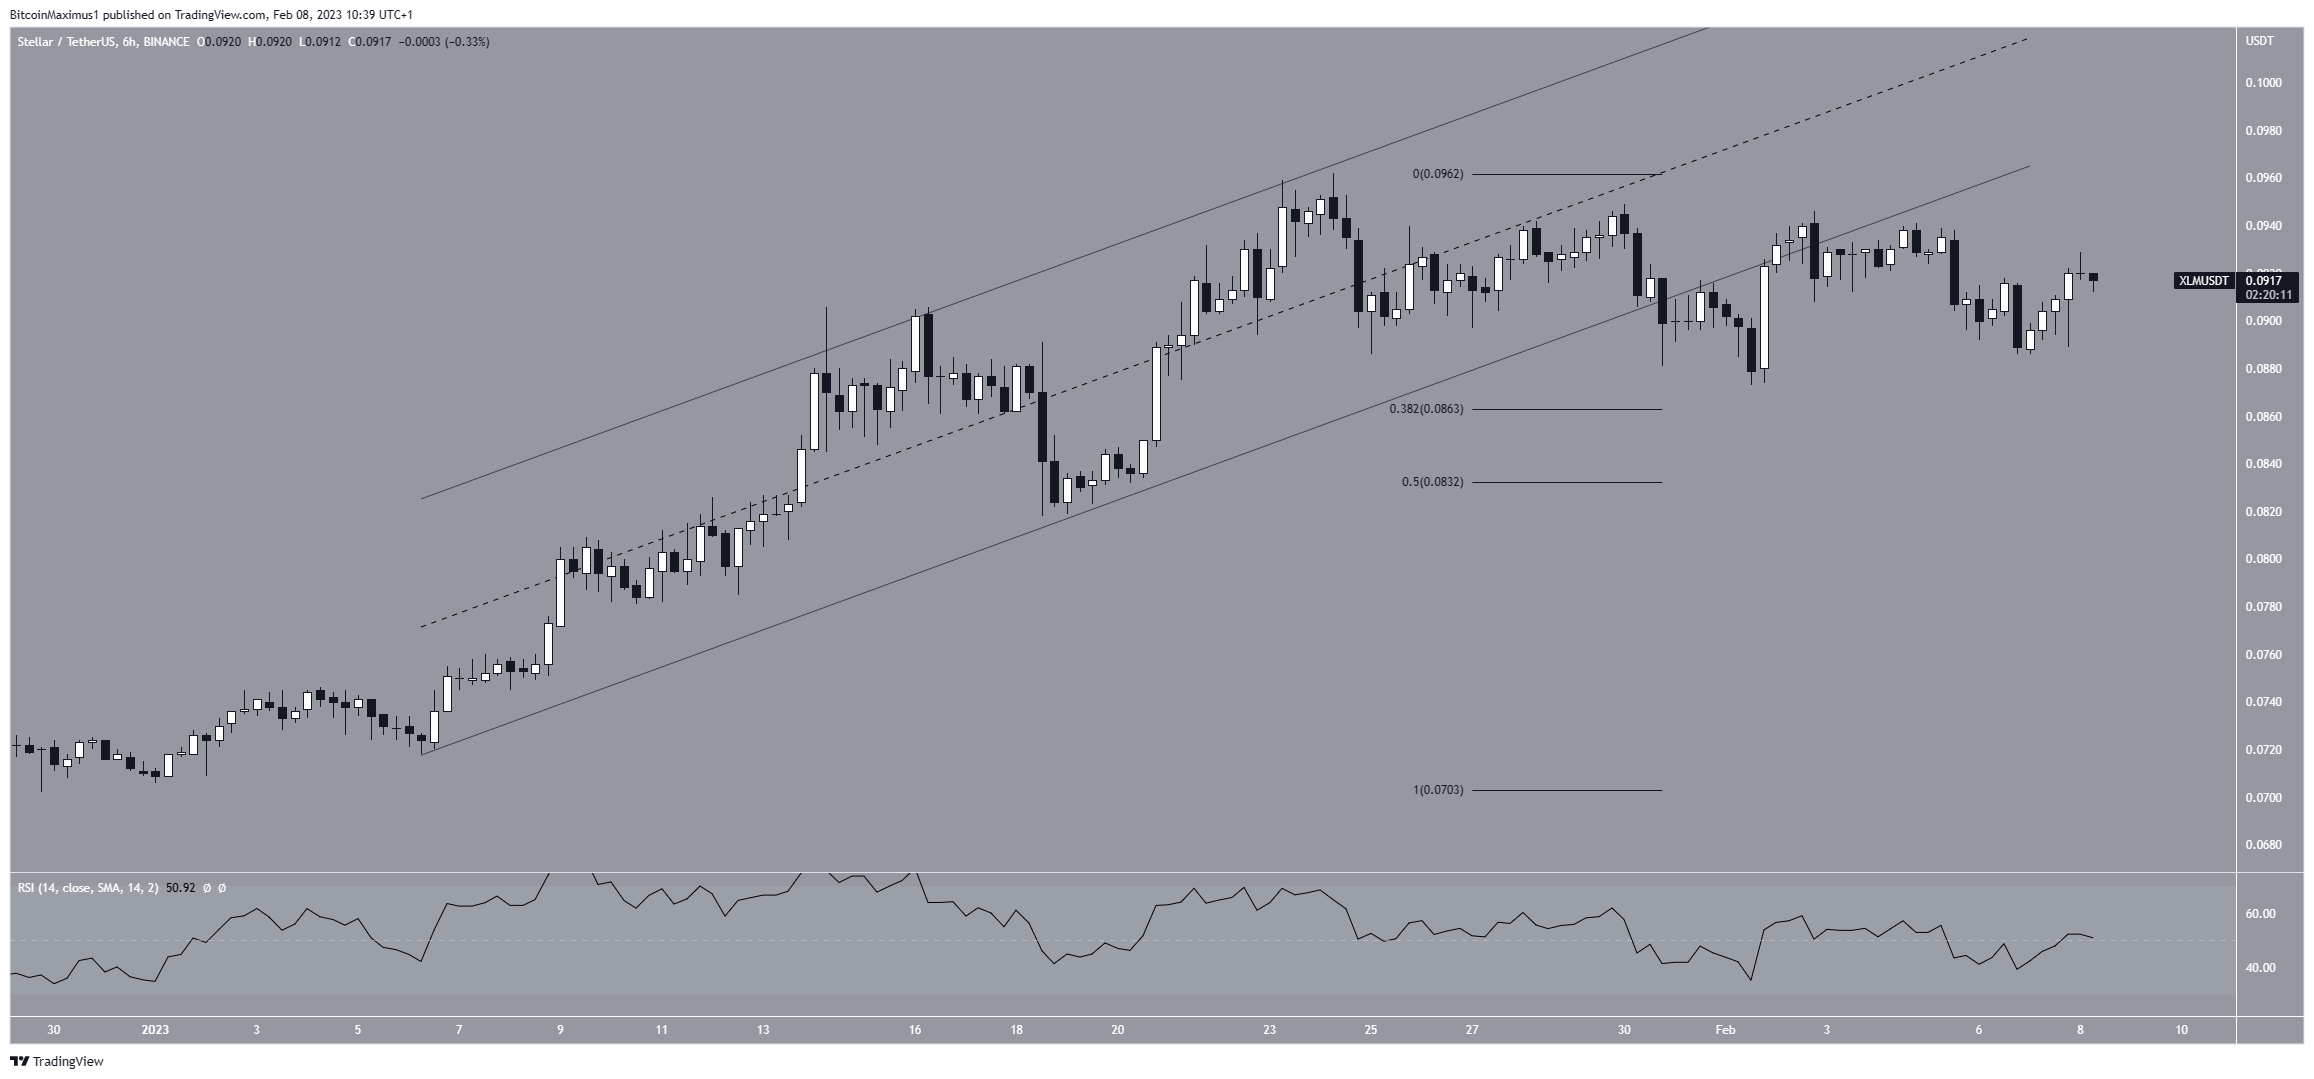
The Stellar price had increased inside an ascending parallel channel since the beginning of the year, reaching a high of $0.096 on Jan. 24. However, the price broke down afterward, validating the channel as resistance on Feb. 2 (red icon).
Despite the decrease, the digital currency has not reached either of the Fib support levels at $0.086 and $0.083, respectively.
The RSI is at 50, which is a sign of a neutral trend. As a result, a look at a lower time frame is required to determine the future trend’s direction.
The short-term two-hour chart supports the possibility of a breakout. This is because the XLM price is now trading inside a descending parallel channel, which is considered a corrective pattern. Since the price is trading in its upper portion, a breakout is the most likely scenario. This could occur in the next 24 hours.
Since the 0.382 Fib retracement support level coincides with the channel’s support line, it would be possible for the price to fall to it without invalidating the bullish scenario.
However, a breakdown from the channel would indicate that the Stellar price is still correcting.
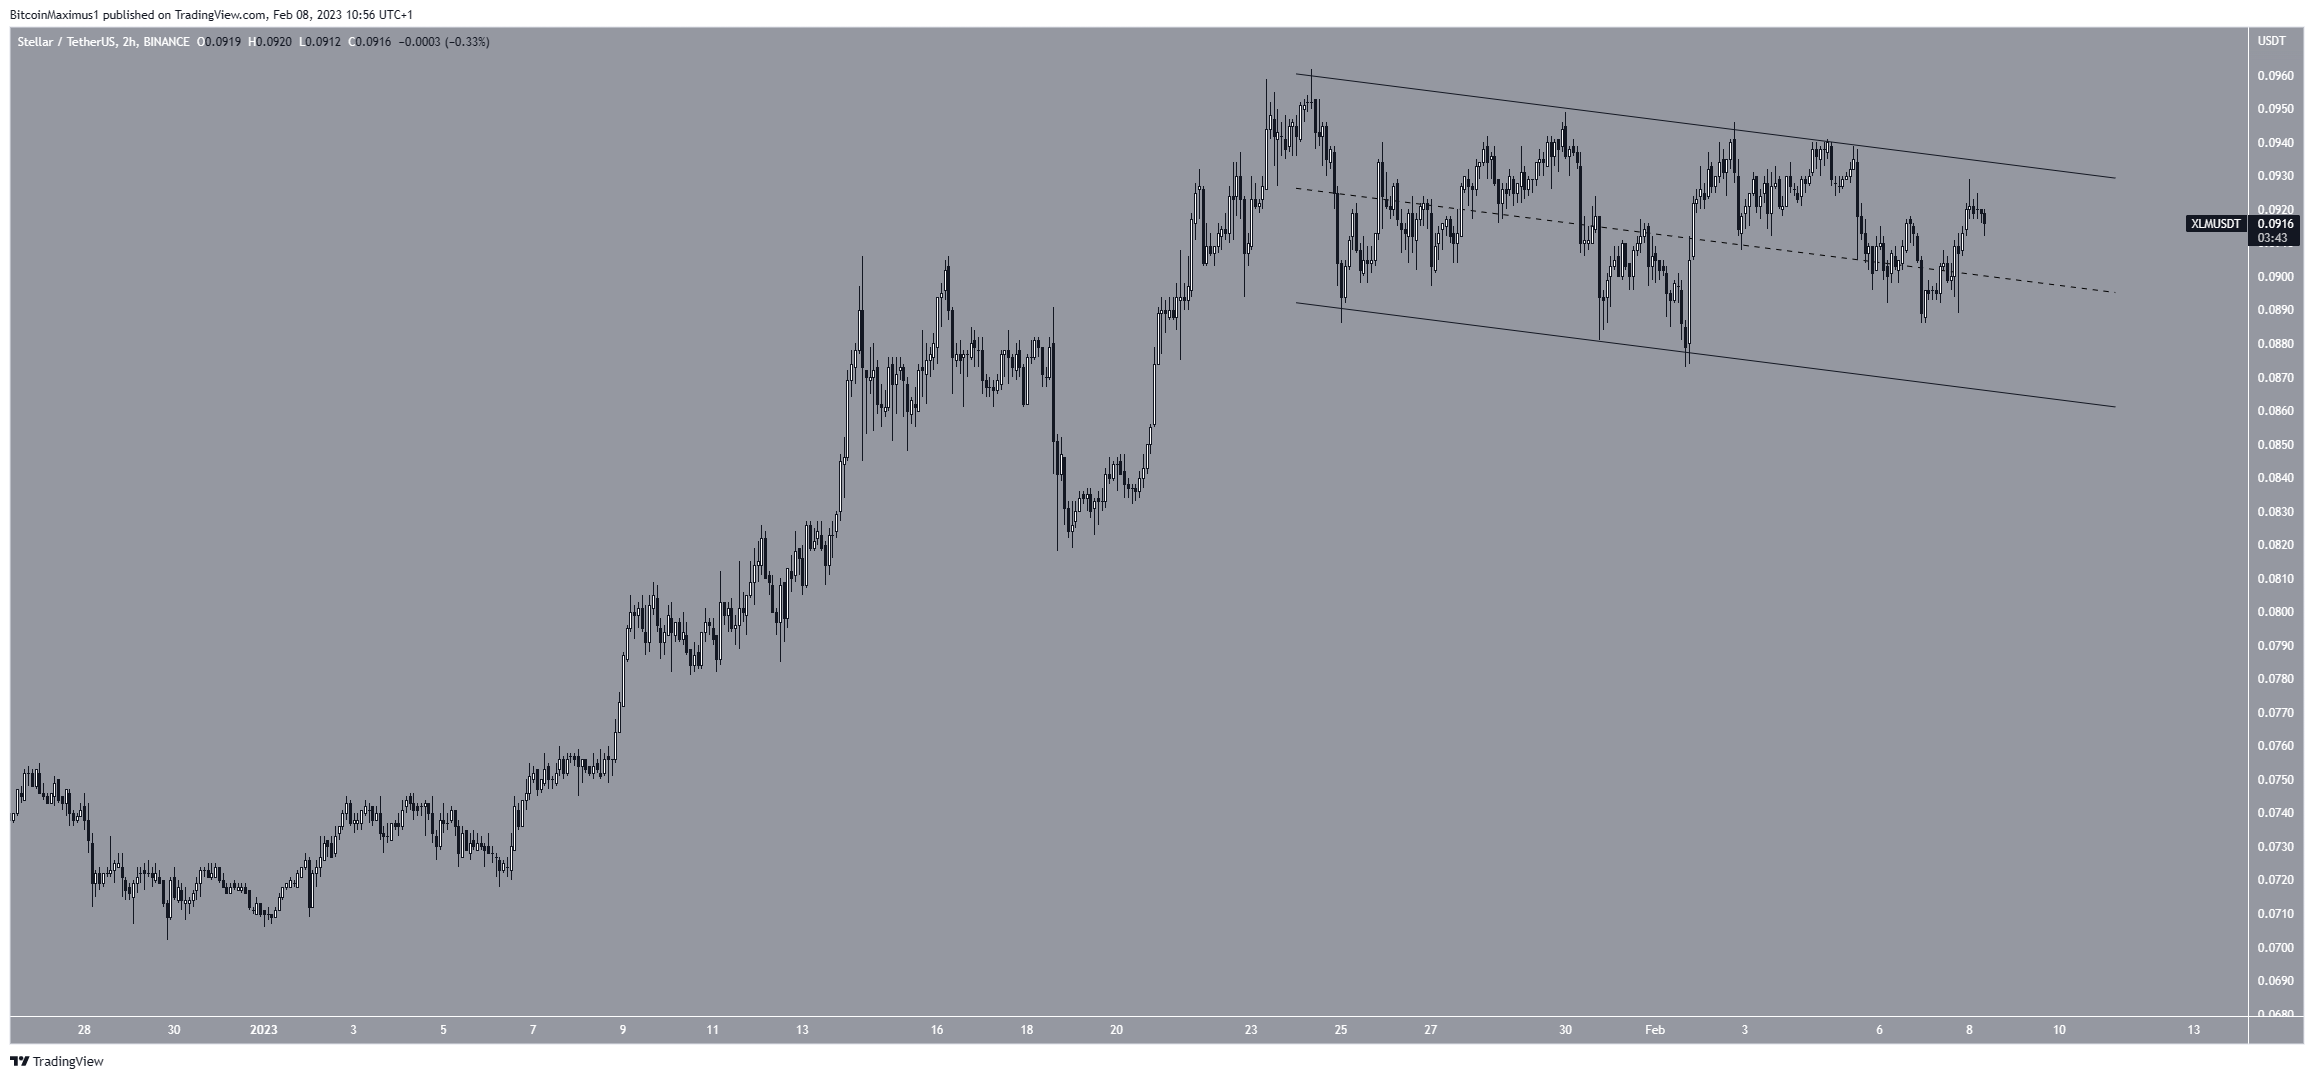
To conclude, the most likely Stellar price forecast is a breakout from the short-term channel and an increase toward $0.102. On the other hand, a breakdown from the channel would indicate that the trend is still bearish and could lead to lows near $0.803.
For BeInCrypto’s latest crypto market analysis, click here.


