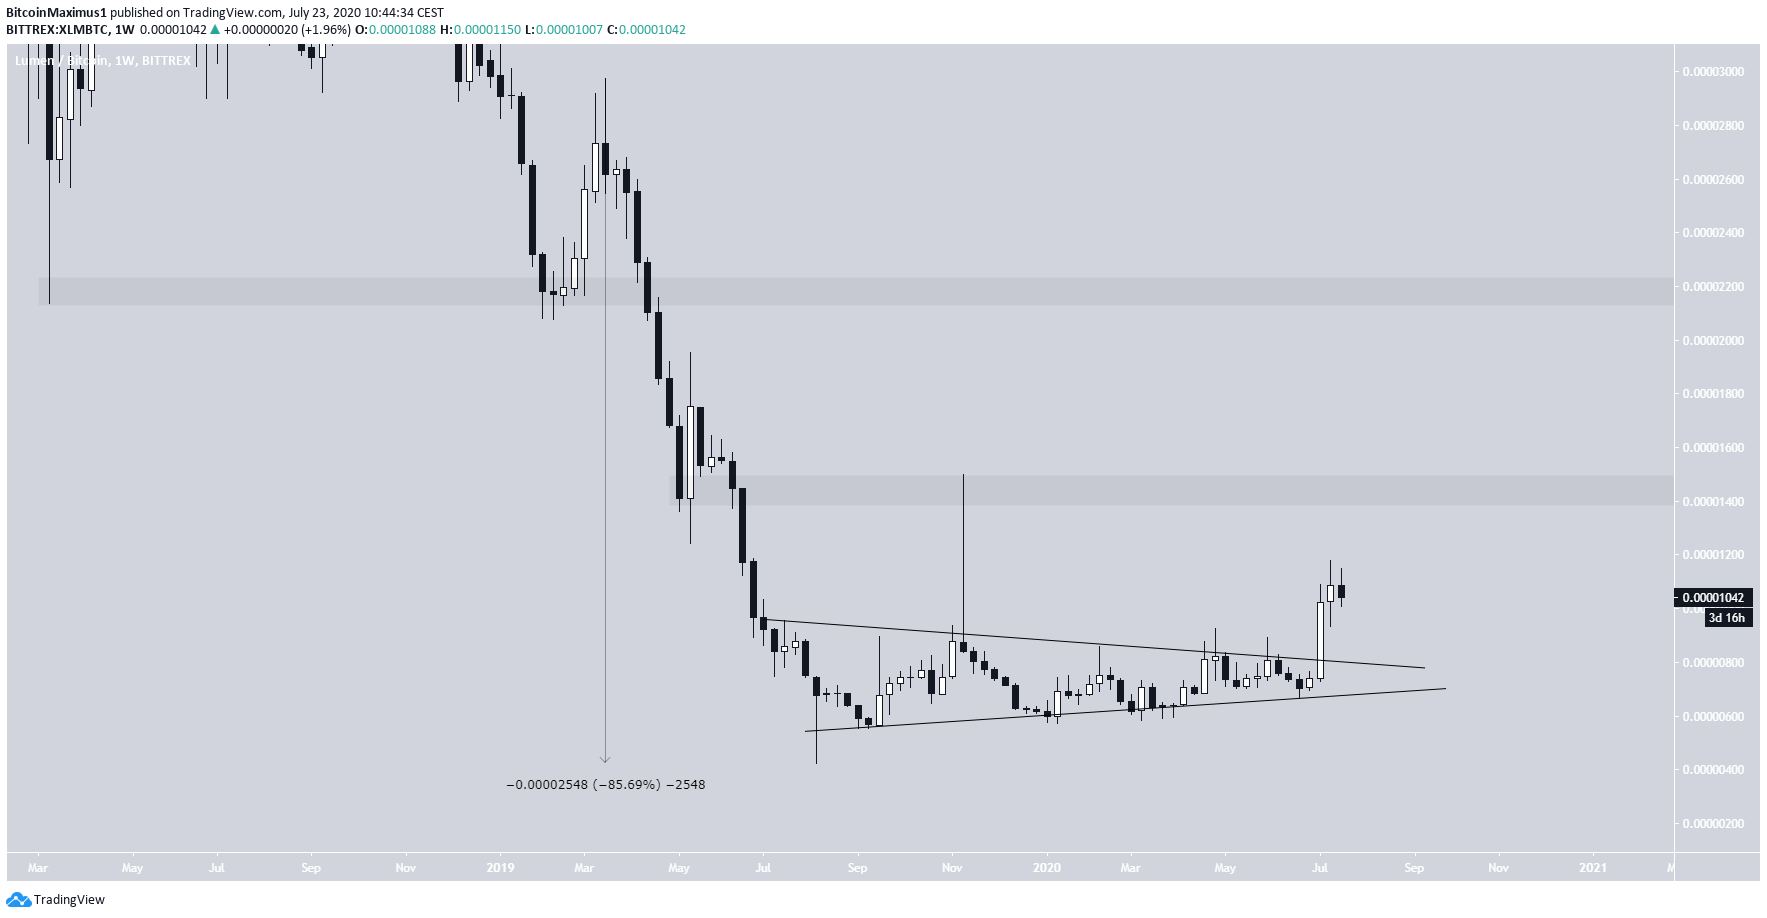
The Stellar (XLM) price has broken out from a long-term symmetrical triangle, potentially signaling that it has begun a bullish trend.
The XLM price has been in a downward spiral since November 2018, having lost about 90% of its value in the year that followed. The losses finally reached a bottom in August 2019, when the price created a long lower-wick that touched 433 satoshis.
After this, XLM began forming a symmetrical triangle and broke out of it during the first week of July.
XLM Breaks Free
Besides the triangle formation, the price also moved above the 900 satoshi resistance area, which is now expected to act as support.
Technical indicators are bullish. The weekly RSI is above 50 and moving upwards without showing signs of any bearish divergence. The price has moved above the 50-day moving average (MA), which had previously been providing resistance, and is now likely to act as support.
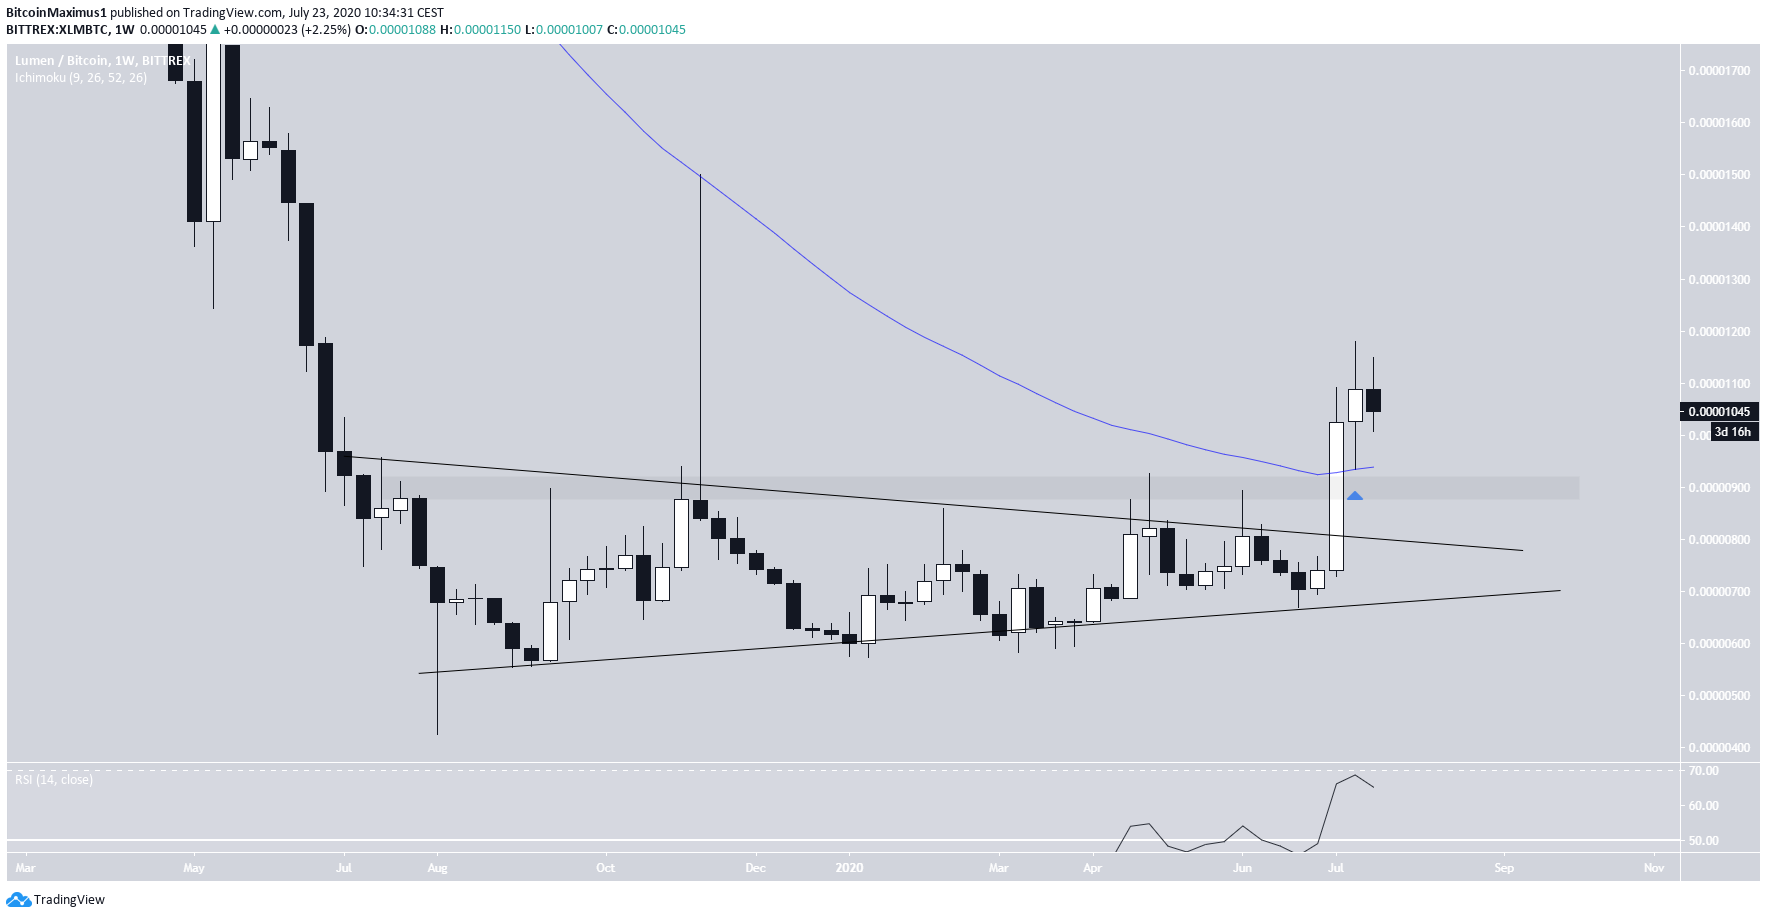
If the price continues increasing, the closest resistance areas would be found at 1,450 and 2,150 satoshis. While the first was reached by a long wick in November 2019, the latter has not been touched since April 2019.
One More Pump
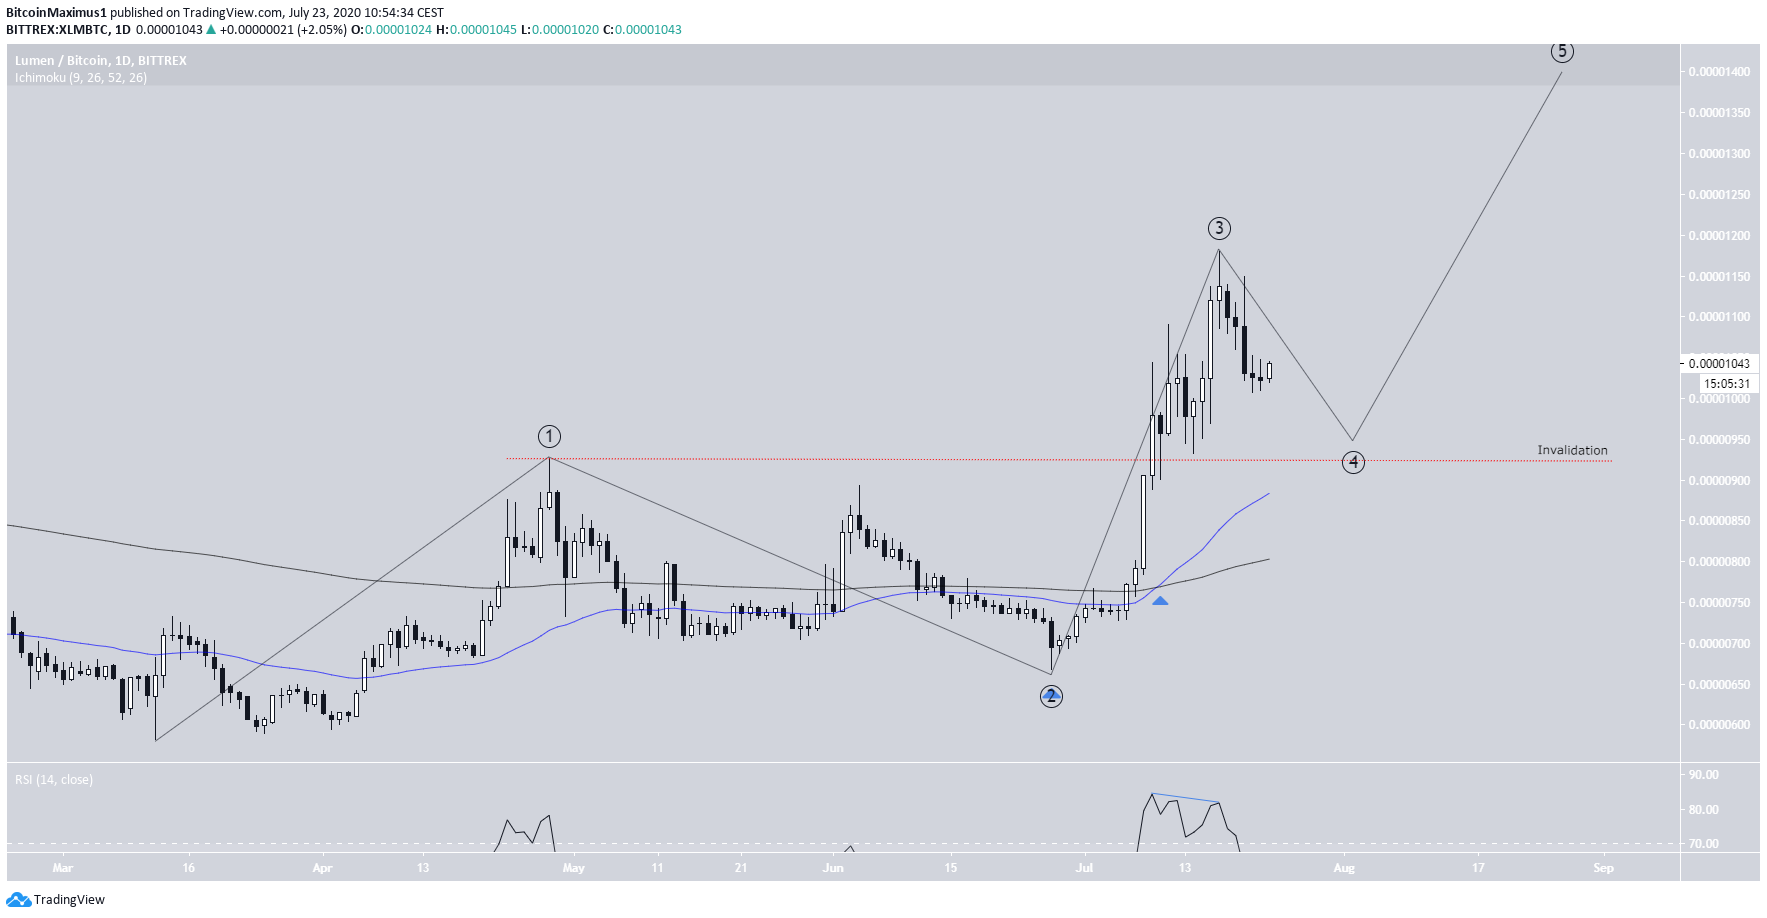
The daily chart shows that XLM has been accelerating upwards since June 27. However, it seems that the upward trend may have actually begun in May. The price looks to be currently in the third wave, which might have reached a top.
While the 50 and 200-day MAs have made a bullish cross, confirming the upward trend, there is a bearish divergence in the daily time-frame, indicating that a decrease could strike.
A dip back below the top of the first wave at 920 satoshis would likely invalidate this wave count.
Short-Term Movement
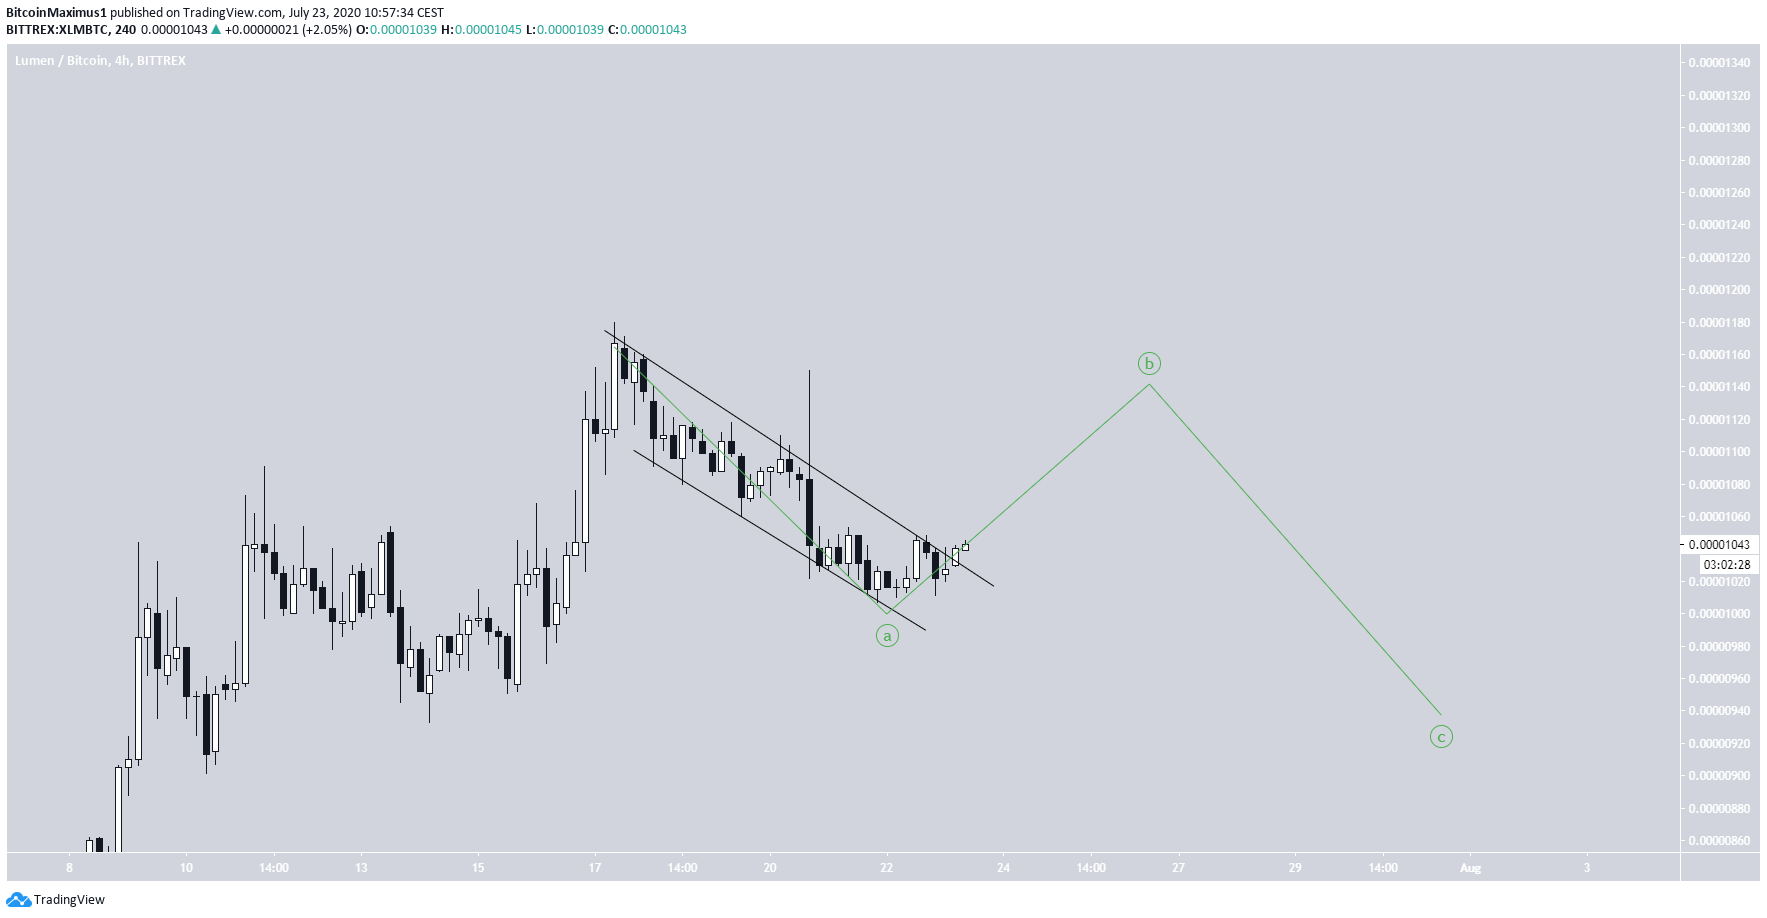
Cryptocurrency trader @TheEurosniper outlined a short term descending wedge, that could soon break out.
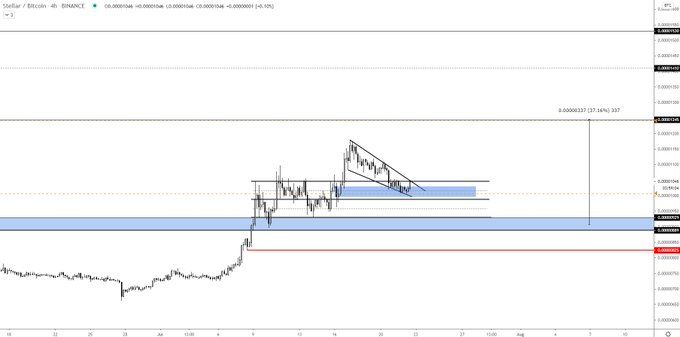
Since the tweet, the price has already broken out from the wedge. However, this is more likely to be the B-wave, after which another small decrease would be expected.
In any case, XLM is expected to continue its upward movement in the near future.